Voice Agent Observability Maturity Model: Five Levels From Call Logs to Root Cause
On this page
Most teams do not decide how observable their voice agent should be. They end up wherever the first incident left them: a provider dashboard, a folder of recordings, a few log lines. Then a caller complains, and nobody can say what happened.
This post gives you a ladder to place yourself on. It is a voice agent observability maturity model with five levels, and a voice agent observability maturity score tells you what to fix next. Each level lists what you can answer, the evidence that proves you are there, and the next step up. It is written for a Head of AI, an AI PM or an engineer who built a voice agent inside a larger product and now has to debug live calls.
One thing first. The five levels are Evalgent's own framework. Nobody has standardised them. We built the ladder from public engineering sources, linked below, and from how failures are actually debugged. We give no adoption statistics, because we have none. Every number in the worked examples is illustrative.
Neighbouring posts cover related ground, so this one links to them. What is voice agent observability defines the term. The 14-point checklist grades tools you might buy. Testing vs monitoring vs observability separates the practices and holds a broader quality ladder across all four. Root cause analysis explains the routine behind Level 5. This post ranks you by the questions you can answer about a call, not by the tools you own.
The five levels at a glance
Each level is defined by the question you can answer about a failed call. If you can answer the question for most of your calls, you are at that level. If not, you are below it.
| Level | Name | The question you can answer | Typical evidence |
|---|---|---|---|
| 1 | Call logs | Did the call happen, and how did it end? | Provider dashboard, recordings, transcripts |
| 2 | Joined records | What did each system record for this call? | One call ID across telephony, agent and tools |
| 3 | Traced turns | Which step was slow or failed? | A trace per call, with spans per turn and step |
| 4 | Searchable failures | What else failed this way? | Failure categories you can filter and group |
| 5 | Root cause loop | Why did it fail, and did the fix work? | Clustered causes, tests and a visible coverage gap |
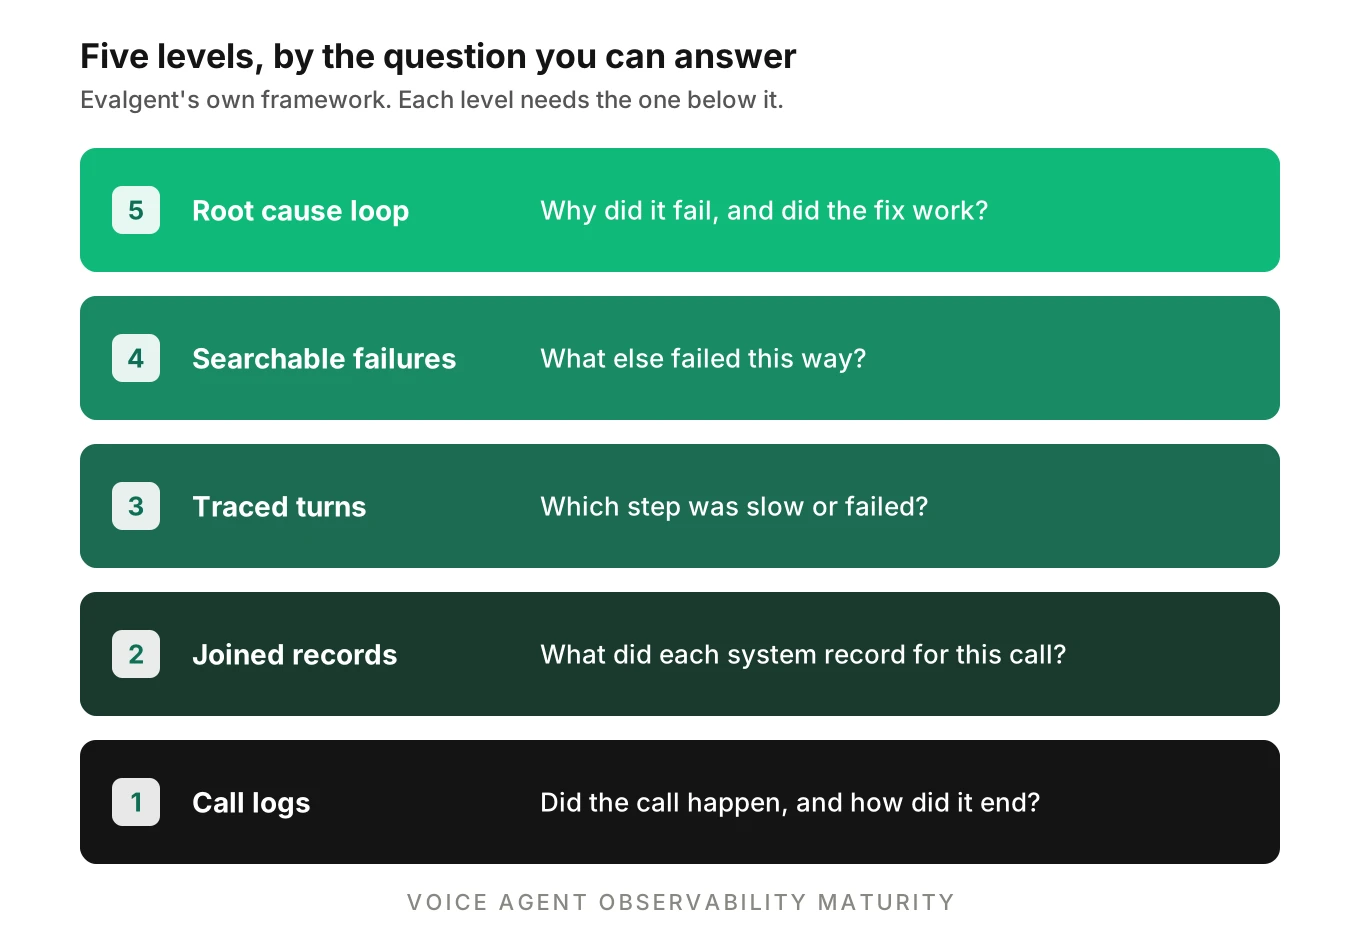
Read the ladder bottom to top. Each level needs the one below it. A clustering tool at Level 5 cannot group calls that were never joined at Level 2. That is the main reason to use a ladder: it stops you buying the top rung first.
Where the levels come from
The ladder is ours, but the ingredients are public. Four sources shaped it.
OpenTelemetry's signals. OpenTelemetry lists traces, metrics, logs, baggage and profiles as its telemetry categories. Its docs define a span as "a unit of work or operation". A log is "a timestamped text record", and a metric is "a measurement of a service captured at runtime". Levels 1 to 3 climb through those signal types.
The observability primer. OpenTelemetry's primer says observability lets you "understand a system from the outside" by asking questions without knowing its internals. It also names "unknown unknowns". Levels 4 and 5 aim at those unknowns, and need instrumentation to match.
DORA's split. The DORA research programme describes monitoring as gathering predefined sets of metrics or logs. It describes observability as exploring properties and patterns not defined in advance. Our reading, which is ours and not DORA's: Levels 1 to 3 mostly answer questions you chose in advance. Levels 4 and 5 answer questions you did not.
Google's SRE books. The SRE book says a monitoring system should answer two questions: what is broken, and why. Its troubleshooting chapter describes a loop of hypothesizing causes and testing them. It also notes that recent changes are a productive place to start. Its chapter on postmortem culture says the goal is to put effective preventive actions in place. Level 5 is that loop, applied to calls.
Other maturity models exist for software in general. Honeycomb has one, written by Rachel Perkins and last modified June 11, 2019. This post borrows its spirit and applies it to a phone call.
Level 1: call logs
At Level 1, you can find a call and see its outcome.
What you can answer. Did the call connect? How long did it last? Who hung up? What does the transcript say? Is there a recording?
What you cannot answer. Which step caused a pause. Whether a tool call worked. Which prompt version was live. Whether other callers had the same problem.
Evidence you are here. Your platform dashboard lists calls with a status. Recordings and transcripts exist. Someone can find a call by caller number and time.
Why teams stall here. Level 1 is the default, and it feels like observability because the call is right there to replay. But a transcript carries no timing, no tool status and no version. Our post on what to log on every call lists the missing fields.
Next step. Mint one call ID at the start of every call. Put it on every log line. Store the provider's call ID beside it.
Level 2: joined records
At Level 2, every system that touched a call can be found from one ID.
What you can answer. What did telephony record for this call? What did the agent log? Which tools ran, and what did they return? Did the write-back reach the CRM? Which release handled it?
What you cannot answer. The order and timing of events inside a turn. Whether this call was rare or common.
Evidence you are here.
- Pick any call at random. You can pull its telephony record, agent logs and tool logs without asking another team.
- Logs are structured, so they can be filtered by field.
- Each call carries version stamps for the release, prompt and model.
OpenTelemetry's docs recommend structured logs and describe correlating them with traces. That correlation only works if the ID exists first. See call ID correlation for the join across providers.
A gotcha: provider data arrives late. Twilio's Voice Insights call summary is one example of a provider record. A partial summary is available within ten minutes of the call ending. A complete one may take up to half an hour. A Level 2 join has to tolerate records that land after the call is already "done".
Next step. Move to one trace per call, with a span per turn and per step.
Level 3: traced turns
At Level 3, voice agent tracing is in place and you can say where a call went wrong.
What you can answer. Which step used the time in a slow turn? Did a tool fail or retry? Did the caller interrupt the agent? Is a latency percentile drifting for the current release?
What you cannot answer. Whether this was a one-off. What the failing call shares with other failing calls.
Evidence you are here.
- Each call has one trace. Each turn is a span, with child spans for speech-to-text, the model, tools and speech output.
- Interruptions are recorded as events, not errors.
- Metrics are computed per step and per release, and at least one alert fires on a symptom.
- Given a call that sounded wrong, you can name the first step that went wrong.
Framework docs describe this shape. Pipecat's OpenTelemetry docs describe a conversation span holding turn spans, and each turn holding STT, LLM and TTS spans. Its turn spans carry a turn.was_interrupted field. LiveKit's observability docs describe per-turn latency breakdowns and say spans can be exported to any compatible backend. See tracing a call end to end and OpenTelemetry for voice agents.
A trap at this level: status lies. In OpenTelemetry, a span's status defaults to Unset. The docs say that means the operation completed without an error. A slow tool that eventually answered is not an error, and neither is a fluent fallback reply. Every span can look healthy while the caller got the wrong answer. Our post on silent tool failures covers it.
Where voice agent monitoring lives. Level 3 is where the SRE book's "what is broken" question gets a good answer. Dashboards and alerts sit here. The monitoring guide and the APM post cover that work. Level 3 still explains one call at a time.
Next step. Put call context on every trace, then make all calls searchable by symptom.
Level 4: searchable failures
At Level 4, you can ask what else failed the same way.
What you can answer. How many calls had this symptom this week? Did the rate change after a release? Which tool, provider, region or call type holds most of them? Which callers never got an answer?
What you cannot answer. Which of several plausible causes is true. The split shows correlation, and correlation is not cause.
Evidence you are here.
- You can filter every call by symptom categories that come from traces and call data. Examples are long latency, dead air, unanswered callers, the agent interrupting the caller, the agent being slow to stop when interrupted, repeated tool calls, failed steps and the agent repeating itself.
- You can group those calls by release, tool, provider and region in one query.
- Failed and early-ended calls are kept, not sampled away. See sampling live calls and scoring every call.
- Personal data is masked before storage. See PII redaction.
Level 4 is where your questions stop being planned in advance. A new symptom shows up and you can ask about it without shipping new code. Field-level detail is in span attributes for voice agents.
Next step. Turn each large group into a tested hypothesis, and write down what you cannot tell.
Level 5: the root cause loop
At Level 5, you can say why a group of calls failed, and prove the fix worked.
What you can answer. Which single change explains most of this failure group? How many calls does each cause account for? Did the count fall after the fix? For which calls is the data blind?
Evidence you are here.
- Failures are clustered into causes, and each cause has a count, an owner and a fix.
- Each fixed cause becomes a regression test before the next release.
- After a release, you check that the cluster shrank in production.
- Calls with no usable data sit in a visible "undetermined" bucket.
- You report coverage: the share of calls that can support a verdict.
This is the SRE loop applied to calls. Form a hypothesis, test it against many calls, drop the ones the data contradicts. The routine is in voice agent root cause analysis. The grouping step, voice agent failure clustering, is in how to cluster voice agent failures. The test step is in the production feedback loop.
Honest limits. Level 5 does not mean you know every cause. It means you know how many calls each cause explains, and where you are blind. A team that says "undetermined for 6 calls, no version stamp" is further along than one that quietly guesses.
Next step. There is no Level 6. The work becomes upkeep: keep coverage high, keep stamps on every new release, and fold new failure types into the loop.
One bad call at every level
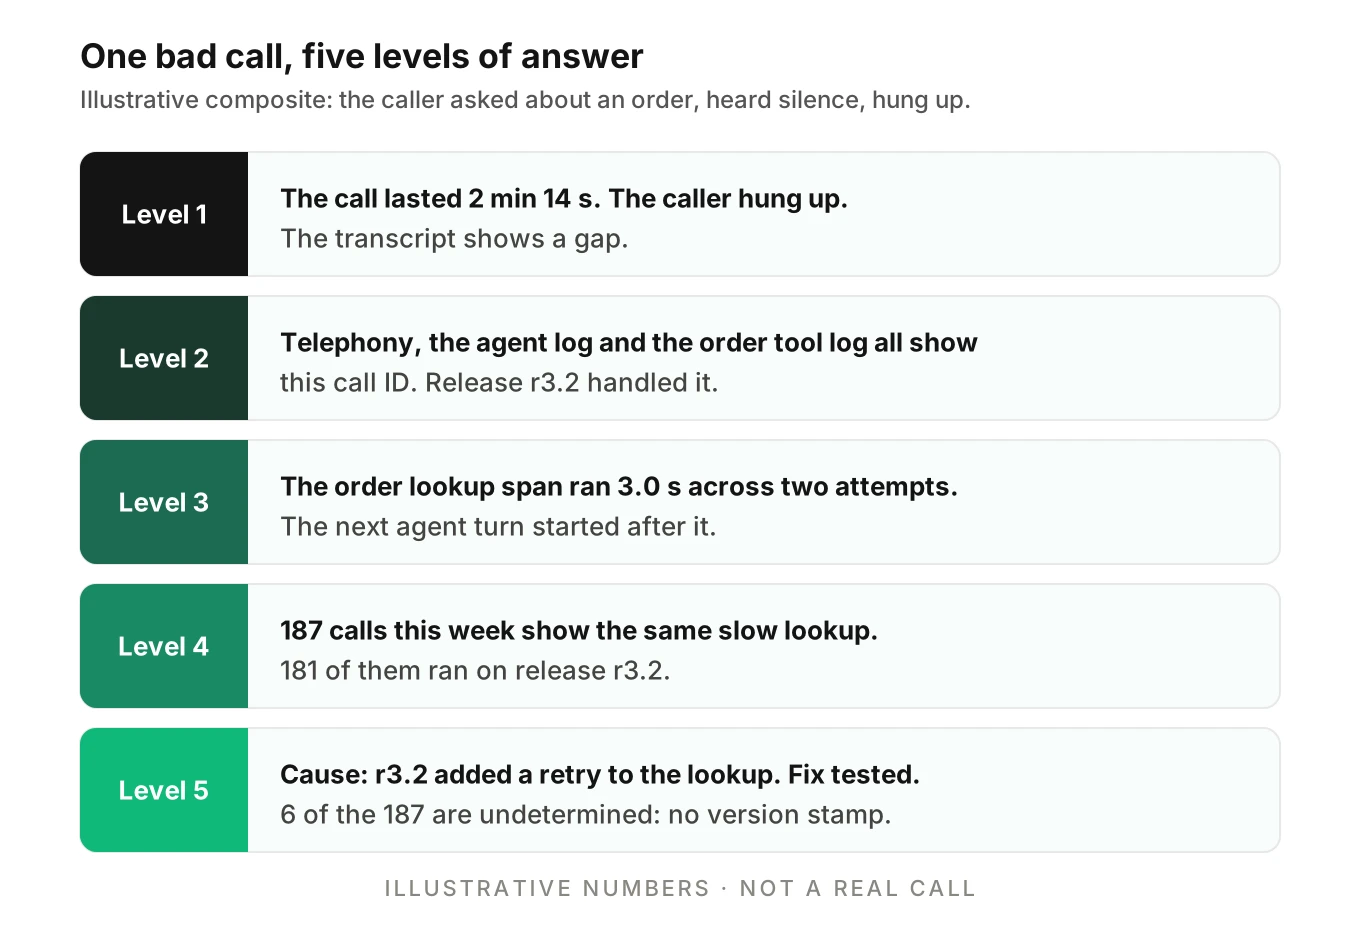
The same call looks different from each level. This example is illustrative. It is a composite built to show the ladder, not a real customer, and every number is an assumption.
A caller asks about an order. The agent goes quiet, then gives a vague answer. The caller hangs up.
| Level | What you can say about this call |
|---|---|
| 1 | The call lasted 2 min 14 s. The caller hung up. The transcript shows a gap. |
| 2 | Telephony, the agent log and the order tool log all show this call ID. Release r3.2 handled it. |
| 3 | The order lookup span ran 3.0 s across two attempts. The next agent turn started after it. |
| 4 | 187 calls this week show the same slow lookup. 181 of them ran on r3.2. |
| 5 | Cause: r3.2 added a retry to the lookup. Fix tested before release. 6 of the 187 are undetermined, with no version stamp. |
The call does not change. The question you can answer does. At Level 1 the incident is a story. At Level 5 it is a ticket with an owner and a test.
Coverage: the number that qualifies every level
A level describes what you can do on a call that has the data. It says nothing about how many calls have it. That is coverage, and it is the honest caveat on every level above.
Take an illustrative fleet of 1,000 calls. Suppose 860 have a full trace and call details. Another 90 have call details but no trace. The last 50 have only a provider record.
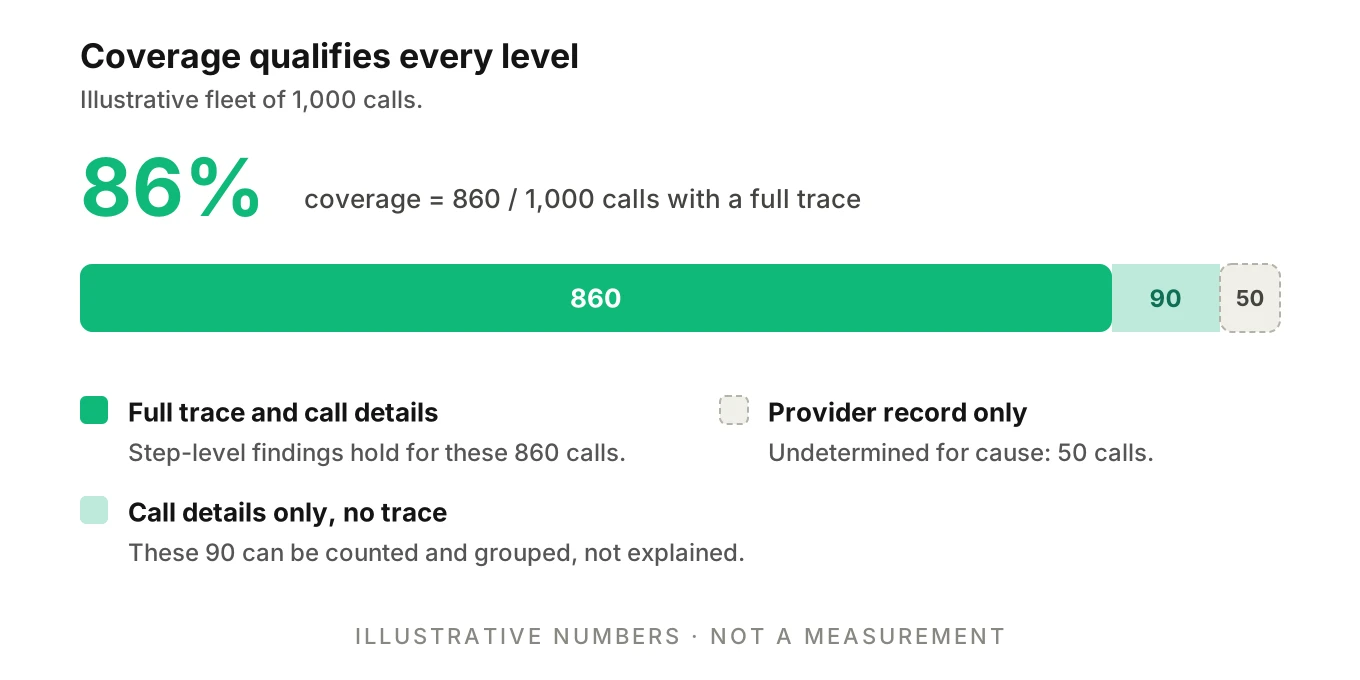
The arithmetic is simple. Coverage is 860 divided by 1,000, or 86 percent. Step-level claims hold for 860 calls. The 90 can be counted and grouped but not explained. The 50 are undetermined for cause.
Now picture a dashboard that says "no repeated tool calls this week". It is true for 860 calls and silent on the other 140. Show coverage next to every finding.
Two teams can both claim Level 3. One covers 95 percent of calls and the other 40 percent. They are not equally mature. Treat trace coverage as a second axis, and report both.
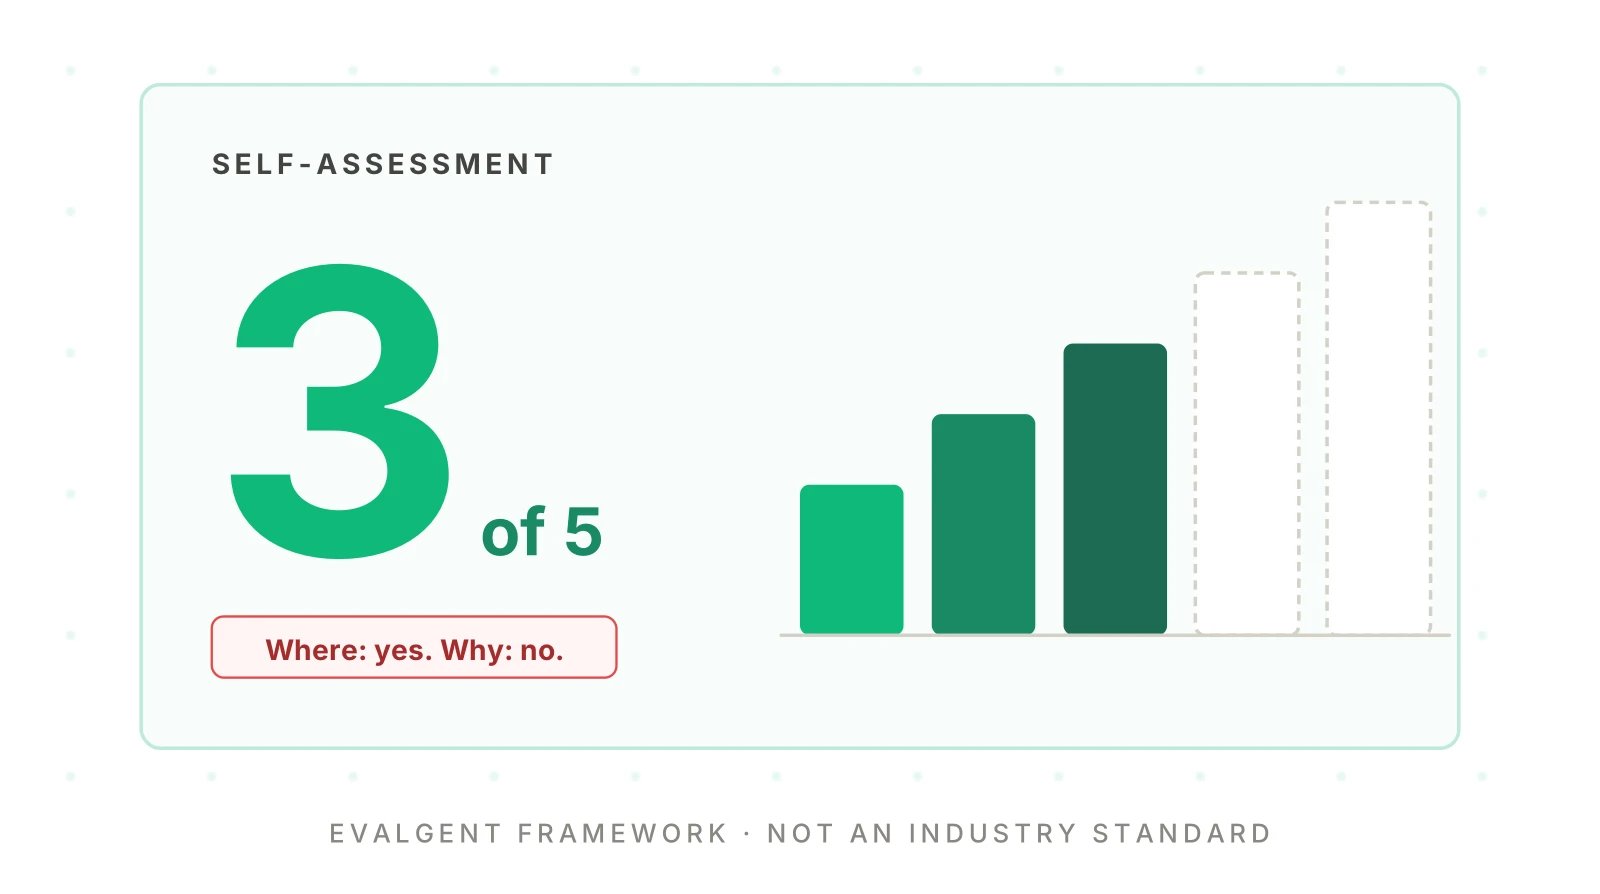
How to score your voice agent observability maturity in five steps
This voice agent observability self-assessment takes one afternoon and needs no tools. Use real calls from last week, not a demo.
1. Pull ten recent calls - Choose them at random, plus two that callers complained about. Write each call ID on a sheet.
2. Ask the Level 1 and 2 questions - For each call, can you find the outcome, and then pull telephony, agent and tool records from one ID? Mark yes or no per call.
3. Ask the Level 3 question - For each call that sounded wrong, can you name the first step that went wrong, with a timing? Mark yes or no.
4. Ask the Level 4 and 5 questions - Can you list every call this week with the same symptom? Can you name a cause and show the count? Do you know which calls are undetermined?
5. Take the lowest level you cannot pass - Your level is the highest one where almost every call passes and all levels below it pass too. Note the share of calls that passed. That is your rough coverage.
Use a floor, not an average. A Level 4 feature on top of broken Level 2 joins does not count. And score the complaint calls, not only the easy ones.
A voice agent observability roadmap, one step at a time
Each level's next step is listed above, and you need only the one for your level. A team running a few hundred calls a week may be well served at Level 3. The right level depends on call volume, what a bad call costs and how often you ship changes. The pilot-to-production guide covers when volume and risk arrive.
Common mistakes when climbing the levels
- Buying the top rung first. A grouping tool on top of unjoined records groups nothing.
- Sampling away the failures. Sampling routine calls is fine. Sampling out the errors and early hangups removes the evidence Level 4 needs.
- Hiding the blind spots. Calls without data belong in a visible bucket, not in a rounded-up percentage.
- Skipping the test. A fixed cause with no regression test comes back with the next release.
Where Evalgent fits
Evalgent is a testing, evaluation and monitoring platform for voice agents. Its production call monitoring, which is live, flags problems such as tool-call failures and latency spikes, with fix recommendations. That sits at Levels 3 and 4 of this ladder.
Evalgent Observe, which is launching, is aimed at Levels 4 and 5. It traces each failure to the step or handoff that caused it. It clusters failures into root causes, so a team fixes causes, not single calls. It is stack-agnostic and ingests data in OpenTelemetry format. Where the data you supply cannot support a verdict, it says "undetermined" and shows the coverage gap. Evalgent does not sit in the media path, so nothing touches live audio or slows a call.
For the test half of Level 5, Evalgent Reviews replay test calls with audio and transcript together and show the exact tool payloads. That makes a clustered cause easy to turn into a scenario. If you want to see how the ladder maps to your stack, you can book a walkthrough. The self-assessment above works without any of it.
Frequently asked questions
What is a voice agent observability maturity model?
It is a ladder that ranks how well you can explain a failed call. Each level is defined by the questions you can answer and the evidence that proves it. The one in this post is Evalgent's own framework with five levels. It is not an industry standard.
What are the five levels of voice agent observability?
Level 1 is call logs. Level 2 is joined records under one call ID. Level 3 is traced turns. Level 4 is searchable failures, grouped by symptom and context. Level 5 is a root cause loop with tests and a visible coverage gap. These voice agent observability levels are our framework.
How do I know which level my team is at?
Take ten recent calls, including complaints, and ask each level's question. Your level is the highest one where almost every call passes and every level below it passes too. Also note the share of calls that passed. That share is your rough coverage.
Is this an industry standard?
No. The levels are Evalgent's own framework, built from public sources such as OpenTelemetry, DORA and Google's SRE books. Other maturity models exist for software in general. We publish no adoption statistics, because we have none. Use the ladder as a self-assessment, not as a benchmark against other teams.
Do I need to reach Level 5?
Not always. A pilot with a few hundred calls a week may be fine at Level 3. Higher levels pay off when volume grows, a bad call is costly, or you ship changes often. Pick the level that matches your risk, and keep coverage high at that level.
What is the difference between call logs and traces for voice agents?
Call logs record what happened to a call: outcome, duration, transcript. A trace records the sequence and timing of steps inside it, as spans. Call logs vs traces for voice agents comes down to this. Logs say that a pause happened. A trace shows which step caused it.
What should I do first to move up a level?
Do the next step for your level, and only that. At Level 1, mint a call ID and attach it everywhere. At Level 2, add a trace per call. At Level 3, add context and symptom search. Skipping steps leaves gaps that higher tools cannot fill.
Does higher maturity need a vendor?
No. Structured logs, OpenTelemetry spans and a store you can query cover Levels 1 to 4. A vendor helps with grouping, review workflows and coverage reporting at Levels 4 and 5. Judge any tool by whether it works with your stack, exports your data and shows what it cannot determine.
The bottom line
Voice agent observability maturity is the range of questions you can answer about a failed call, from "did it happen" to "why, and did the fix work". Score yourself on real calls, climb one level at a time, and report coverage beside every finding.
Related Articles

How to automate voice agent testing: synthetic callers vs manual QA
Learn how ai test automation replaces manual QA for voice agents. Compare synthetic callers vs human testers, with a 5-step framework to scale without hiring.
Read more
AI Agent Testing vs Voice Agent Testing: What General Tools Miss for Voice
AI agent testing measures text outputs. Voice agent testing measures behaviour through an acoustic pipeline. Five failure categories general tools miss.
Read more