What Is Voice Agent Observability? Traces, Logs, Metrics and Root Cause
On this page
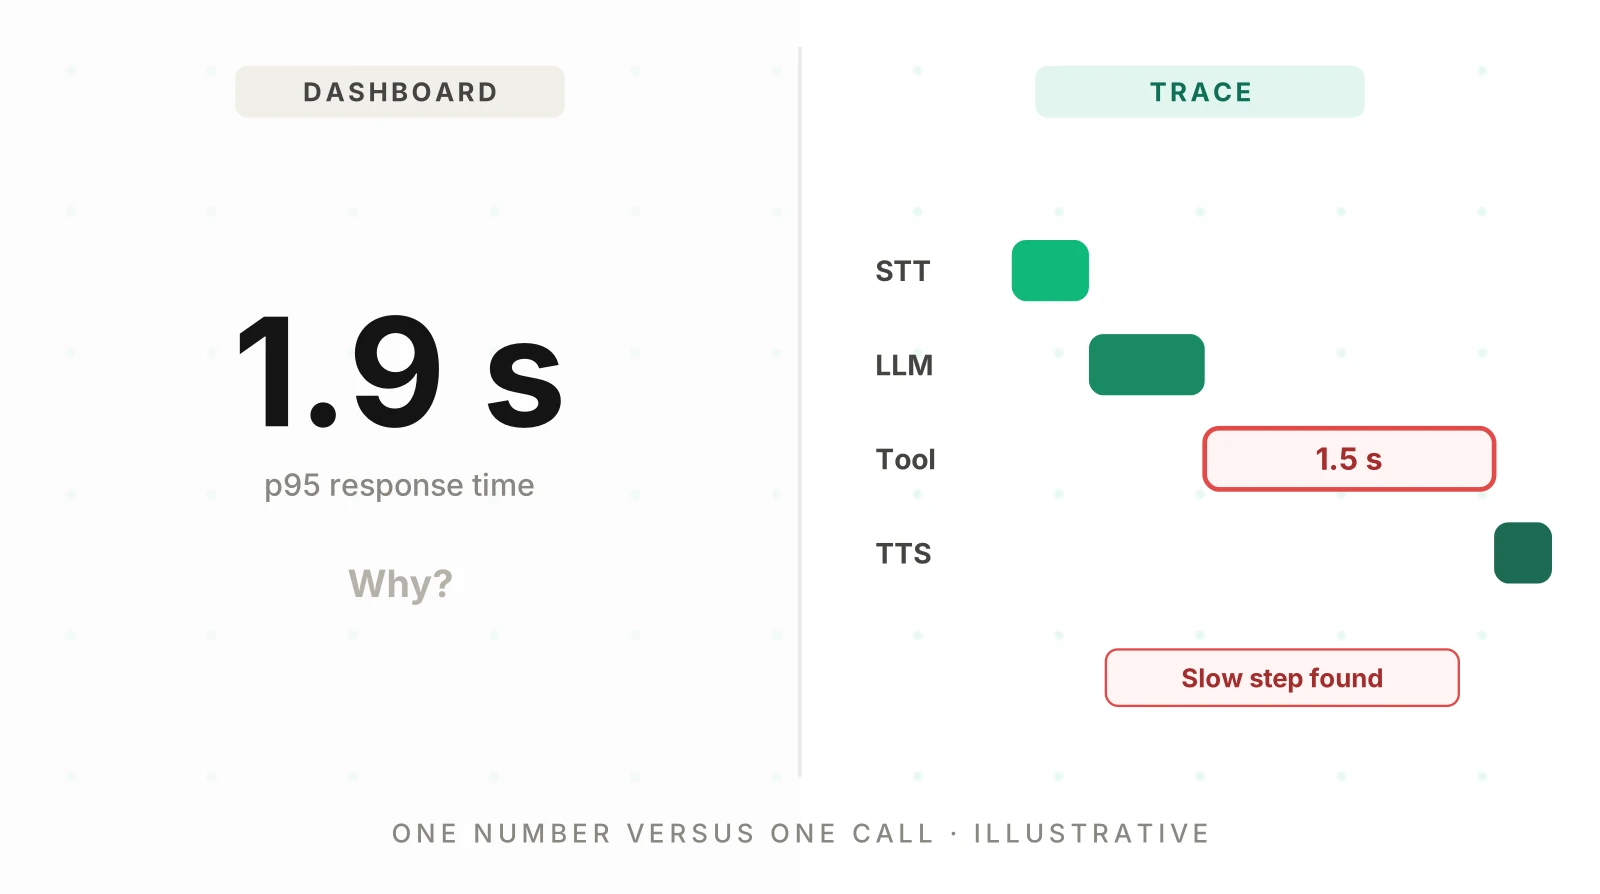
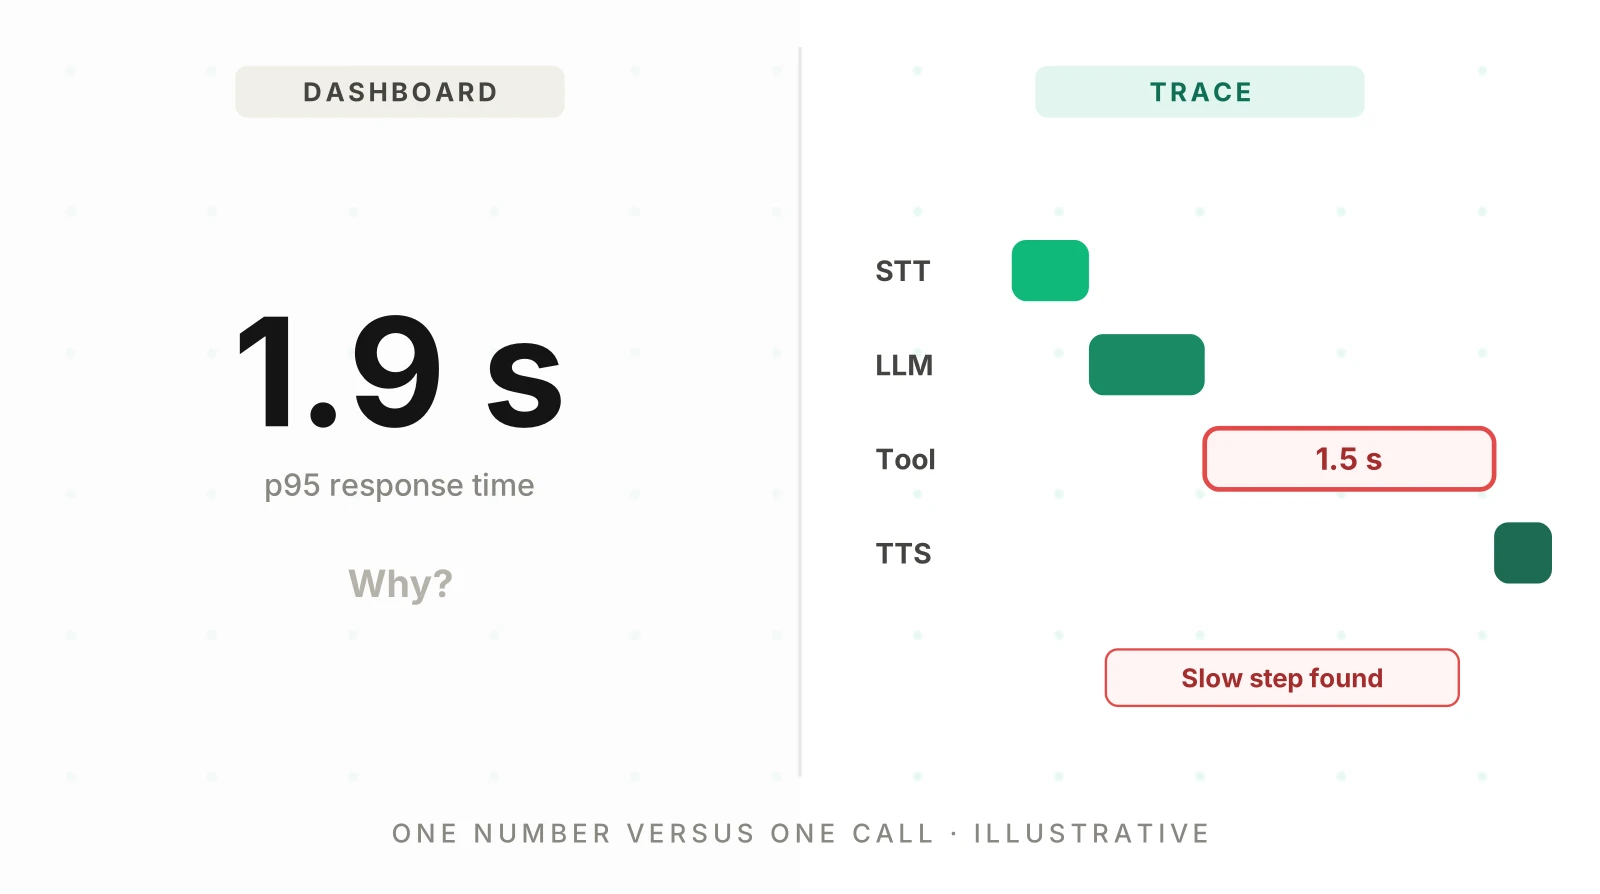
A dashboard tells you that something is wrong. Task success fell two points. The p95 response time crept up. A queue of callers hung up early. None of that tells you why, and the "why" is what your team has to fix.
This post is the definition hub for the topic. It answers one question, what is voice agent observability, in plain terms. It then names the signals it uses and the questions it answers. After that it covers what is different about voice and gives a per-call capture checklist. It is written for a Head of AI, AI PM or engineer who built a voice agent inside a larger product and now has to debug live calls.
Two neighbours go deeper on specific angles, so this post links to them instead of repeating them. The 14-point buyer's checklist grades tools. The testing vs monitoring vs observability model covers sampling math and alert design.
What is voice agent observability? A working definition
What is observability in voice AI? It is the same idea as in any distributed system, applied to calls. Searchers type "observability vs monitoring voice agents" and "voice agent traces logs metrics" because they want that mapping, and this post gives it.
OpenTelemetry's observability primer gives the cleanest general definition. Observability lets you understand a system from the outside by letting you ask questions about it, without knowing its inner workings. It also covers the unplanned question, the "unknown unknowns": "Why is this happening?"
Charity Majors put the same idea in practical terms in her observability manifesto. She describes it as the power to ask new questions of your system without having to ship new code. Her tests are blunt. If you pre-aggregate your data, or cannot group by high-cardinality fields, you are not doing observability.
Apply that to a phone call and you get a working definition.
Voice agent observability: the practice of capturing enough structured data about every call, joined by one call ID, that you can explain why any single call behaved as it did and group similar failures into root causes.
Three parts of that sentence do the work.
- Every call. A failure you sampled away cannot be explained later.
- Joined by one call ID. The telephony record, the trace, the logs and the recording all need a shared key.
- Explain, then group. One explained call fixes one call. A cluster of calls with the same cause fixes a class of failures.
Voice AI observability is the same idea applied to agents that talk. The next sections cover the data, and the section on voice covers why the data looks different from a web service.
The signals: voice agent traces, logs and metrics
The telemetry a call emits falls into a few types. OpenTelemetry lists traces, metrics, logs, baggage and profiles as its signal types. Three of them matter most for a voice agent. The table maps each to a voice example.
| Signal | What it is | Voice example | Question it answers |
|---|---|---|---|
| Trace | The path of one request through the system, made of spans | One call, with a span per turn and per step inside the turn | Where did this call spend its time, and which step failed? |
| Log | A timestamped record, ideally structured | "Tool lookup_order returned status 504" with the call ID | What exactly happened at this moment? |
| Metric | An aggregate of numeric data over a time window | p95 response time per prompt version, per hour | Is something drifting across many calls? |
| Call details | Facts about the call itself | Direction, duration, end reason, who hung up, release version | Which calls share this property? |
| Recording | The audio file, stored with an offset into the call | Stereo file, with the trace timestamp that maps to a second of audio | What did the caller actually experience? |
The first three are the "three pillars" language you will see everywhere. The last two matter more for voice than for a typical web service, because the call is the product. This post treats them as inputs to observability, not as signals in the OpenTelemetry sense.
Traces
The OpenTelemetry traces page defines a span as "a unit of work or operation". A trace is made of one or more spans. Spans carry a name, a parent, timestamps and attributes, which are key-value pairs that annotate the work.
For voice, the natural shape is one trace per call. This is distributed tracing applied to a conversation. Each turn is a span. Inside a turn sit child spans for speech-to-text, the language model, any tool calls and text-to-speech. Pipecat's OpenTelemetry docs describe nearly this shape: conversations contain turns, and turns contain STT, LLM and TTS spans. Its turn spans carry fields such as turn.number and turn.was_interrupted.
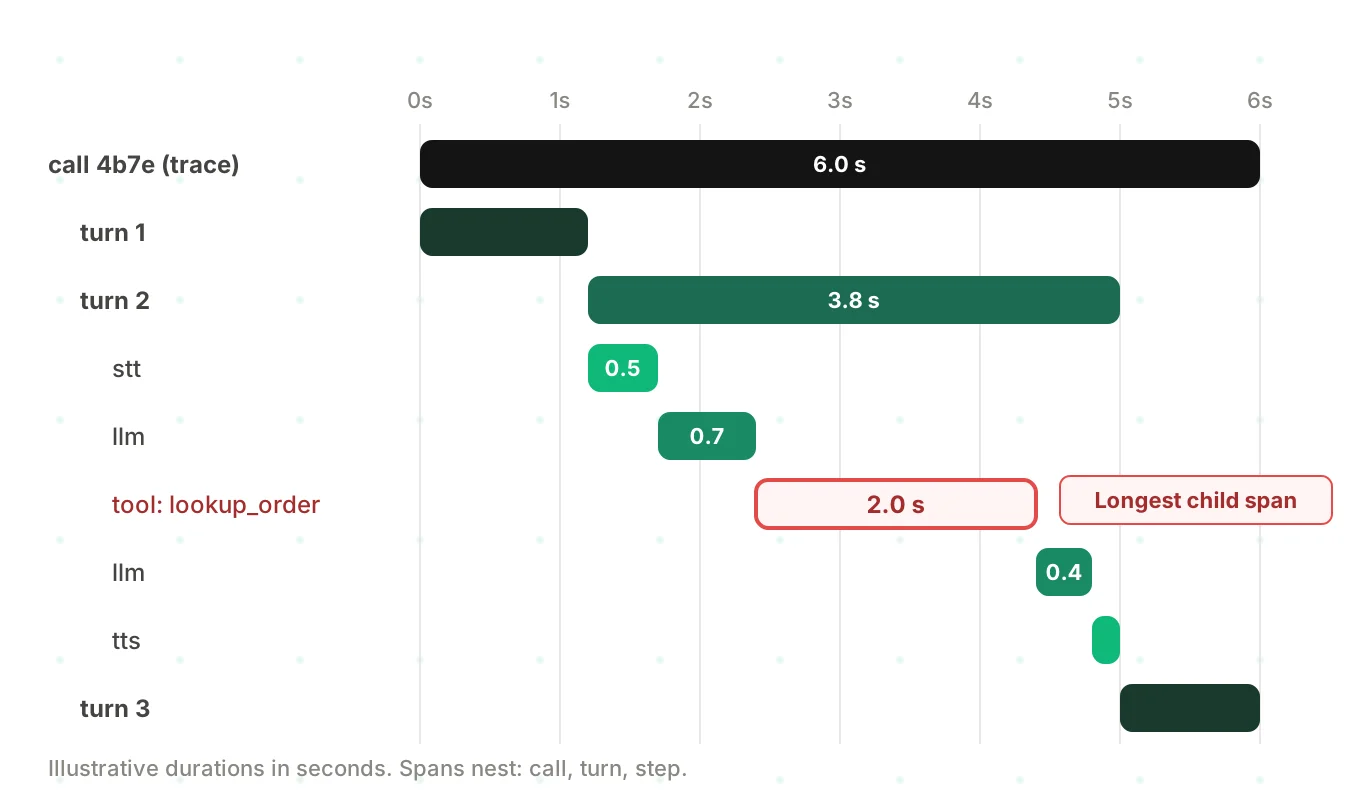
The trace answers the question a latency chart cannot. If a turn took 3.4 seconds, which child span used the time? The diagram above uses illustrative numbers, not measurements.
Logs
OpenTelemetry's logs page defines a log as a timestamped text record, structured or unstructured, with optional metadata. It recommends structured. Log records can carry a trace ID and a span ID, so a log line links back to the exact step that produced it.
Logs hold the detail that does not fit in a span attribute. Examples are the raw error from a CRM call, the reason a transfer was refused, or a warning from the audio pipeline. The rule is simple: every log line from every component carries the call ID.
Metrics
A metric is, in OpenTelemetry's words, a measurement of a service captured at runtime. Metrics are aggregates. They are cheap to store and fast to alert on, which makes them the right tool for the question "is this drifting?"
They are the wrong tool for "why did this call fail?" An aggregate has already thrown away the call. Google's SRE book names four golden signals for monitoring: latency, traffic, errors and saturation. They are a good start for a voice agent too. Treat them as the alarm, and the trace as the investigation.
Call details and recordings
Some of the most useful facts about a call are not spans at all. They are properties of the call: how it ended, who disconnected, how long it lasted, which release handled it. Twilio's Voice Insights call summary is one concrete example of a provider record. It reports per-call properties and quality metrics, split by network edge such as carrier_edge and sip_edge.
Call recordings are the other input. They are most useful when you can jump from a trace timestamp to the matching second of audio. That needs a stored offset, covered in the checklist below.
Questions observability answers that dashboards do not
A dashboard is built from questions you asked in advance. Observability handles the question you did not plan for. The table shows the gap with five common cases.
| The dashboard shows | The question you actually have | What you need on the call |
|---|---|---|
| p95 response time rose | Which step added the delay, and on which calls? | Per-step span durations, grouped by version |
| Task success fell | Did it fall for one prompt version, tenant or tool? | Version and tenant fields on every call |
| More calls ended early | Did the caller hang up, or did the agent end the call? | End reason and which side disconnected |
| Tool error rate is flat | Did a tool fail while the agent told the caller it worked? | Tool status and result, linked to the turn that followed |
| Silence on the line | Was it a slow model, a slow tool or the caller? | Speech start and end events, plus step spans |
The fourth row is the dangerous one. A tool returns an error and the agent carries on as if it succeeded. The caller hears a confident confirmation. The record in your CRM is wrong. Only a trace that joins the tool result to the next agent turn shows it. The post on silent tool failures goes deep on that case.
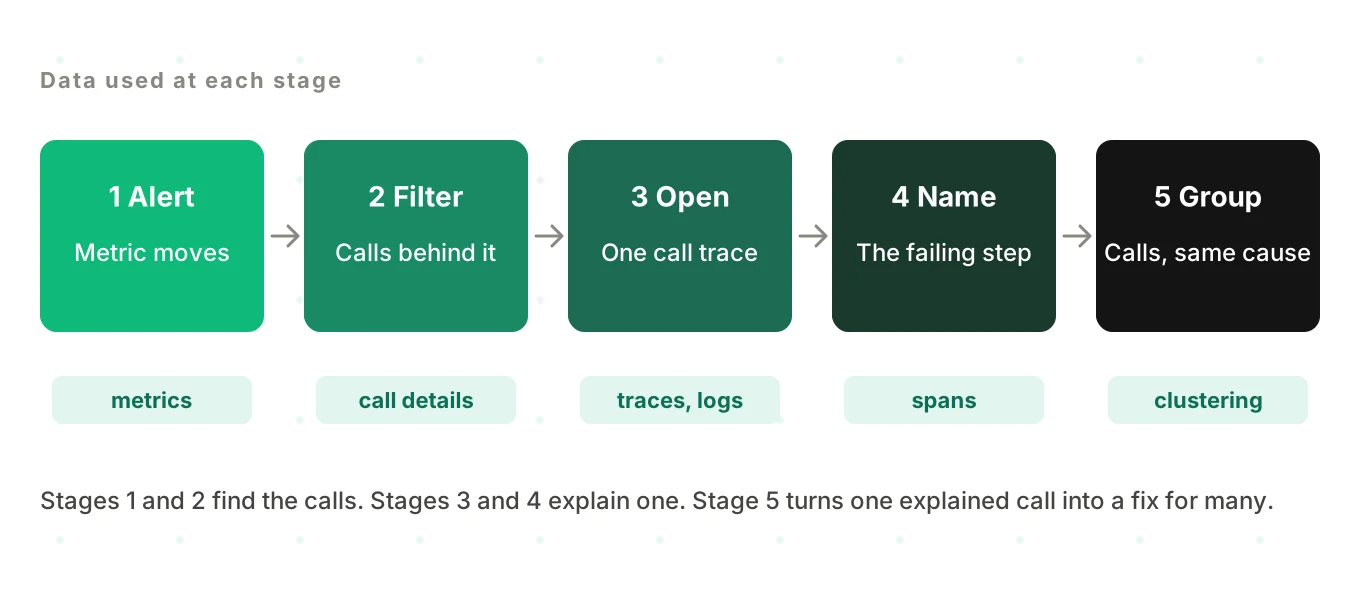
The workflow in the diagram is the daily use of observability. A metric raises the alarm. You filter to the calls behind it. You open a trace and find the step. Then you group other calls with the same cause. That last step is voice agent root cause analysis, also called failure clustering, and it is what separates fixing a call from fixing the agent.
Observability vs monitoring vs testing
The three practices answer different questions, so they use different data.
- Testing asks whether a build passes scenarios you chose, before it ships.
- Monitoring asks whether a known indicator is out of bounds right now.
- Observability asks why a specific call behaved as it did, including questions you never planned for.
The SRE book frames monitoring as answering two questions: what is broken, and why. Majors' framing is that monitoring is about known-unknowns and actionable alerts. Put together, monitoring pages you on a symptom. Observability gives you the evidence to find the cause.
This is the short version of observability vs monitoring for voice agents. The full model, with a failure taxonomy and a sampling guide, is in voice agent testing vs monitoring vs observability. For the monitoring side in practice, see how to monitor voice agents in production, voice agent SLOs and the voice agent KPI dashboard.
One link between them is worth stating. A failure you explain with a trace becomes a new test scenario. That is how observability feeds testing.
What is different about voice
Most observability guidance was written for request and response systems. A phone call has four properties that change what you capture.
A latency chain, not a single latency. The silence a caller hears is the sum of several steps: end of speech detection, transcription, the model, any tool, and speech synthesis. A single "response time" number hides which link was slow. Pipecat's docs record time to first byte per service as metrics.ttfb. LiveKit's Agents docs describe per-plugin metrics for STT, LLM, TTS and VAD components. Per-step numbers are the raw material.
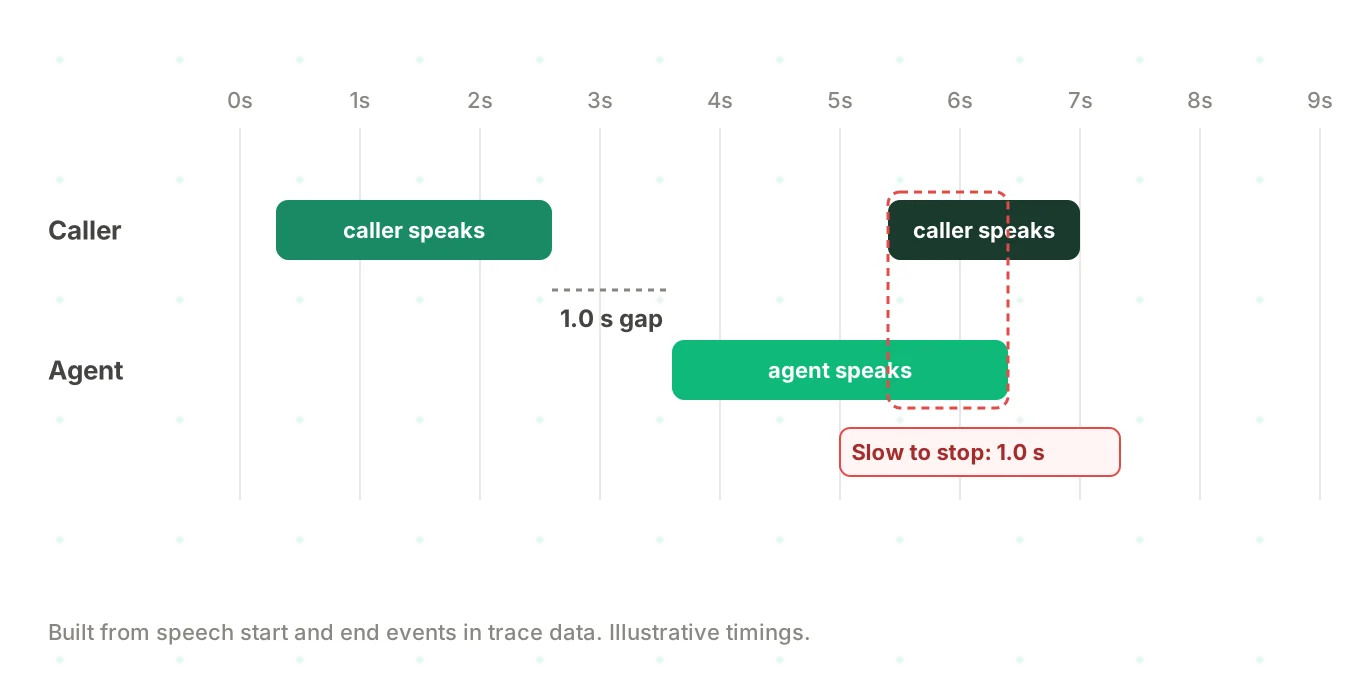
The turn is the unit of work. In chat, a request has a response. In a call, turns overlap and the order matters. Did the agent start talking before the caller finished? Did the agent stop when the caller interrupted? Turn-level timing answers that.
Interruptions are normal events. A cancelled speech stream is not an error. It is what happens when a caller talks over the agent. Your traces should record it as an event, not log it as a failure.
Telephony sits outside your code. A call crosses a carrier, a SIP provider and a media bridge before it reaches your agent. Twilio's call summary reports separate edges, and the edges present depend on the call type. Its docs also say a partial summary is available within ten minutes of the call ending, and a complete one can take up to half an hour. Plan for provider data that arrives late.
Findings you can derive from traces and call data
Once turn timing, tool spans and end reasons are on the record, several failure categories show up without listening to any audio. They are found from traces and call data:
- long response time and long agent turns
- unanswered callers and dead air
- the agent interrupting the caller
- the agent being slow to stop when interrupted
- repeated tool calls and failed steps
- the agent repeating itself
- template variables or URLs read out loud
Each category points at a fix in your own stack. A repeated tool call suggests a retry bug. A slow stop after a barge-in suggests your interruption handling needs a look. The point is that these are findings with evidence attached, not guesses. The broader catalog of production failures is in why voice agents fail in production.
Where Evalgent fits
Evalgent is a testing, evaluation and monitoring platform for voice agents. Its Observe product, which is launching, is built around the idea in this post. A trace explains why a call failed by pointing to the step or handoff that caused it. Failures are clustered into root causes, so a team fixes causes instead of single calls.
Observe is stack-agnostic. It ingests data in OpenTelemetry format, and there is a path to upload call details. Native connectors for ElevenLabs, Vapi and Retell are planned. Until then, those stacks connect through the OpenTelemetry and upload paths. Evalgent never sits in the media path, so nothing touches live audio or slows a call.
Where the supplied data cannot support a verdict, the finding is marked undetermined, and coverage gaps are shown instead of hidden. Evalgent's production call monitoring, which is live, flags problems such as tool-call failures and latency spikes with fix recommendations.
Voice agent observability tools you may meet
You do not need a vendor to start. Structured logs, OpenTelemetry spans and a time-series store cover a lot. If you want a trace viewer, general LLM-tracing tools exist. Langfuse is one example. Its data model defines a trace as a single request or operation, made of observations such as LLM calls and tool calls. It can receive OpenTelemetry traces over HTTP, and LiveKit's docs say agent spans can be exported to any compatible backend, such as Langfuse.
Check one thing in any tool. Is the unit of work a turn inside a call, or a single model request? Tools built around the model call may not show overlap, interruptions or telephony data without extra work. The 14-point checklist turns that into a scored buyer's list.
How to make a voice agent observable: a per-call capture checklist
This is what to capture on every voice agent call. It is the minimum record that makes a call explainable. It is not a maturity ladder. Each item is either on the call or it is not.
1. Mint one call ID — Create it at call start. Attach it to every log line, span, provider record and recording reference. Store the telephony provider's call ID next to it.
2. Open one trace per call — Make each turn a span. Add child spans for transcription, the model, each tool call and speech output.
3. Stamp the version — Record the prompt version, model, voice and release on the call. Without this you cannot ask whether a change caused a drop.
4. Record turn timing as events — Capture when the caller started and stopped speaking, when the agent started and stopped, and whether the turn was interrupted.
5. Capture every tool call — Log the tool name, a safe summary of the arguments, the status, the duration and the retry count. Link the result to the next agent turn.
6. Save how the call ended — Store the end reason, which side disconnected and the final outcome. Include the telephony provider's final status.
7. Store a recording reference with an offset — Save where the audio lives and the offset that maps trace time to audio time. Keep the transcript as a derived field.
8. Mask personal data before you persist it — Redact at ingest, and log who accesses raw data. See what to log on every call for field-level detail.
9. Derive metrics from the same data — Compute rates and percentiles per version and per tenant from the stored calls. That keeps every number traceable back to calls.
10. Keep the failures — Sample routine calls if you must. Never sample away calls that errored, ended early or had a slow turn.
For the OpenTelemetry mechanics behind items 1 to 5, see OpenTelemetry observability for voice agents.
Common mistakes
- Metrics only. You can alert, but you cannot explain.
- Transcripts only. The transcript is derived data. It omits timing, tool status and telephony facts.
- No shared ID. The trace, the provider record and the recording cannot be joined, so each investigation starts with detective work.
- Averages. A mean response time hides the long tail callers notice. Use percentiles.
- Logging the happy path. A tool that returns success with an empty result needs a status check in the trace, not an assumption.
Frequently asked questions
What is voice agent observability?
Voice agent observability is the ability to explain why a specific call behaved as it did, using traces, logs, metrics, call details and recordings joined by one call ID. It lets you ask new questions of past calls without shipping new code. It also lets you group similar failures into root causes.
What is the difference between monitoring and observability for voice agents?
Monitoring checks known indicators, such as p95 response time or task success, and alerts when one leaves its bounds. Observability explains why a specific call behaved as it did, including questions you did not plan for. Monitoring tells you something is wrong. Observability gives you the evidence to find the cause.
What are the traces, logs and metrics of a voice agent?
A trace follows one call through its turns and steps as spans. Logs are timestamped records that carry the call ID. Metrics are aggregates, such as response-time percentiles per prompt version. Together with call details and recordings, they let you move from an alert to a single call and then to a cause.
Does OpenTelemetry work for voice agents?
Yes, as a transport and data model. Spans, attributes, logs and metrics all apply to calls. Frameworks such as Pipecat document OpenTelemetry tracing with turn, STT, LLM and TTS spans. The GenAI conventions describe model calls, so expect to add your own turn and telephony attributes.
Why is voice AI observability harder than LLM observability?
A call has overlapping turns, interruptions and several network legs. Latency is a chain of steps, not one model request. Provider telephony data can arrive after the call ends. A tool built only around the model call can miss these, so check that the unit of work is the turn inside a call.
What should I capture on every voice agent call?
Capture a call ID, one trace with a span per turn and step, version stamps, turn timing events, tool call status, the end reason, a recording reference with an offset, and masked personal data. Keep failed and early-ended calls instead of sampling them away. The checklist section above lists all ten items.
Do I need an observability vendor?
Not to start. Structured logs, OpenTelemetry spans and a metrics store give you the core. A vendor helps when you want trace viewing, failure grouping and review workflows without building them. Evaluate any tool by whether it treats the turn inside a call as its unit, and whether it exports your data.
How does observability help find root causes?
A trace points at the step that caused a failure, such as a slow tool call or a skipped retry. Once you can name the step, you can group other calls with the same signature. Fixing that cause, rather than single calls, is voice agent root cause analysis.
The bottom line
Voice agent observability is the ability to explain why one call went the way it did, then group calls that failed the same way. It needs traces, logs, metrics, call details and recordings joined by a single call ID, captured on every call.
Related Articles

How to automate voice agent testing: synthetic callers vs manual QA
Learn how ai test automation replaces manual QA for voice agents. Compare synthetic callers vs human testers, with a 5-step framework to scale without hiring.
Read more
AI Agent Testing vs Voice Agent Testing: What General Tools Miss for Voice
AI agent testing measures text outputs. Voice agent testing measures behaviour through an acoustic pipeline. Five failure categories general tools miss.
Read more