Why Your APM Dashboard Says Green While Callers Hang Up
On this page
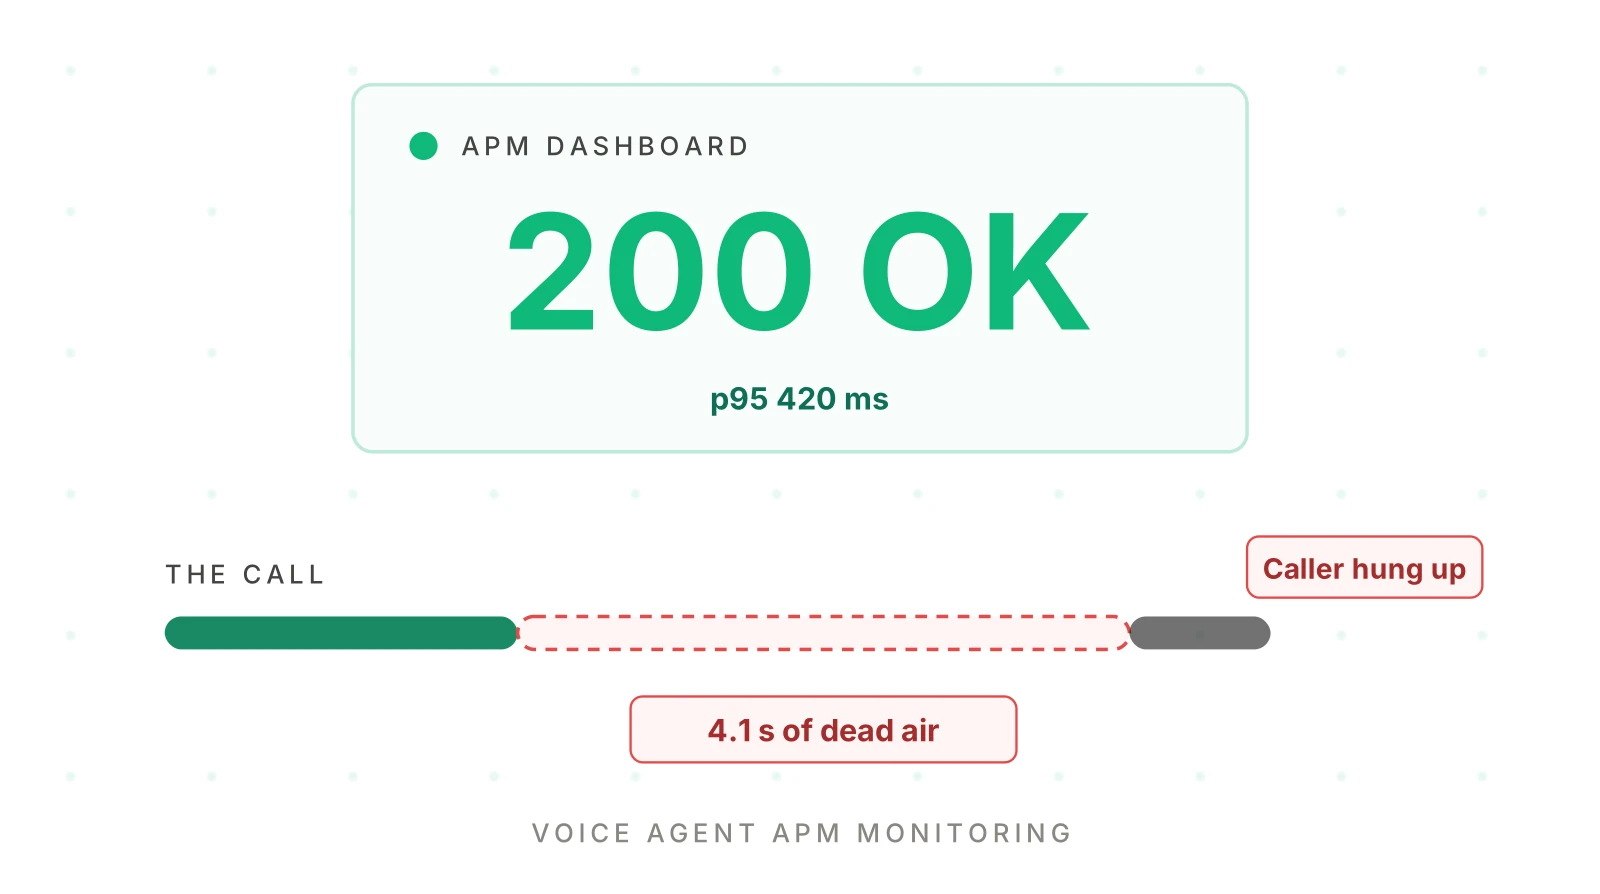
Your dashboard is green. Error rate is flat. The p95 for every service sits inside its target. Yet support tickets say the agent "just went quiet," and the hang-up rate keeps creeping up.
Nothing is broken in the way your tools measure broken. That is the point of this post. Application performance monitoring was built to answer whether a service is healthy. A caller asks a different question: did the agent help me, and did it do so at the pace of a conversation?
This post covers voice agent APM monitoring: what the panels in tools like Datadog, Grafana and Sentry measure, where they stop, and which trace and call-data signals fill the gap. Every signal here is found from traces and call data. None of it needs anyone to listen to audio.
Four neighbours cover adjacent ground, so this post links to them instead of repeating them. The 14-point buyer's checklist grades tools. The definition hub explains traces, logs and metrics. The testing, monitoring and observability model separates the practices. The production monitoring guide covers alert rules and runbooks. The angle here is narrower: why the green panels mislead, and what to add next to them. For what happens after a failure is found, see root cause analysis for voice agents.
What APM measures, and what it was built to answer
APM tools describe requests moving through services. Datadog's APM trace metrics documentation lists hit counts, error counts, and a latency distribution. Hits and errors can also be broken down by HTTP status. Grafana's Application Observability docs show Rate, Errors and Duration panels on the service overview page. Sentry's Insights documentation describes tracing as measuring throughput and latency. All three are accurate as of November 19, 2026.
The common model is Google's four golden signals. The SRE book chapter on monitoring names latency, traffic, errors and saturation. Each is a property of a service.
Notice what is missing. None of these panels knows about a conversation. A turn, a caller, a repeated question and an interruption are not units that an HTTP-shaped model has. Your voice agent exposes them only if you send them.
The SRE book itself warns about the gap. It defines errors broadly. A failure can be explicit, such as an HTTP 500. It can be implicit, such as "an HTTP 200 success response, but coupled with the wrong content." It can also be set by policy, such as treating any request over one second as an error. The same chapter notes that only end-to-end system tests can catch wrong content.
Voice agents live in that implicit and policy territory. Most of their failures return HTTP 200.
Four ways a call fails while every panel stays green
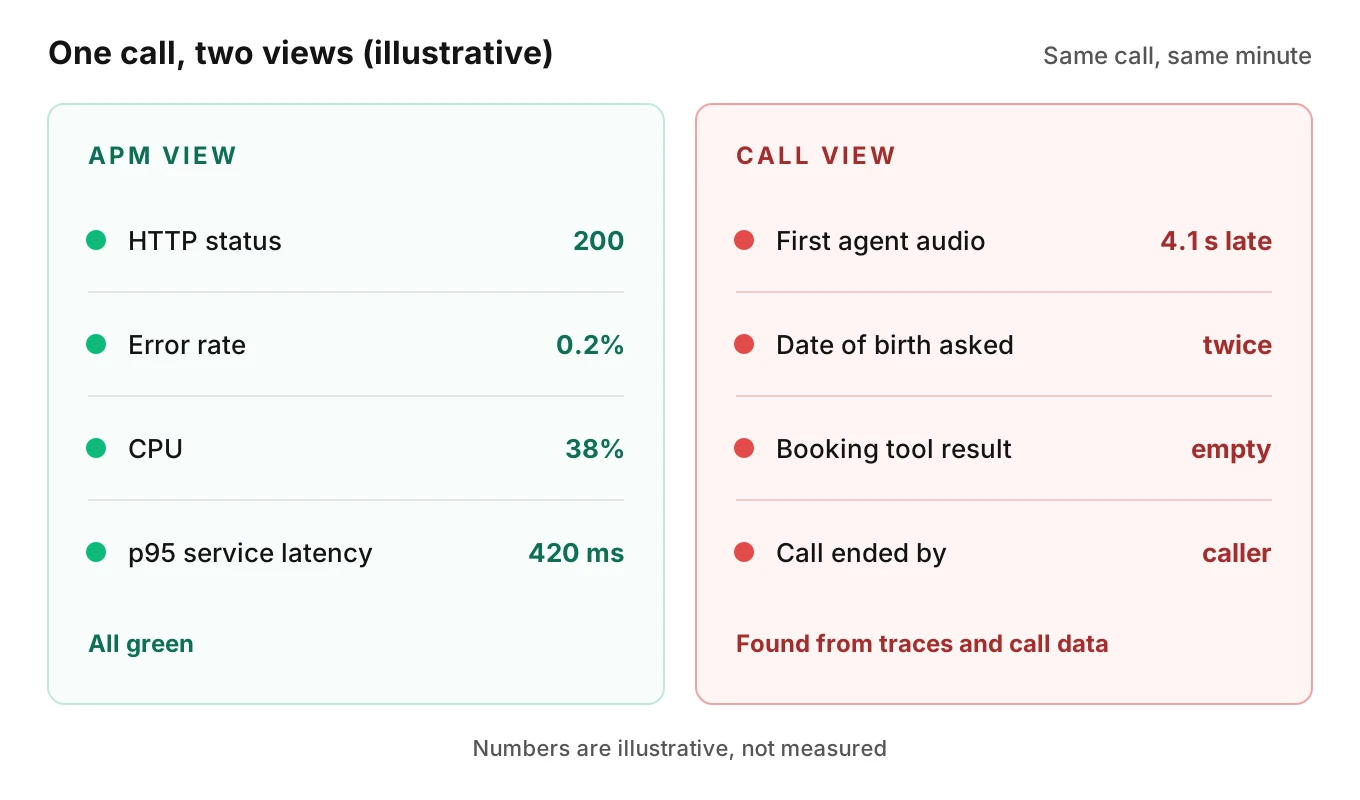
Each of these is a real pattern in production voice agents. None raises an exception. The table shows what the APM view sees and what call-level data shows instead.
| Failure the caller feels | What APM sees | What traces and call data show |
|---|---|---|
| Dead air | Every service request returned 200 inside its p95 | A long gap between the end of the caller's turn and the first agent audio |
| The agent repeats itself, or asks again | Normal traffic, no errors | Consecutive agent turns with near-identical content, or a repeated tool call with the same arguments |
| The agent talks over the caller | Nothing, since overlap is not a request | Agent speech starting before the caller's turn ended, or slow stopping after an interruption |
| A wrong or empty tool result | A successful call to the tool | A tool payload that does not match what the agent then told the caller |
Dead air
Dead air is the most common one. The caller finishes a sentence and hears nothing. Our guide to going silent separates a short processing gap from a true freeze, and silence rate shows how to measure it.
APM misses it because the delay is spread across steps. Endpointing waits. The speech service returns a final transcript. The model thinks. A tool runs. Speech synthesis starts. Each service reports its own p95 and each is fine. The caller experiences the sum.
Repeated questions and loops
An agent asks for a date of birth, gets an answer, and asks again. The cause might be a slot that was never saved, or a transcript the model misread. Either way, every request succeeded. The signal lives in the conversation: two agent turns that match, or the same tool call twice with the same arguments. The repetition loops post covers the causes in depth.
Interrupted callers
Voice is full duplex. A human can start speaking while the agent is mid-sentence. If the agent speaks over the caller, or keeps talking after being cut in on, the caller feels ignored. No HTTP request failed. The signal is in timestamps: agent speech start versus the end of the caller's turn, and how long the agent kept speaking after the caller began. See interruption rate for how to count it.
Wrong tool results
The agent calls a booking tool. The tool returns an empty list. The model says "you're booked for Tuesday." The tool call succeeded and so did the reply. The wrong part is the gap between payload and claim. Our post on silent tool failures goes deeper into that pattern.
Why green is the default: status and latency stop at the service edge
Three mechanics keep voice agent APM monitoring green. Each is documented in the tools you already use.
Span status. OpenTelemetry's traces documentation defines three span statuses: Unset, Error and Ok. It says Unset "means that the operation it tracked successfully completed without an error." A slow tool call that returned an empty result usually ends as Unset. A fluent fallback reply does too. If the code did not raise, the span is quiet.
Call status. Telephony providers report the call, not the conversation. Twilio's Call resource documentation defines completed as "the call was answered and has ended normally," and adds that a completed call means a connection was established and audio data was transferred. A call where the caller gave up after four seconds of silence can still end this way. Treat call status as a plumbing check.
Service latency is not caller wait. A service span starts when the service receives a request. The caller's wait starts when they stop speaking. LiveKit's data hooks documentation defines end-to-end latency as the time from when the user stopped speaking to when the agent began responding. It also lists separate per-turn fields: end-of-turn delay, transcription delay, model time to first token and speech synthesis time to first audio chunk. Those fields exist because the sum is what matters.
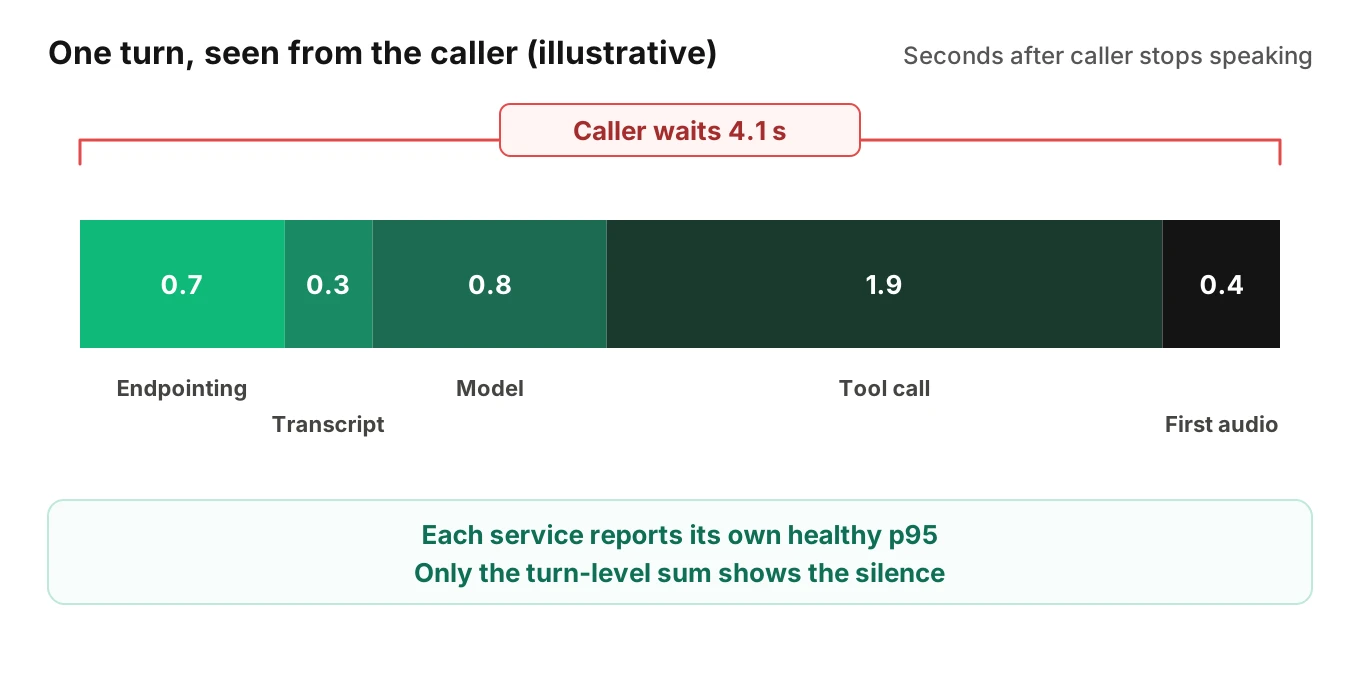
The bar above is illustrative. Every segment is a small, healthy-looking service number. The total is 4.1 seconds of silence on the line. A p95 for the tool alone would not show a problem. The turn-level sum does.
How long is too long?
Human conversation sets the expectation. A cross-language study by Stivers and colleagues, published in PNAS, reports a mean response offset of about +208 ms between speakers across ten languages. The slowest language averaged +469 ms. A voice agent will not match that, and it does not have to. But callers carry the expectation, and multi-second gaps feel long against it.
A word of caution about a number you may see quoted. ITU-T G.114 sets a 150 ms one-way transmission budget for the whole chain, below which most applications are not significantly affected, with 400 ms as the planning limit. That is a network transmission budget. It is not a target for agent response time, and it is not a p95. Do not copy it into a latency alert.
The signals that reveal it, in plain words
Voice agent APM monitoring needs a call-level layer beside the service-level one. These signals come from traces and call data. Where you do not have the data, say so rather than guess.
| Signal | Where it comes from | What it exposes | If the data is missing |
|---|---|---|---|
| Gap from end of caller turn to first agent audio | Turn timestamps in your trace | Dead air, slow turns | Mark the call as undetermined for latency |
| Agent turn count and similarity | Transcript turns in call details | Repeated questions, loops | Cannot separate a loop from a long call |
| Overlap of agent speech and caller turn | Turn-state events or timestamps | Interrupted callers, slow stop | Interruptions go uncounted |
| Tool call arguments and payload | Tool spans with inputs and results | Repeated calls, empty or wrong results | A silent tool failure stays silent |
| Call end reason and who hung up | Call details | Early hang-ups, caller gave up | Cannot tie outcome to cause |
| Release and config stamps | Attributes on every call | Which change introduced it | Failures cannot be grouped by cause |
A few notes on using them.
First, report the gap as a percentile of turns and as a share of calls. A p95 of the gap says how bad the tail is. A share of calls with at least one long gap says how many callers felt it. The monitoring guide shows how to roll per-turn events up into alerts.
Second, treat "undetermined" as a real answer. If a tool span carries no payload, you cannot say the result was wrong. If clocks across hops disagree, you cannot say who spoke first. Showing the coverage gap is better than a confident number that is not backed by data.
Third, join everything by one call ID. A trace without a call ID cannot be linked to the carrier record or the call details. Our call ID correlation post and the end-to-end tracing guide show how.
A worked example, with illustrative numbers
This example is illustrative. It does not describe a real customer or an Evalgent result. The numbers exist to show the gap between two views.
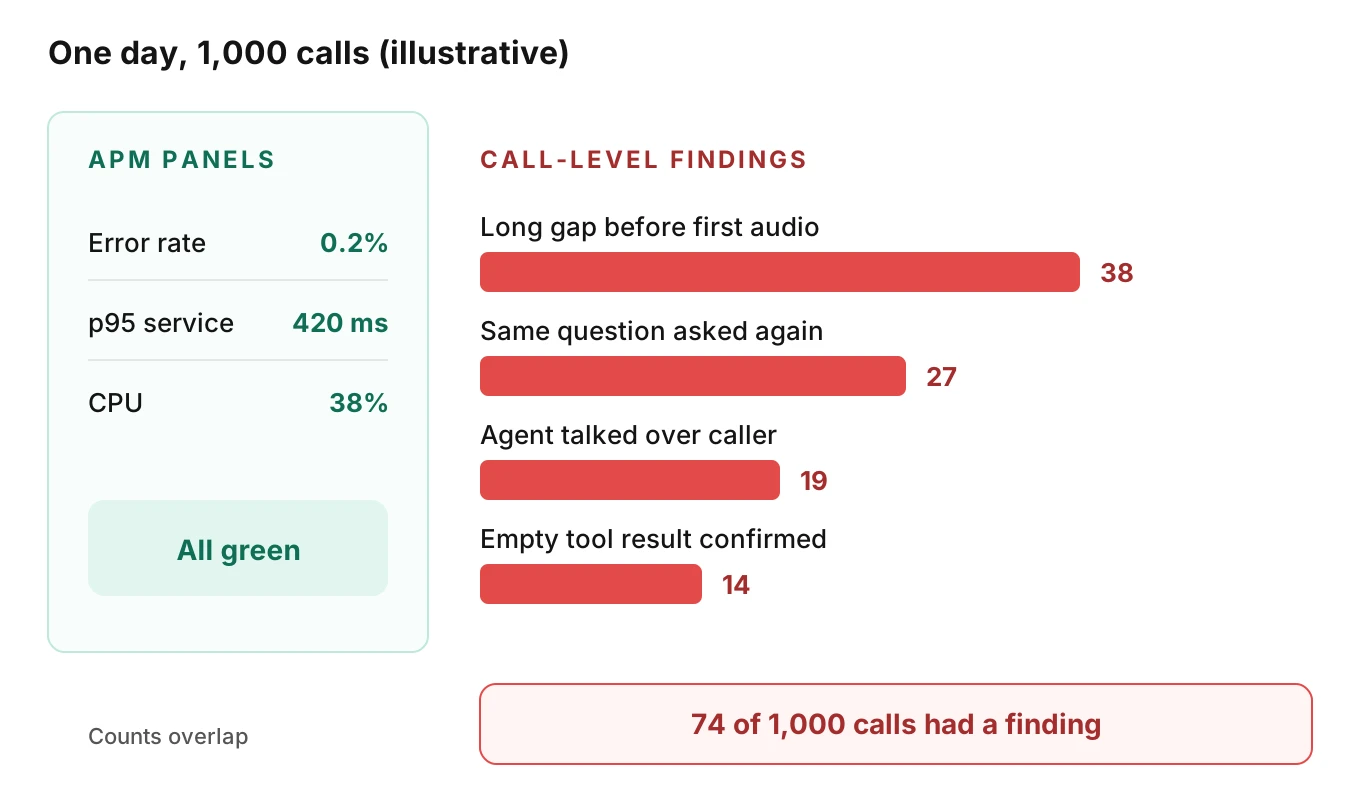
Take one day of 1,000 calls to a scheduling agent. The APM view shows an error rate of 0.2 percent, a p95 service latency of 420 ms and CPU at 38 percent. Everything is green.
Now apply call-level checks. Suppose your own rule is that a gap over three seconds before the first agent audio counts as long. Then group the findings.
| Finding from traces and call data | Calls (illustrative) |
|---|---|
| Long gap before first agent audio | 38 |
| Agent asked the same question again | 27 |
| Agent started speaking over the caller | 19 |
| Tool result empty, agent confirmed anyway | 14 |
| Distinct calls with at least one finding | 74 of 1,000 |
The findings add to 98, but only 74 calls have one, since some calls have more than one. That is 7.4 percent of calls with a problem the dashboard could not see. The dashboard is not wrong. It answers a different question.
Then comes the useful step. Group the 74 calls by shared attributes. If most share one release, one tool or one provider, you have a cause to fix instead of 74 calls to read. That is what failure clustering does, and the root cause analysis post shows the routine.
How to add call-level signals to an APM dashboard
You do not need to replace your APM tool. Datadog's OpenTelemetry documentation says it can combine OpenTelemetry spans with its own spans into a single trace. Other backends take OpenTelemetry data too. The work is deciding what to emit.
1. Define a turn - Pick the start and end of a caller turn and an agent turn, and emit both as timestamps on one span per turn. Everything else builds on this.
2. Attach a call ID everywhere - Put the same call ID on traces, logs, tool spans and the telephony record. Without it you cannot join views.
3. Record the caller-facing gap - Compute end-of-caller-turn to first-agent-audio per turn, and chart its percentiles next to your service p95.
4. Capture tool inputs and results - Store the arguments and the payload on each tool span, with personal data masked. A status code alone says nothing about correctness.
5. Count repeats and overlaps - Flag repeated agent turns, repeated tool calls with identical arguments, and agent speech that overlaps the caller's turn.
6. Stamp releases and config - Add prompt version, model, tool timeouts and provider to every call, so findings group by cause.
7. Chart share of calls, not only rates per request - Put "calls with at least one finding" beside error rate, and alert on it with the practices in voice agent alerting.
8. Mark blind spots - Where a hop emits no data, record it as undetermined instead of leaving a silent hole.
Set targets with your own users in mind. The voice agent SLO guide shows how to express them.
Where Evalgent fits
Evalgent is a testing, evaluation and monitoring platform for voice agents. Three parts are relevant here.
Observe is launching. It works from your traces and call data: traces explain why a call failed, and failures are clustered into root causes so a team fixes causes instead of single calls. It is stack-agnostic and ingests OpenTelemetry data, so it can sit beside the APM tool you already run. It is never in the media path, so nothing touches live audio or slows a call. Where the data is blind, it says undetermined.
Monitor is live. For voice agent monitoring in production, it flags problems in production calls, such as tool-call failures, latency spikes and policy failures, with fix recommendations.
On the testing side, Evalgent can measure uptime and latency percentiles, and its Reviews show a test call with audio and transcript together and the exact tool payloads. That helps you check a fix before a release reaches callers. If you want to see how the three fit your stack, you can book a demo.
Common mistakes
- Alerting on service p95 and calling it voice agent latency monitoring. The caller waits for the sum of the turn, not for one service.
- Treating "call completed" as success. Telephony status says a connection existed, as Twilio's definition above shows.
- Counting only exceptions. Silent failures return 200. The SRE book's implicit and policy errors are the voice agent norm.
- Copying the 150 ms figure into an alert. G.114 is a transmission budget, not an agent response target.
- Sampling calls. A failure you sampled away cannot be explained later. Our post on scoring every call explains why.
- Hiding gaps. A missing hop that shows as zero looks like health. Mark it undetermined.
Frequently asked questions
Why does my APM dashboard say green when callers hang up?
APM tracks service health: HTTP status, error rate, CPU and service latency. A call can fail through dead air, repeated questions, interruptions or wrong tool results while every request returns 200 in time. Those failures are properties of the conversation, so you only see them when you record turns, tool payloads and call outcomes.
What is voice agent APM monitoring?
Voice agent APM monitoring means using application performance monitoring tools, such as Datadog, Grafana or Sentry, on the services behind a voice agent. It shows whether services are up, fast and error free. It does not show whether a conversation went well, so it needs call-level signals beside it.
Can Datadog, Grafana or Sentry monitor a voice agent?
They can monitor the services behind one. Datadog documents trace metrics for hits, errors and latency distribution, and Grafana shows Rate, Errors and Duration panels. For conversation quality you must send turn timestamps, tool payloads and call details as spans or attributes, then chart them yourself.
How do I detect dead air from traces?
Record the end of each caller turn and the first agent audio, then compute the gap per turn. Chart its percentiles and the share of calls with a long gap. If either timestamp is missing, mark that turn undetermined instead of guessing. The silence rate post covers thresholds.
Is p95 latency enough for a voice agent?
No. A p95 describes one service. The caller waits for endpointing, transcript, model, tools and speech synthesis added together. Each can look healthy while the total is several seconds. Track the caller-facing gap per turn, and report both a percentile and the share of calls affected.
How do I find repeated questions and interruptions without listening to calls?
Use traces and call data. Repeated questions show as near-identical consecutive agent turns or identical tool calls. Interruptions show as agent speech starting before the caller's turn ended, or continuing after the caller began. Both come from turn timestamps and transcripts you already store, not from audio analysis.
Does a successful tool call mean the agent was right?
No. A tool can return 200 with an empty or wrong payload, and the span can still end as Unset. The agent may then confirm something false. Store tool arguments and results, then compare the payload with what the agent told the caller.
Should I replace my APM tool with something voice specific?
No. Keep voice agent APM monitoring for service health, since it still catches outages and saturation. Add a call-level layer for turns, tool payloads and outcomes. OpenTelemetry data can feed both, so you can add the second view without rebuilding the first. The observability checklist helps you judge gaps.
The bottom line
A green APM dashboard tells you the services are healthy, not that the caller was helped. Add turn timestamps, tool payloads and call outcomes beside it, and treat anything you cannot see as undetermined.
Related Articles

How to automate voice agent testing: synthetic callers vs manual QA
Learn how ai test automation replaces manual QA for voice agents. Compare synthetic callers vs human testers, with a 5-step framework to scale without hiring.
Read more
AI Agent Testing vs Voice Agent Testing: What General Tools Miss for Voice
AI agent testing measures text outputs. Voice agent testing measures behaviour through an acoustic pipeline. Five failure categories general tools miss.
Read more