Open door for builders.
What to Log on Every Voice Agent Call: The Complete Schema
A caller says the agent "just went silent." You open your logs. You find a transcript and a timestamp. You do not find the model snapshot, the endpointing setting, the tool response, or the moment the TTS stream stalled. The ticket closes as "could not reproduce."
That gap is the whole problem. Most teams log what their platform hands them and nothing more. Then they try to test, evaluate and debug on top of it. It does not work.
This post is the logging standard we wish every team started with. It gives you the field catalog as tables. It includes a JSON record for one call and one turn. It shows Python that emits structured logs and OpenTelemetry spans, plus the real hook names in LiveKit and Pipecat. It ends with ten SQL queries your logs must answer. Every provider field name below was checked against the vendor's own docs in September 2026. Where we simplified, we say so.
Voice agent call log: a structured, joinable record of everything that happened on one call. It covers configuration, timing, recognition, reasoning, tools, speech output, outcome and cost. It is keyed so any turn can be replayed and scored later.
Why call logging comes before testing, evaluation and debugging
You cannot replay what you did not capture. You cannot score a turn you cannot find. You cannot explain a failure without the inputs that caused it.
Testing needs real inputs. The best regression suites are built from production calls. That requires the caller audio, the transcript the agent actually heard, and the config it ran with.
Evaluation needs ground truth and context. A judge that sees only the transcript misses the 2.4 seconds of dead air. It misses the tool that returned an empty body. It misses the barge-in the agent ignored.
Debugging needs a timeline. Voice failures are timing failures more often than logic failures. The words were right, but they arrived late, overlapped the caller, or never played.
We use one test for every logging setup we review.
The five-minute test: pick a random call ID from yesterday. Can one engineer rebuild it in under five minutes? That means what the caller said, what the agent heard, and what it decided. It means which tools ran, what they returned, what the agent said, and how long each step took. If not, your logging is not done.
Most teams fail on three points. They lack version info, so they cannot tie a change to a regression. They lack per-turn timing, so latency is one averaged number. They lack provider request IDs, so vendor tickets stall. For a broader framing, see testing vs monitoring vs observability.
The four layers of a voice agent call log
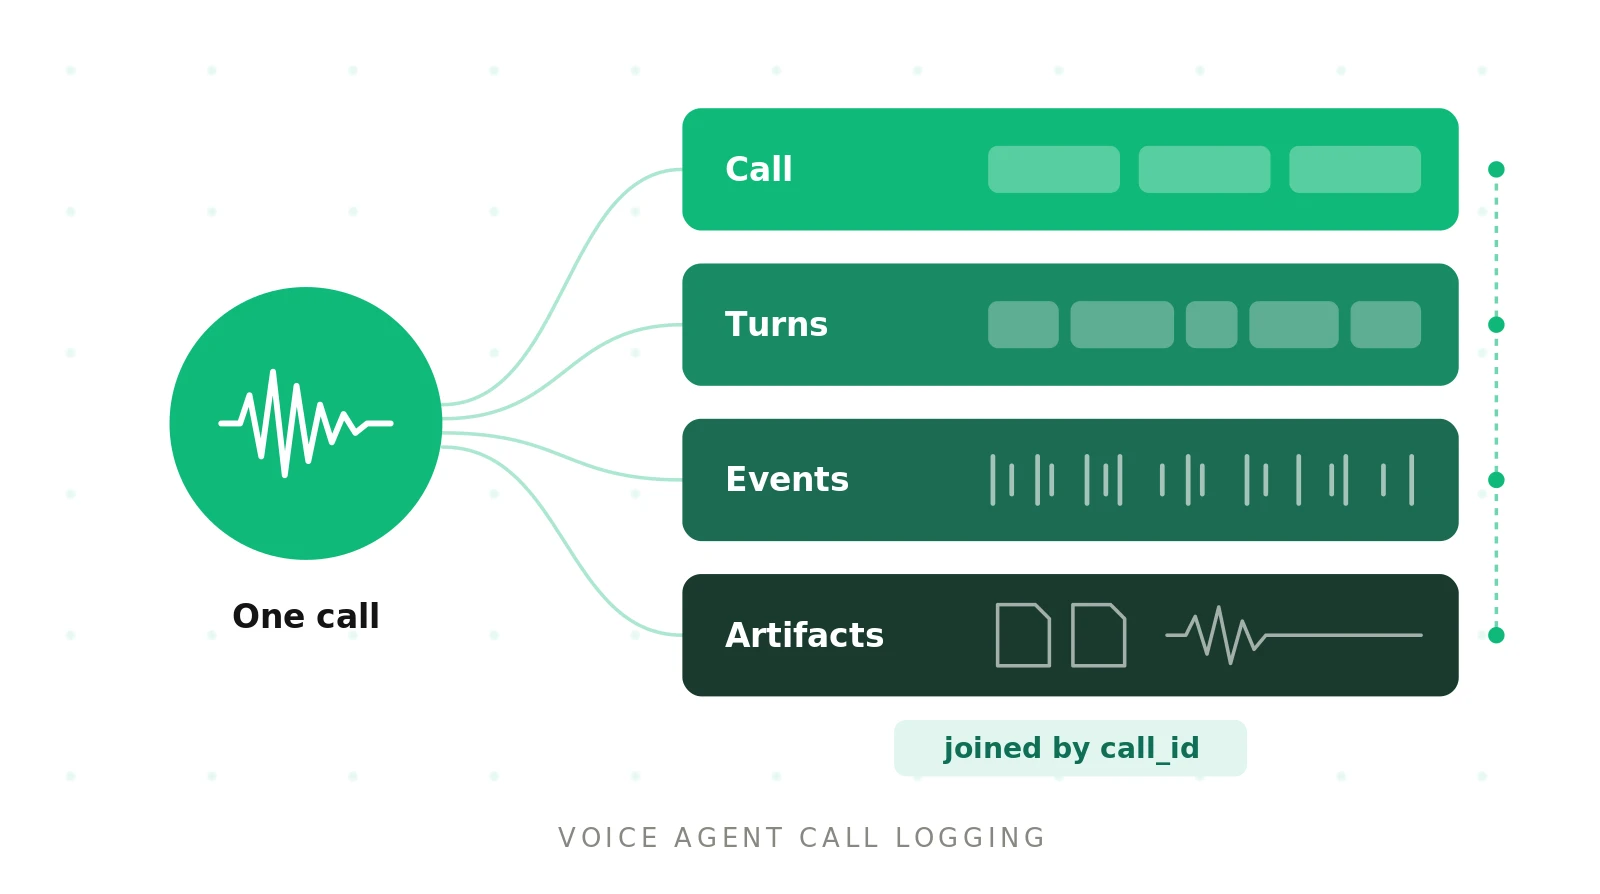
A voice call has natural grain. Log at each grain and join them with stable IDs.
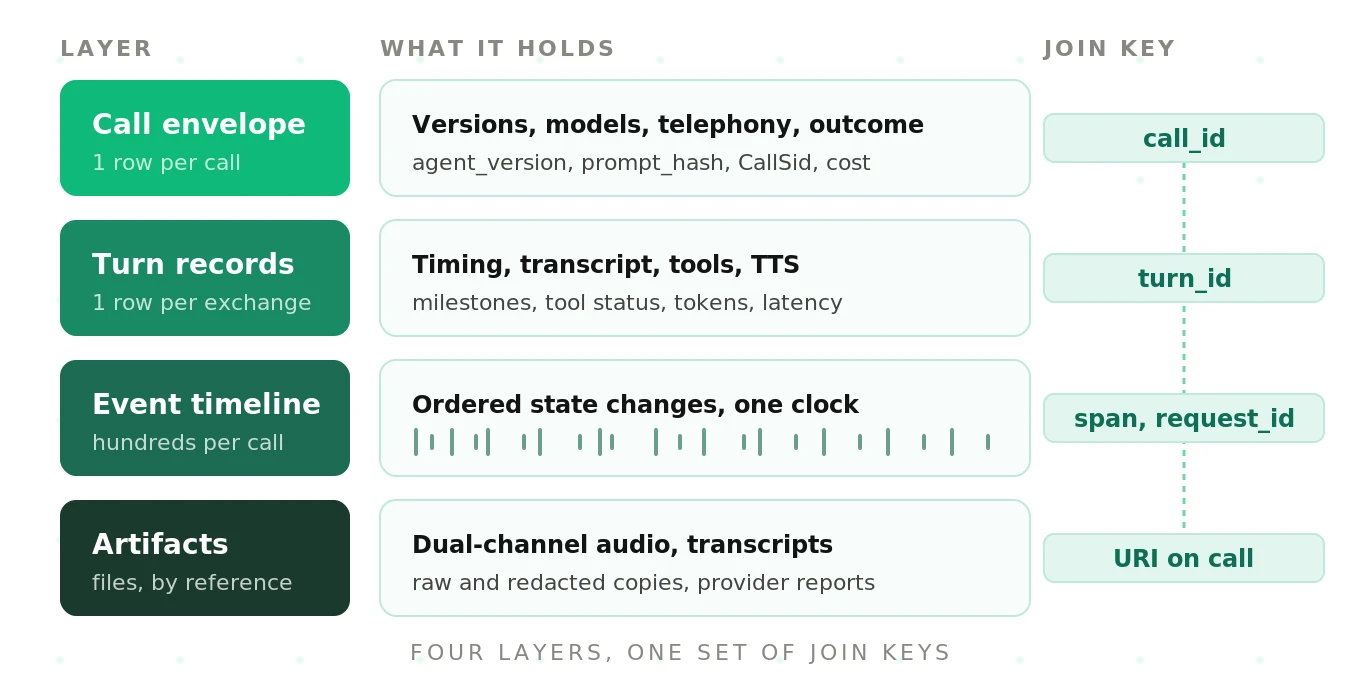
| Layer | Grain | Rows per call | What it answers | Typical store |
|---|---|---|---|---|
| Call (envelope) | One per call | 1 | Who, when, which versions, outcome, cost | Warehouse table |
| Turn | One per user-agent exchange | 5 to 60 | Latency, what was heard, what was said, tools | Warehouse table |
| Event | One per state change | 200 to 5,000 | Exact ordering, gaps, overlaps, retries | Log store or trace backend |
| Artifact | One per file | 2 to 6 | Audio, transcripts, provider reports | Object storage |
Row counts are illustrative for a three-to-ten-minute support call.
Call envelope: the single summary row for a call. It holds identity, versions, telephony facts, outcome and cost totals.
Turn record: one row per exchange. It starts when the user stops speaking and ends when the agent finishes, is interrupted, or yields.
Event timeline: append-only, timestamped events. Examples are VAD start, STT final, LLM first token, tool start, TTS first byte and playback start.
Artifact: a file referenced by URI, never inlined. Examples are dual-channel audio, raw and redacted transcripts, and provider session reports.
The IDs that join everything
Joins break more investigations than missing data does. Generate your own call_id at the first touchpoint. Then attach every provider ID you can get.
| ID | Who creates it | Where you get it | Join to |
|---|---|---|---|
| `call_id` | You | Generate at call start (UUIDv7 sorts by time) | Everything |
| `turn_id` | You | `call_id` plus a turn index | Events, tool calls, eval results |
| `trace_id` / `span_id` | OpenTelemetry SDK | Active span context | Call and turn rows |
| `CallSid` | Twilio | Status callbacks and the Media Streams `start.callSid` | Call envelope |
| `StreamSid` | Twilio | Media Streams `start.streamSid` | Call envelope, audio events |
| `ParentCallSid` | Twilio | Status callback on child legs | Transfer legs |
| `request_id` | Deepgram | `metadata.request_id` on each `Results` message | STT events, vendor tickets |
| `speech_id` | LiveKit Agents | EOU, LLM and TTS metrics events | Your `turn_id` |
| `conversation.id` | Pipecat | Conversation span attribute, or `conversation_id` you pass | Your `call_id` |
| `item_id`, `response_id` | OpenAI Realtime | Server events such as `input_audio_buffer.speech_started` and `response.done` | Turn and event rows |
| `call.id` | Vapi | Call object in every server message | Call envelope |
| `call_id` | Retell | Call object in webhooks and `get-call` | Call envelope |
| `tool_call_id` | LLM provider or platform | Tool call payload | Tool call rows |
Push your call_id into provider metadata wherever possible. Twilio `
The field catalog
This is the core of the standard. Each table lists the field, a type, and why it earns its place. Names are our recommended schema. Provider field names appear in code formatting.
Identity and versioning
Version fields are what make regressions findable. Without them, "latency got worse on Tuesday" has no suspect.
| Field | Type | Example | Why it matters |
|---|---|---|---|
| `call_id` | string | `01J9Z...` | Primary key for every join |
| `agent_id` | string | `billing-agent` | Which agent handled the call |
| `agent_version` | string | `2026.09.24-3` | Deploy-level version, set in CI |
| `prompt_id` / `prompt_version` | string | `billing/v41` | Human-readable prompt version |
| `prompt_hash` | string | `sha256:9f2c...` | Catches edits that skipped a version bump |
| `stt_provider` / `stt_model` / `stt_model_version` | string | `deepgram` / `nova-3` / from `model_info.version` | STT drift and snapshot changes |
| `llm_provider` / `llm_model_requested` / `llm_model_served` | string | `openai` / `gpt-4.1` / served snapshot | Aliases resolve to new snapshots silently |
| `tts_provider` / `tts_model` / `voice_id` | string | `cartesia` / `sonic-2` / `a0e9...` | Voice and prosody regressions |
| `config_hash` | string | `sha256:41ab...` | Hash of endpointing, VAD, interruption and timeout settings |
| `tool_schema_version` | string | `tools/v12` | Argument errors after a schema change |
| `feature_flags` | map | `{"preemptive_generation": true}` | A/B and rollout attribution |
| `experiment_id` / `variant` | string | `exp-77` / `B` | Clean comparisons |
| `deployment_env` / `region` / `host` | string | `prod` / `us-east-1` / pod name | Region-specific latency and outages |
| `framework` / `framework_version` | string | `livekit-agents` / `1.7.x` | Attribute renames and behavior changes |
Log `llm_model_served` separately from what you requested. The OpenTelemetry GenAI conventions make the same split with `gen_ai.request.model` and `gen_ai.response.model`. An alias can move under you. See how LLM updates cause voice agent regressions.
Telephony and audio
| Field | Type | Example | Source |
|---|---|---|---|
| `direction` | enum | `inbound`, `outbound-api`, `outbound-dial` | Twilio `Direction` |
| `from_number_hash` / `to_number_hash` | string | salted hash | Hash, do not store raw by default |
| `carrier` / `trunk_id` | string | carrier name, `TK...` | Your SIP provider, Twilio `trunk_sid` |
| `transport` | enum | `pstn`, `sip`, `webrtc` | Platform config |
| `codec` / `sample_rate_hz` / `channels` | string, int, int | `audio/x-mulaw`, `8000`, `1` | Twilio `start.mediaFormat` |
| `call_status_final` | enum | `completed`, `busy`, `failed`, `no-answer`, `canceled` | Twilio `CallStatus` |
| `sip_response_code` | int | `200`, `404`, `487` | Twilio `SipResponseCode`, terminal events only |
| `answered_by` | enum | `human`, `machine`, `unknown` | Twilio `AnsweredBy` when AMD is on |
| `ring_ms` / `answer_ts` / `end_ts` | int, timestamp | `4200` | Status callback events |
| `recording_ref` | URI | `s3://calls/raw/...` | Your storage, not the vendor URL |
| `recording_channels` | enum | `dual` | Twilio `RecordingChannels` |
| `dtmf_count` | int | `3` | Count only; never log digits in payment flows |
Twilio sends `initiated`, `ringing`, `answered` and `completed` progress events when you request them via `StatusCallbackEvent`. `CallDuration` and `SipResponseCode` only arrive on terminal events. Record dual-channel audio whenever consent allows. Mono audio makes overlap and barge-in analysis much harder.
Timing per turn
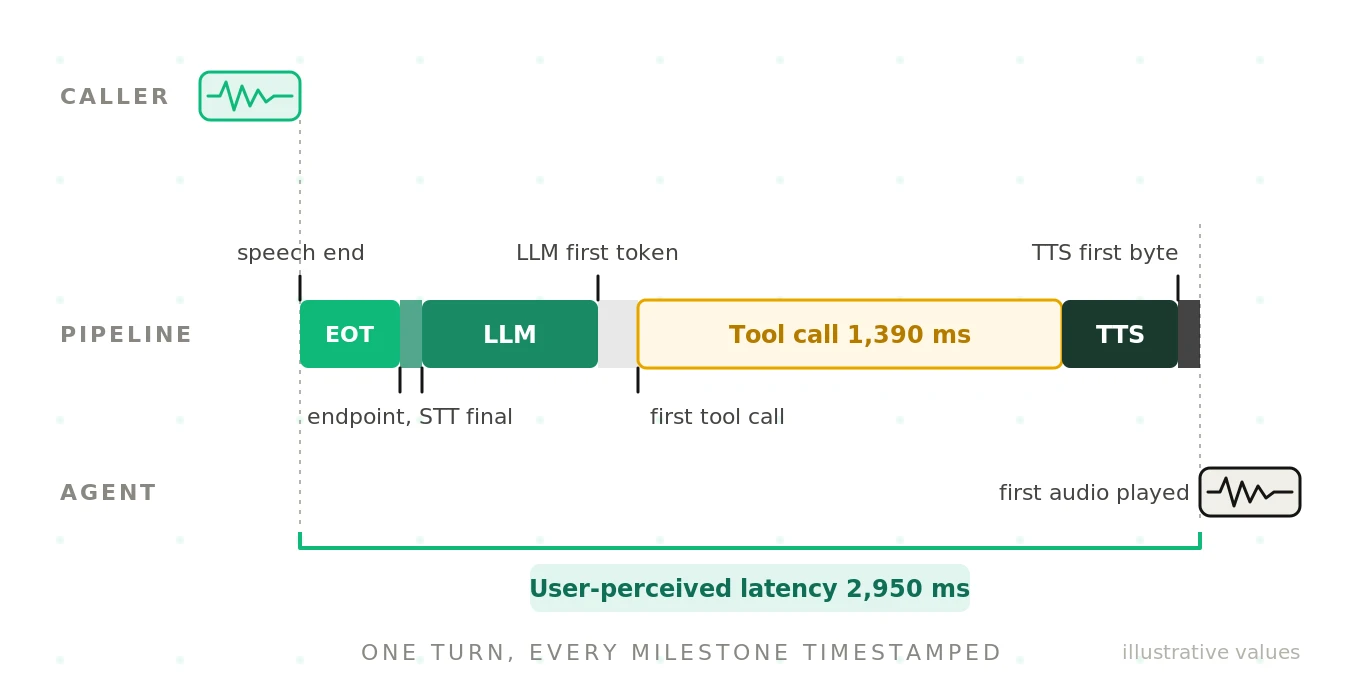
Timing is where voice agents fail most, and where logs are thinnest. Log absolute timestamps for each milestone. Derive durations later.
| Field | Meaning | Where to get it |
|---|---|---|
| `user_speech_start_ms` | VAD detected speech onset | Pipecat VAD frames, OpenAI `input_audio_buffer.speech_started` (`audio_start_ms`), Deepgram `SpeechStarted` |
| `user_speech_end_ms` | VAD detected speech end | LiveKit `stopped_speaking_at`, OpenAI `input_audio_buffer.speech_stopped` (`audio_end_ms`) |
| `endpoint_decision_ms` | Turn declared complete | LiveKit `end_of_turn_delay`, Pipecat `TurnMetricsData` |
| `stt_final_ms` | Final transcript available | LiveKit `transcription_delay`, Deepgram `speech_final: true` |
| `llm_request_ms` | LLM request sent | Your code |
| `llm_first_token_ms` | First token received | LiveKit `llm_node_ttft`, Pipecat `TTFBMetricsData` / `TTFATMetricsData` |
| `first_tool_call_ms` | First tool call emitted | Your tool wrapper |
| `tool_result_ms` | Last tool result returned | Your tool wrapper |
| `tts_request_ms` | First text sent to TTS | Your code |
| `tts_first_byte_ms` | First audio chunk from TTS | LiveKit `tts_node_ttfb`, Pipecat `metrics.ttfb` on the TTS span |
| `first_audio_played_ms` | First agent audio sent to transport | LiveKit `playback_latency`, Twilio `mark` echo |
| `agent_speech_end_ms` | Agent finished or was cut off | Your transport, Twilio `mark` |
| `barge_in_ms` | Caller started speaking over the agent | VAD during agent playback |
Then derive the one number callers feel.
User-perceived latency: the time from the end of the caller's speech to the first agent audio reaching the caller. In logs it is `first_audio_played_ms - user_speech_end_ms`, plus any transport leg you cannot see.
Be careful with vendor "e2e" numbers. LiveKit defines `e2e_latency` as time from the user stopping speaking to the agent beginning to respond. Retell's `latency.e2e` notes it excludes the network trip to the user's frontend. Neither includes the carrier leg on a PSTN call. Log your own milestones so you know what each number covers. Our latency guide breaks the budget down by stage.
Also log leading silence. Pipecat's `TTFAMetricsData` reports `ttfa`, `ttfb` and `leading_silence` separately. A fast TTFB with 300 ms of padded silence still feels slow.
Speech-to-text
| Field | Type | Why |
|---|---|---|
| `stt_request_id` | string | Deepgram `metadata.request_id`; the first thing support will ask for |
| `stt_model_name` / `stt_model_version` | string | Deepgram `model_info.name` and `model_info.version` |
| `transcript_final` | string (redacted copy) | What the agent acted on |
| `transcript_interims` | array | Interim revisions reveal instability and early endpointing |
| `is_final` / `speech_final` / `from_finalize` | bool | Deepgram segment flags; explain split utterances |
| `confidence` | float | Alternative-level confidence |
| `words` | array of word, start, end, confidence | Word timings anchor audio to text |
| `language` / `detected_languages` | string, array | Code-switching and wrong-language failures |
| `keyterms` | array or hash | Deepgram `keyterm` values in effect for this call |
| `endpointing_ms` / `utterance_end_ms` | int | STT-side endpointing config |
| `audio_seconds` | float | Usage for cost; Pipecat `STTUsageMetricsData` |
Deepgram's docs warn not to treat `speech_final: true` alone as the full utterance. Long utterances can produce several `is_final: true` segments first. Log every final segment, not just the last. See Deepgram's endpointing and interim results guide.
Turn-taking
| Field | Type | Why |
|---|---|---|
| `turn_detection_mode` | enum | `vad`, `stt_endpointing`, `semantic_model`, `server_vad` |
| `turn_detection_params` | map | Silence ms, thresholds, eagerness; hash it into `config_hash` too |
| `vad_events` | array | Start and stop pairs with timestamps |
| `interrupted` | bool | Agent speech was cut by the caller |
| `interruption_count` | int | Per turn and per call |
| `false_interruption` | bool | Agent stopped for a cough, "mm-hm" or background noise |
| `backchannel_count` | int | LiveKit `InterruptionMetrics.num_backchannels` when adaptive interruption is on |
| `overlap_ms` | int | Both parties speaking at once |
| `dead_air_ms` | int | Longest silence with nobody speaking inside the turn |
| `agent_truncated_at_ms` | int | Where playback was cut; OpenAI `conversation.item.truncate` carries `audio_end_ms` |
Dead air and false interruptions are the two failures callers remember. Neither shows up in a transcript. Our endpointing guide covers the tuning side.
LLM and tool calls
| Field | Type | Why |
|---|---|---|
| `llm_response_id` | string | OTel `gen_ai.response.id`; provider support needs it |
| `input_messages_ref` | URI or hash | Full context is large and sensitive; store by reference |
| `input_tokens` / `output_tokens` / `cached_input_tokens` | int | OTel `gen_ai.usage.input_tokens`, `gen_ai.usage.output_tokens`, `gen_ai.usage.cache_read.input_tokens` |
| `finish_reason` | string | `stop`, `length`, `tool_calls`; `length` mid-sentence is a bug |
| `llm_ttft_ms` / `llm_duration_ms` | int | Split thinking time from generation |
| `llm_retries` / `llm_fallback_used` | int, bool | Fallbacks hide provider incidents |
| `tool_calls[].tool_call_id` | string | Join tool rows to turns |
| `tool_calls[].name` / `schema_version` | string | Failure rate by tool and version |
| `tool_calls[].args_redacted` | JSON | Argument errors and hallucinated values |
| `tool_calls[].result_status` | enum | `ok`, `error`, `timeout`, `empty`, `invalid` |
| `tool_calls[].http_status` / `error_type` | int, string | Separate 4xx from 5xx from timeouts |
| `tool_calls[].latency_ms` | int | The usual hidden latency spike |
| `tool_calls[].result_hash` / `result_ref` | string | Compare what the tool said to what the agent claimed |
| `agent_claimed_outcome` | string | "Booked", "refunded"; checked against the tool result |
Note the cached-token trap. The GenAI conventions say `gen_ai.usage.input_tokens` should already include cache reads. LiveKit's tracing docs make the same point. Adding the two double-counts.
The last row matters most. A tool can fail while the agent says "you're all set." That is a silent tool failure. You only catch it if you log the tool result next to the agent's claim.
Text-to-speech
| Field | Type | Why |
|---|---|---|
| `tts_request_id` | string | Provider support |
| `tts_characters` | int | Cost; LiveKit `characters_count`, Pipecat `metrics.character_count` |
| `tts_audio_seconds` | float | LiveKit `audio_duration` |
| `tts_ttfb_ms` / `tts_leading_silence_ms` | int | Perceived latency |
| `tts_text_redacted` | string | What the agent tried to say |
| `tts_error` / `tts_retries` | string, int | Stalls and reconnects |
| `pronunciation_overrides` | array | Lexicon entries used |
Outcome
| Field | Type | Why |
|---|---|---|
| `end_reason` | enum | Normalized: `caller_hangup`, `agent_hangup`, `transfer`, `error`, `timeout`, `voicemail` |
| `end_reason_raw` | string | Vapi `endedReason`, Retell `disconnection_reason`, Twilio `CallStatus` |
| `who_hung_up` | enum | `caller`, `agent`, `system` |
| `transfer_target` / `transfer_result` | string, enum | Retell `transfer_destination`, `transfer_bridged` or `transfer_cancelled` events |
| `disposition` | string | Business result code |
| `task_success_signal` | enum | `confirmed_by_system`, `claimed_only`, `failed`, `unknown` |
| `escalation_requested` | bool | Caller asked for a human |
| `compliance_flags` | array | Disclosures read, consent captured, opt-out honored |
| `last_speaker` / `trailing_silence_ms` | enum, int | Who spoke last and how long silence lasted before hangup; finds dead-air endings |
Keep the raw vendor reason next to your normalized one. Vendor enums change, and Retell alone documents more than 30 disconnection reasons.
Cost per component
| Field | Unit | Source |
|---|---|---|
| `cost_telephony` | USD | Twilio `price` (connectivity only, posted after the call) |
| `cost_stt` | USD | audio seconds x rate, or Deepgram request `usd` |
| `cost_llm` | USD | tokens x rate by model |
| `cost_tts` | USD | characters or audio seconds x rate |
| `cost_platform` | USD | Vapi `costBreakdown` (`transport`, `stt`, `llm`, `tts`, `vapi`, `total`), Retell `call_cost.product_costs` |
| `cost_total` | USD | Sum, with `pricing_version` |
Store a `pricing_version` with each row. Rates change, and last quarter's cost per call must not silently recompute. This feeds cost per resolution.
Errors and warnings
Log every error as a structured event with `call_id`, `turn_id`, `component`, `error_type`, `provider_code`, `retryable` and `recovered`. Log warnings too: websocket reconnects, STT keepalive gaps, rate-limit headroom, fallback activations. OpenAI's Realtime API sends `rate_limits.updated` events, and its `error` event docs recommend logging error messages by default.
Quality scores added later
Evaluation writes back to the same keys. Keep scores in their own table so re-scoring never mutates the call record.
| Field | Type | Why |
|---|---|---|
| `call_id` / `turn_id` | string | Join key |
| `evaluator` / `evaluator_version` | string | Rubric or model version that produced the score |
| `metric` | string | `task_success`, `hallucination`, `interruption_handling`, `compliance` |
| `score` / `label` / `explanation` | float, string, string | Result and rationale |
| `scored_at` | timestamp | Re-scores are new rows, not updates |
The GenAI conventions now include evaluation attributes such as `gen_ai.evaluation.name` and `gen_ai.evaluation.score.value`. They are in development status, so treat them as a naming guide rather than a stable contract.
Where each stack exposes these fields
You rarely need to invent these fields. Most stacks emit them. You need to collect them in one place with your IDs attached.
| Stack | What it emits | Hook or surface |
|---|---|---|
| LiveKit Agents | Per-turn `ChatMessage.metrics`: `transcription_delay`, `end_of_turn_delay`, `on_user_turn_completed_delay`, `llm_node_ttft`, `tts_node_ttfb`, `playback_latency`, `e2e_latency`, `started_speaking_at`, `stopped_speaking_at` | `conversation_item_added` event; `session_usage_updated`; `ctx.make_session_report()` in `on_session_end`; per-plugin `metrics_collected` with `speech_id` |
| LiveKit tracing | OTel spans with `lk.` and `gen_ai.` attributes; content under `lk.pii.*` since Agents 1.7.0 | `set_tracer_provider(provider, metadata=..., allow_pii=False)` |
| Pipecat | `MetricsFrame` with `TTFBMetricsData`, `TTFAMetricsData`, `TTFATMetricsData`, `ProcessingMetricsData`, `LLMUsageMetricsData`, `STTUsageMetricsData`, `TTSUsageMetricsData`, `TurnMetricsData` | `enable_metrics` and `enable_usage_metrics` in `PipelineParams`; observers such as `UserBotLatencyObserver`, `TurnTrackingObserver`, `ServiceMetricsObserver` |
| Pipecat tracing | Conversation, turn, stt, llm, tts spans; `turn.was_interrupted`, `metrics.ttfb`, `gen_ai.usage.*` | `setup_tracing(...)` plus `enable_tracing=True`, `enable_turn_tracking=True`, `conversation_id` |
| Deepgram streaming | `Results` with `is_final`, `speech_final`, `from_finalize`, `confidence`, `words`, `metadata.request_id`, `metadata.model_info`; `Metadata`, `SpeechStarted`, `UtteranceEnd` messages | WebSocket messages; `tag` and `extra` params; Manage API `GET /v1/projects/{project_id}/requests` |
| OpenAI Realtime API | `session.created`, `input_audio_buffer.speech_started` / `speech_stopped`, `conversation.item.input_audio_transcription.completed` / `failed`, `response.done` with `status`, `status_details`, `usage`, `rate_limits.updated`, `error` | Server events over WebSocket or WebRTC |
| Twilio | `CallSid`, `StreamSid`, `CallStatus`, `CallDuration`, `SipResponseCode`, `AnsweredBy`, `RecordingSid`; media `start`, `media`, `dtmf`, `mark`, `stop` | Status callbacks; Media Streams WebSocket messages |
| Vapi | `end-of-call-report` with `endedReason` and `artifact` (recording, transcript, messages); `status-update`, `speech-update`, `user-interrupted` with `turnId`, `model-output`, `hang`; call `costBreakdown` and `artifact.performanceMetrics` | Server URL messages; call object |
| Retell | `call_started`, `call_ended`, `call_analyzed`, `transcript_updated`, transfer events; call object with `agent_version`, `latency` (`e2e`, `asr`, `llm`, `tts`) percentiles, `call_cost`, `disconnection_reason`, `transcript_with_tool_calls`, `telephony_identifier.twilio_call_sid` | Webhooks; `GET /v2/get-call/{call_id}` |
| OpenTelemetry GenAI | `gen_ai.operation.name`, `gen_ai.provider.name`, `gen_ai.request.model`, `gen_ai.response.model`, `gen_ai.response.id`, `gen_ai.response.finish_reasons`, `gen_ai.usage.*`, `gen_ai.tool.name`, `gen_ai.tool.call.id` | Semantic conventions, now maintained in a separate GenAI repository |
Sources: LiveKit data hooks, LiveKit OpenTelemetry traces, Pipecat metrics, Pipecat OpenTelemetry, Deepgram live audio reference, OpenAI Realtime conversations, Twilio Media Streams messages, Twilio Call resource, Vapi server events, Retell get-call, and the OpenTelemetry GenAI attribute registry. The GenAI conventions moved to the semantic-conventions-genai repository in 2026.
Two cautions. First, LiveKit notes that `llm_node_ttft` and `tts_node_ttfb` stay empty with a realtime model. Speech-to-speech stacks need different timing fields. Second, LiveKit Agents 1.7.0 renamed 12 span attributes to an `lk.pii.` prefix. Old dashboard queries return nothing and raise no error. Pin `framework_version` in your call envelope for exactly this reason. Running GPT-Live or another speech-to-speech model? Check its own event reference. The names above are verified for the Realtime API only.
Comparing frameworks? See LiveKit vs Pipecat latency and how to benchmark LiveKit vs Pipecat.
These are documented platform limits, and each one shapes your logging. Retell retries mean duplicate webhooks, so dedupe on `event` plus `call_id`. The 8 kHz narrowband audio caps what STT can do on phone calls. LiveKit's timeout bounds how much work fits in `on_session_end`. The Vapi window means you must never block on logging during call setup.
Example records: one call, one turn, one timeline
All values below are illustrative. Field names in our schema are recommendations. Provider-sourced fields keep the provider's names in comments.
Call envelope
{
  "call_id": "01J9ZK6T4Q8V3M2R7N5B1C0D9E",
  "started_at": "2026-09-24T15:02:11.482Z",
  "ended_at": "2026-09-24T15:06:47.903Z",
  "agent": {
    "agent_id": "billing-agent",
    "agent_version": "2026.09.24-3",
    "prompt_version": "billing/v41",
    "prompt_hash": "sha256:9f2c1e...",
    "config_hash": "sha256:41ab77...",
    "tool_schema_version": "tools/v12",
    "feature_flags": {"preemptive_generation": true},
    "framework": "livekit-agents",
    "framework_version": "1.7.2"
  },
  "models": {
    "stt": {"provider": "deepgram", "model": "nova-3", "version": "2026-08-12.1"},
    "llm": {"provider": "openai", "requested": "gpt-4.1", "served": "gpt-4.1-2025-04-14"},
    "tts": {"provider": "cartesia", "model": "sonic-2", "voice_id": "a0e99841"}
  },
  "telephony": {
    "direction": "inbound",
    "twilio_call_sid": "CA5d0d0d8047bf685c3f0ff980fe62c123",
    "twilio_stream_sid": "MZ18ad3ab5a668481ce02b83e7395059f0",
    "codec": "audio/x-mulaw",
    "sample_rate_hz": 8000,
    "sip_response_code": 200,
    "carrier": "carrier-a",
    "region": "us-east-1"
  },
  "outcome": {
    "end_reason": "caller_hangup",
    "end_reason_raw": "completed",
    "transfer_target": null,
    "disposition": "payment_plan_created",
    "task_success_signal": "confirmed_by_system"
  },
  "totals": {
    "turns": 14,
    "interruptions": 2,
    "false_interruptions": 1,
    "max_dead_air_ms": 1840,
    "p95_user_perceived_latency_ms": 1320
  },
  "cost_usd": {"telephony": 0.041, "stt": 0.021, "llm": 0.034, "tts": 0.052, "total": 0.148, "pricing_version": "2026-09"},
  "consent": {"recording": true, "basis": "announced_at_greeting", "jurisdiction": "US-CA"},
  "artifacts": {
    "audio_dual_channel": "s3://voice-raw/2026/09/24/01J9ZK.../call.wav",
    "transcript_redacted": "s3://voice-redacted/2026/09/24/01J9ZK.../transcript.json",
    "provider_report": "s3://voice-raw/2026/09/24/01J9ZK.../session_report.json"
  },
  "trace_id": "4bf92f3577b34da6a3ce929d0e0e4736",
  "sampling": {"kept_reason": "always_keep:tool_error"}
}
Turn record
{
  "call_id": "01J9ZK6T4Q8V3M2R7N5B1C0D9E",
  "turn_id": "01J9ZK6T4Q8V3M2R7N5B1C0D9E:07",
  "turn_index": 7,
  "speech_id": "SP_7f3a...",
  "span_id": "00f067aa0ba902b7",
  "timing_ms": {
    "user_speech_start": 81230,
    "user_speech_end": 84910,
    "endpoint_decision": 85240,
    "stt_final": 85310,
    "llm_request": 85330,
    "llm_first_token": 85890,
    "first_tool_call": 86020,
    "tool_result": 87410,
    "tts_request": 87650,
    "tts_first_byte": 87790,
    "first_audio_played": 87860,
    "agent_speech_end": 91420
  },
  "derived_ms": {"user_perceived_latency": 2950, "tool_latency": 1390, "dead_air": 2950},
  "stt": {
    "request_id": "550e8400-e29b-41d4-a716-446655440000",
    "final_redacted": "yeah can I set up a payment plan for [AMOUNT]",
    "confidence": 0.93,
    "final_segments": 2,
    "interim_count": 6,
    "language": "en-US"
  },
  "llm": {
    "response_id": "resp_8a1f...",
    "input_tokens": 3120,
    "cached_input_tokens": 2816,
    "output_tokens": 64,
    "finish_reason": "tool_calls",
    "retries": 0
  },
  "tool_calls": [
    {
      "tool_call_id": "call_mszuSIzqtI65",
      "name": "create_payment_plan",
      "schema_version": "tools/v12",
      "args_redacted": {"account_id": "[ACCT]", "installments": 3},
      "result_status": "ok",
      "http_status": 200,
      "latency_ms": 1390
    }
  ],
  "tts": {"characters": 118, "ttfb_ms": 140, "leading_silence_ms": 0},
  "turn_taking": {"interrupted": false, "overlap_ms": 0, "false_interruption": false},
  "agent_claimed_outcome": "payment_plan_created"
}
This turn tells a story in one glance. Latency was 2.95 seconds, and 1.39 seconds of it was one tool. Without `tool_calls[].latency_ms`, you would blame the LLM.
Event timeline (compact)
[
  {"t_ms": 84910, "type": "vad.user_stop"},
  {"t_ms": 85240, "type": "turn.endpoint", "detector": "semantic", "delay_ms": 330},
  {"t_ms": 85310, "type": "stt.final", "request_id": "550e8400-...", "speech_final": true},
  {"t_ms": 85330, "type": "llm.request", "model": "gpt-4.1"},
  {"t_ms": 85890, "type": "llm.first_token"},
  {"t_ms": 86020, "type": "tool.start", "tool_call_id": "call_mszuSIzqtI65", "name": "create_payment_plan"},
  {"t_ms": 87410, "type": "tool.end", "status": "ok", "http_status": 200},
  {"t_ms": 87650, "type": "tts.request", "chars": 118},
  {"t_ms": 87790, "type": "tts.first_byte"},
  {"t_ms": 87860, "type": "playback.start", "twilio_mark": "t07-seg1"},
  {"t_ms": 91420, "type": "playback.end", "twilio_mark": "t07-seg1"}
]
`t_ms` is an offset from call start on one monotonic clock. That removes cross-service clock skew from every duration you compute.
Implementation: structured logs and OpenTelemetry spans per turn
The pattern is simple. Build one in-memory turn object. Stamp milestones on a monotonic clock. Emit one structured log line and one span when the turn closes. Never do network I/O on the audio path.
The code below is simplified for readability. It uses the standard OpenTelemetry Python API and the standard library's `QueueHandler`. Adapt names to your schema.
import json, logging, logging.handlers, queue, time, uuid
from dataclasses import dataclass, field, asdict
from opentelemetry import trace
from opentelemetry.trace import Status, StatusCode

# 1) Non-blocking logging: the audio loop only enqueues.
log_queue: queue.Queue = queue.Queue(maxsize=50_000)
root = logging.getLogger("voice")
root.setLevel(logging.INFO)
root.addHandler(logging.handlers.QueueHandler(log_queue))

class JsonFormatter(logging.Formatter):
    def format(self, record):
        return json.dumps(getattr(record, "payload", {"msg": record.getMessage()}))

sink = logging.StreamHandler()          # swap for your shipper (file, OTLP logs, Kafka)
sink.setFormatter(JsonFormatter())
listener = logging.handlers.QueueListener(log_queue, sink)
listener.start()                         # I/O happens on the listener thread

tracer = trace.get_tracer("voice-agent")

@dataclass
class Turn:
    call_id: str
    index: int
    t0_ns: int                           # call start, monotonic
    marks: dict = field(default_factory=dict)
    tool_calls: list = field(default_factory=list)
    attrs: dict = field(default_factory=dict)

    def mark(self, name: str) -> None:
        self.marks[name] = (time.monotonic_ns() - self.t0_ns) // 1_000_000

    @property
    def turn_id(self) -> str:
        return f"{self.call_id}:{self.index:02d}"

class CallLogger:
    def __init__(self, envelope: dict):
        self.call_id = envelope.setdefault("call_id", str(uuid.uuid4()))
        self.t0_ns = time.monotonic_ns()
        self.envelope = envelope
        self.envelope["started_at_unix_ms"] = time.time_ns() // 1_000_000  # one wall-clock anchor

    def new_turn(self, index: int) -> Turn:
        return Turn(self.call_id, index, self.t0_ns)

    def close_turn(self, turn: Turn) -> None:
        m = turn.marks
        upl = m.get("first_audio_played", 0) - m.get("user_speech_end", 0) if "first_audio_played" in m else None
        with tracer.start_as_current_span("voice.turn") as span:
            span.set_attribute("voice.call_id", turn.call_id)
            span.set_attribute("voice.turn_id", turn.turn_id)
            span.set_attribute("voice.agent_version", self.envelope["agent"]["agent_version"])
            span.set_attribute("voice.prompt_hash", self.envelope["agent"]["prompt_hash"])
            if upl is not None:
                span.set_attribute("voice.user_perceived_latency_ms", upl)
            for k in ("gen_ai.request.model", "gen_ai.response.model",
                      "gen_ai.usage.input_tokens", "gen_ai.usage.output_tokens"):
                if k in turn.attrs:
                    span.set_attribute(k, turn.attrs[k])
            failed = [t for t in turn.tool_calls if t["result_status"] != "ok"]
            if failed:
                span.set_status(Status(StatusCode.ERROR, "tool_failure"))
            ctx = span.get_span_context()
            payload = {
                "kind": "turn", "call_id": turn.call_id, "turn_id": turn.turn_id,
                "trace_id": format(ctx.trace_id, "032x"), "span_id": format(ctx.span_id, "016x"),
                "timing_ms": m, "user_perceived_latency_ms": upl,
                "tool_calls": turn.tool_calls, **turn.attrs,
            }
        root.info("turn", extra={"payload": payload})   # enqueue only

async def logged_tool(turn: Turn, name: str, schema_version: str, fn, args_redacted: dict, **kwargs):
    """Wrap every tool so failures and latency are never invisible."""
    start = time.monotonic_ns()
    if "first_tool_call" not in turn.marks:
        turn.mark("first_tool_call")
    rec = {"name": name, "schema_version": schema_version, "args_redacted": args_redacted}
    with tracer.start_as_current_span("execute_tool " + name) as span:
        span.set_attribute("gen_ai.operation.name", "execute_tool")
        span.set_attribute("gen_ai.tool.name", name)
        try:
            result = await fn(**kwargs)
            rec["result_status"] = "empty" if result in (None, {}, []) else "ok"
            return result
        except TimeoutError as e:
            rec.update(result_status="timeout", error_type=type(e).__name__)
            span.record_exception(e); span.set_status(Status(StatusCode.ERROR))
            raise
        except Exception as e:
            rec.update(result_status="error", error_type=type(e).__name__)
            span.record_exception(e); span.set_status(Status(StatusCode.ERROR))
            raise
        finally:
            rec["latency_ms"] = (time.monotonic_ns() - start) // 1_000_000
            turn.tool_calls.append(rec)
            turn.mark("tool_result")
Three details carry most of the value. The tool wrapper classifies `empty` separately from `ok`, which is how silent failures surface. Durations come from one monotonic clock per call. Only the listener thread touches the network.
Hooking the timings in LiveKit Agents
LiveKit already computes per-turn latency. Read it from the chat item and attach your IDs. The event and field names below come from the LiveKit data hooks docs. The mapping into `CallLogger` is ours and simplified.
from livekit.agents import ConversationItemAddedEvent, SessionUsageUpdatedEvent
from livekit.agents.llm import ChatMessage

def wire_livekit(session, call_log: CallLogger):
    @session.on("conversation_item_added")
    def _on_item(ev: ConversationItemAddedEvent):
        if not isinstance(ev.item, ChatMessage):
            return
        m = ev.item.metrics or {}
        root.info("lk_turn_metrics", extra={"payload": {
            "kind": "turn_metrics", "call_id": call_log.call_id, "role": ev.item.role,
            "transcription_delay": m.get("transcription_delay"),
            "end_of_turn_delay": m.get("end_of_turn_delay"),
            "llm_node_ttft": m.get("llm_node_ttft"),
            "tts_node_ttfb": m.get("tts_node_ttfb"),
            "e2e_latency": m.get("e2e_latency"),
            "started_speaking_at": m.get("started_speaking_at"),
            "stopped_speaking_at": m.get("stopped_speaking_at"),
        }})

    @session.on("session_usage_updated")
    def _on_usage(ev: SessionUsageUpdatedEvent):
        for u in ev.usage.model_usage:
            root.info("lk_usage", extra={"payload": {
                "kind": "usage", "call_id": call_log.call_id,
                "provider": u.provider, "model": u.model, "usage": str(u)}})

# At session end, persist the SDK's own report as an artifact:
async def on_session_end(ctx):
    report = ctx.make_session_report().to_dict()
    # upload report to object storage off the hot path; store its URI on the call envelope
For spans, call `set_tracer_provider(provider, metadata={"voice.call_id": call_id}, allow_pii=False)` before the session starts. The `metadata` lands on every span. `allow_pii=False` strips `lk.pii.*` and GenAI content attributes from your exporters. Deeper wiring lives in our OpenTelemetry guide for voice agents.
Hooking the timings in Pipecat
Pipecat exposes metrics as frames and observers. The observer names, event names and handler signatures below come from the Pipecat metrics docs. As of September 2026, the docs use `PipelineWorker`; older releases used `PipelineTask`.
from pipecat.observers.user_bot_latency_observer import UserBotLatencyObserver
from pipecat.observers.turn_tracking_observer import TurnTrackingObserver
from pipecat.observers.service_metrics_observer import ServiceMetricsObserver
from pipecat.pipeline.worker import PipelineWorker, PipelineParams

latency_obs = UserBotLatencyObserver()
turn_obs = TurnTrackingObserver(turn_end_timeout_secs=2.5)
svc_obs = ServiceMetricsObserver()

@latency_obs.event_handler("on_latency_measured")
async def _lat(observer, latency_seconds):
    root.info("pc_latency", extra={"payload": {"kind": "user_bot_latency",
              "call_id": CALL_ID, "ms": int(latency_seconds * 1000)}})

@turn_obs.event_handler("on_turn_ended")
async def _turn(observer, turn_count, duration, was_interrupted):
    root.info("pc_turn", extra={"payload": {"kind": "turn_end", "call_id": CALL_ID,
              "turn_index": turn_count, "duration_s": duration, "interrupted": was_interrupted}})

@svc_obs.event_handler("on_service_latency")
async def _svc(observer, record):
    root.info("pc_svc", extra={"payload": {"kind": "service_latency", "call_id": CALL_ID,
              "metric": record.kind, "seconds": record.seconds, "processor": record.processor}})

worker = PipelineWorker(
    pipeline,
    params=PipelineParams(enable_metrics=True, enable_usage_metrics=True),
    observers=[latency_obs, turn_obs, svc_obs],
    enable_tracing=True,
    enable_turn_tracking=True,
    conversation_id=CALL_ID,                          # your call_id becomes conversation.id
    additional_span_attributes={"voice.agent_version": AGENT_VERSION},
)
Passing your call_id as `conversation_id` is the single most useful line. Every Pipecat span then joins to your warehouse rows without a lookup table.
Joining provider IDs
Capture provider IDs at the moment they appear. Do not reconstruct them later.
1. On the Twilio Media Streams `start` message, read `start.callSid`, `start.streamSid` and `start.customParameters`. Put your call_id in the custom parameters when you build the `
2. On every Deepgram `Results` message, log `metadata.request_id` with the turn. Set `tag` to your agent ID for usage reporting.
3. On Retell, read `telephony_identifier.twilio_call_sid` from the call object. On Vapi, the deprecated `phoneCallProviderId` still carries the Twilio callSid for phone calls.
4. On each LLM response, log the response ID. It maps to `gen_ai.response.id`.
5. On webhooks, dedupe. Retell retries up to 3 times after a 10-second timeout. Key per-call events on `event` plus `call_id`.
Logging must never add latency
Every millisecond spent logging on the audio path is a millisecond of dead air. Follow four rules.
- Enqueue, never send. The hot path writes to an in-memory queue. A separate thread or process ships it.
- Batch spans. Use the SDK's `BatchSpanProcessor`, as both LiveKit and Pipecat examples do.
- Drop debug, never errors. If the queue fills, shed interim and debug events first. Keep turn, tool and error records.
- Upload artifacts after the call. Audio and reports go to object storage once the session ends. Respect LiveKit's `session_end_timeout` or raise it.
Monitoring tool call failures and latency spikes from these logs
This is the most common question we get from teams running agents in production. The answer is three alerts built on the turn and tool tables.
First, alert on tool failure rate by tool and schema version. Count `timeout`, `error`, `empty` and `invalid` together. Silent failures hide inside `empty`.
Second, alert on p95 user-perceived latency, not mean. Break it down by stage so the alert names a suspect: endpointing, STT, LLM, tool, or TTS.
Third, alert on claim-versus-result mismatches. When `agent_claimed_outcome` says "booked" and the tool status is not `ok`, page someone.
For the broader alerting design, see how to monitor AI voice agents in production. For alert payloads, see our walkthrough of per-turn call monitoring alerts.
Deepgram usage and performance: what to log and where to pull it
Log three things on every Deepgram stream: `metadata.request_id`, `metadata.model_info` (name and version), and audio seconds sent. Add STT timing from your turn record. That gives you performance.
For usage, Deepgram's Manage API lists requests per project at `GET /v1/projects/{project_id}/requests`. You can filter by `request_id`, `endpoint`, `method` (`streaming`) and `status` (`succeeded` or `failed`). Each request carries a response code and usage details. Reconcile that daily against your own audio-seconds totals. A gap means dropped streams or billing surprises. See the Deepgram requests reference.
Versioning prompts, test cases, assertions and results
Treat prompts like code and results like data. Store the prompt text in version control. Compute `prompt_hash` from the exact rendered template in CI. Stamp both on every call.
Give test cases stable IDs and a version. An assertion is a small typed rule tied to a test case. One example: "tool `create_payment_plan` called once with installments 3." Results are rows keyed by `test_case_id`, `test_case_version`, `agent_version`, `prompt_hash` and `run_id`.
With that shape, prompt regressions become a query. Compare pass rates and production metrics before and after a `prompt_hash` change. Our post on voice agent metric drift covers the statistics.
Storage, sampling and retention
Different layers have different shapes. Store them accordingly.
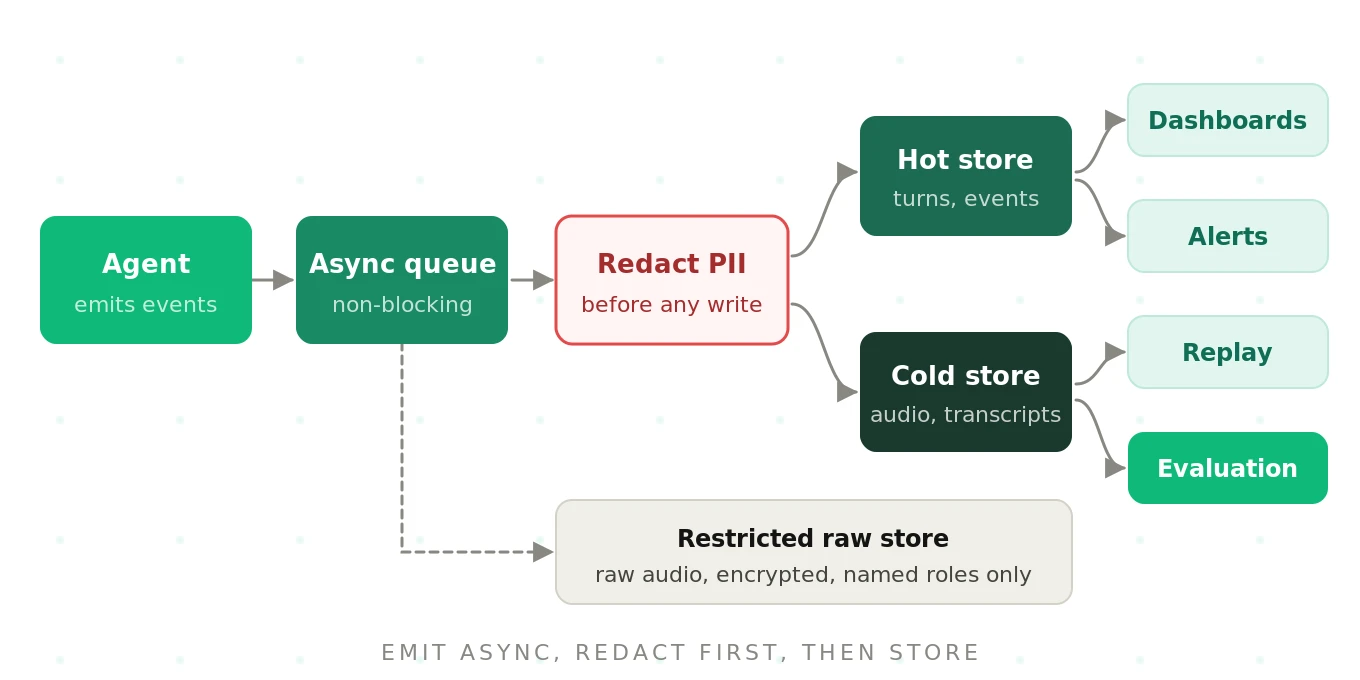
| Tier | Data | Store | Retention (example) | Access |
|---|---|---|---|---|
| Hot | Call and turn rows, errors, recent events | Warehouse or columnar log store | 30 to 90 days queryable | Engineering, on-call |
| Warm | Full event timelines, spans | Trace backend or partitioned tables | 14 to 30 days | Engineering |
| Cold | Redacted transcripts, provider reports | Object storage, lifecycle rules | Per policy, often 1 year | Eval and QA |
| Restricted | Raw audio, raw transcripts | Separate encrypted bucket | Shortest your policy allows | Named roles, audited |
Retention periods are examples, not recommendations for your jurisdiction. Your legal and compliance owners set them.
Sampling rules
Sample volume, never failures. Keep 100 percent of these calls:
- Any error, tool failure, fallback or retry
- Any escalation, transfer or "talk to a human" request
- Any compliance-relevant call: payments, health, consent, opt-out
- Any call with latency or dead air above threshold
- Any call touched by an experiment or new version in its first days
Sample the rest for full event timelines if cost demands it. Keep call and turn rows for every call. They are small.
Index for the queries you will run
Partition by date. Cluster or index by `agent_version`, `prompt_hash`, `carrier`, `region` and `end_reason`. Put `call_id` on everything. Store tool calls in their own table, keyed by `turn_id`. Then failure rates need no JSON unnesting at query time.
Privacy and compliance: redact before you persist
Logging makes calls debuggable. It also creates a copy of everything the caller said. Design for that from day one. This section is general engineering guidance, not legal advice.
The core rule: redact before persistence, and keep raw and redacted data physically separate. Your default pipeline writes only redacted transcripts and hashed identifiers. Raw audio and raw text go to a restricted store, if they are kept at all.
A practical pipeline looks like this:
1. Transcribe in memory. Run entity detection on the final transcript before it is written anywhere.
2. Replace entities with typed placeholders such as `[CARD]`, `[DOB]`, `[ACCT]`. Keep a reversible mapping only if a named process needs it.
3. Strip content from spans. LiveKit's `allow_pii=False` and the `OTEL_INSTRUMENTATION_GENAI_CAPTURE_MESSAGE_CONTENT=false` setting keep prompts and tool payloads out of trace exporters.
4. Suppress DTMF digits in payment flows. Log that digits were pressed, never which.
5. Mute or pause recording during card capture, or route payments to a compliant IVR segment.
6. Attach consent flags to the call envelope: whether recording was announced, how consent was captured, and the caller's likely jurisdiction.
7. Support deletion by `call_id` and by hashed caller identifier across every tier, including object storage and backups.
On card data, the PCI Security Standards Council is clear. Sensitive authentication data, including card verification codes, must not be stored after authorization. Its FAQ on SAD storage explains why this holds even without a PAN present. Audio and transcripts count, so a caller reading a CVV aloud is a logging problem.
On health data, see the HIPAA Privacy Rule's minimum necessary standard. It asks covered entities to limit PHI use and access to what a purpose requires. For logs, that means role-based access and redacted defaults.
On recording consent, US law varies by state. The Digital Media Law Project's guide to recording phone calls summarizes one-party and all-party consent regimes. Its page notes it is no longer updated, so confirm current rules with counsel. Log what consent you obtained so you can prove it later.
Platform settings help but do not replace your pipeline. Retell's `data_storage_setting` supports `everything_except_pii` and `basic_attributes_only`. When storage is opted out, Retell's webhook docs say the `recording_url` expires after 10 minutes. Download it inside that window or lose it. For the full redaction playbook, see our PII handling guide for voice agents.
The 10 queries your logs must answer
If your schema cannot answer these, fix the schema. SQL below is generic and simplified. Table names match the schema above.
1. p95 user-perceived latency by carrier, last 7 days
SELECT c.carrier,
       APPROX_QUANTILES(t.user_perceived_latency_ms, 100)[OFFSET(95)] AS p95_ms,
       COUNT(*) AS turns
FROM turns t JOIN calls c USING (call_id)
WHERE c.started_at >= CURRENT_DATE - 7
GROUP BY c.carrier
ORDER BY p95_ms DESC;
2. Tool failure rate by tool and schema version
SELECT name, schema_version,
       COUNTIF(result_status IN ('error','timeout','empty','invalid')) / COUNT(*) AS failure_rate,
       COUNT(*) AS calls
FROM tool_calls
WHERE ts >= CURRENT_DATE - 1
GROUP BY name, schema_version
ORDER BY failure_rate DESC;
3. Interruption rate before and after a prompt change
SELECT c.prompt_hash,
       AVG(CAST(t.interrupted AS INT64)) AS interruption_rate,
       AVG(CAST(t.false_interruption AS INT64)) AS false_interruption_rate
FROM turns t JOIN calls c USING (call_id)
WHERE c.agent_id = 'billing-agent' AND c.started_at >= '2026-09-17'
GROUP BY c.prompt_hash;
4. Calls that ended in dead air
SELECT call_id, max_dead_air_ms, end_reason
FROM calls
WHERE end_reason = 'caller_hangup'
  AND last_speaker = 'caller'
  AND trailing_silence_ms > 5000;
5. Cost per resolved call by agent version
SELECT agent_version,
       SUM(cost_total) / NULLIF(COUNTIF(task_success_signal = 'confirmed_by_system'), 0) AS cost_per_resolution
FROM calls
WHERE started_at >= CURRENT_DATE - 30
GROUP BY agent_version;
6. Regressions after an LLM snapshot change
SELECT llm_model_served,
       AVG(CAST(task_success_signal = 'confirmed_by_system' AS INT64)) AS success_rate,
       APPROX_QUANTILES(p95_user_perceived_latency_ms, 100)[OFFSET(50)] AS median_call_p95_ms
FROM calls
WHERE agent_id = 'billing-agent' AND started_at >= CURRENT_DATE - 14
GROUP BY llm_model_served;
7. Claim-versus-result mismatches (silent tool failures)
SELECT t.call_id, t.turn_id, t.agent_claimed_outcome, tc.name, tc.result_status
FROM turns t JOIN tool_calls tc USING (turn_id)
WHERE t.agent_claimed_outcome IS NOT NULL
  AND tc.result_status <> 'ok';
8. Which stage dominates slow turns (uses derived per-turn duration columns)
SELECT CASE
         WHEN tool_latency_ms > llm_ttft_ms AND tool_latency_ms > tts_ttfb_ms THEN 'tool'
         WHEN llm_ttft_ms > tts_ttfb_ms THEN 'llm'
         ELSE 'tts' END AS dominant_stage,
       COUNT(*) AS slow_turns
FROM turns
WHERE user_perceived_latency_ms > 2000
GROUP BY dominant_stage;
9. STT errors and reconnects by Deepgram model version
SELECT stt_model_version, COUNT(DISTINCT call_id) AS affected_calls
FROM events
WHERE type IN ('stt.error', 'stt.reconnect')
GROUP BY stt_model_version;
10. Eval scores joined back to versions
SELECT c.agent_version, e.metric, AVG(e.score) AS avg_score, COUNT(*) AS n
FROM eval_results e JOIN calls c USING (call_id)
WHERE e.evaluator_version = 'rubric-v7'
GROUP BY c.agent_version, e.metric;
`APPROX_QUANTILES` and `COUNTIF` are BigQuery syntax. In Postgres, use `percentile_cont(0.95) WITHIN GROUP (ORDER BY ...)` and `COUNT(*) FILTER (WHERE ...)`.
Anti-patterns that make calls impossible to debug
We see the same six mistakes across stacks.
Logging only transcripts. A transcript cannot show latency, overlap, dead air or tone. It also shows what STT heard, not what the caller said.
No version info. Without `prompt_hash`, `llm_model_served` and `config_hash`, you cannot attribute a regression. You can only notice it.
Wall-clock skew across services. Subtracting timestamps from three hosts produces negative latencies and phantom spikes. Use one monotonic clock per call and store offsets.
Logging audio without consent. Recording first and asking later creates legal exposure. It also poisons your eval dataset if you must delete it.
Sampling away the failures. Uniform 10 percent sampling keeps 10 percent of your incidents. Always keep errors, escalations and compliance calls.
Unstructured strings. `print(f"tool failed: {e}")` cannot be counted, grouped or alerted on. Emit typed fields.
More failure patterns live in why voice agents fail in production.
How logs feed evaluation
Good logs turn every production call into test material. Three loops matter.
Replay as regression tests. Take calls that failed, strip them to caller audio plus expected outcomes, and replay them against each new version. Dual-channel audio and turn timing make replay realistic. Pair this with synthetic callers for coverage and shadow testing for live traffic.
Score every call, not a sample. Rubric and model-based evaluators can score each call on task success, compliance and conversational quality. Scores write to `eval_results` keyed by `call_id` and `turn_id`.
Link scores back to versions. Because every call carries its versions, a score drop points at a specific change. Curate the best-labeled calls into a golden dataset.
This is where independence matters. The team that built the agent should not be the only one grading it. Evalgent is an independent evaluation platform for voice agents. It ingests the call, turn, event and artifact data described here. It scores every call against your rubrics and writes results back by `call_id`. The schema in this post is the shape we ask teams to send. For how this fits the wider stack, see voice agent observability.
How to roll out call logging in a week
A one-week plan for a team with an agent already in production.
1. Day 1: Define IDs and the envelope. Generate `call_id` at the first touchpoint. Add `agent_version`, `prompt_hash`, `config_hash` and model fields. Ship it to one table.
2. Day 2: Capture provider IDs. Log Twilio `CallSid` and `StreamSid`, Deepgram `request_id`, LLM response IDs, and your platform's call ID. Push your call_id into provider metadata.
3. Day 3: Add per-turn timing. Wire LiveKit `conversation_item_added` or Pipecat observers. Stamp your own milestones on a monotonic clock. Compute user-perceived latency.
4. Day 4: Wrap every tool. Add the tool wrapper with status, latency, error type and redacted args. Log `agent_claimed_outcome` next to tool results.
5. Day 5: Redact and split storage. Add entity redaction before writes. Create separate raw and redacted buckets with different access roles. Add consent flags.
6. Day 6: Build the queries and alerts. Implement the 10 queries. Alert on tool failure rate, p95 latency and claim mismatches.
7. Day 7: Run the five-minute test. Pick five random calls. Time each reconstruction. Fix whatever blocked you, then connect scoring.
Copyable checklist
Paste this into your logging design review. Every line should be true before you call logging done.
- `call_id` generated at first touchpoint and present on every record
- `turn_id` on every turn, event, tool call and eval score
- `agent_version`, `prompt_version`, `prompt_hash`, `config_hash`, `tool_schema_version` on the envelope
- STT, LLM and TTS provider, model and served version logged
- Twilio `CallSid` and `StreamSid`, Deepgram `request_id`, LLM response IDs captured
- Per-turn milestones on one monotonic clock, with user-perceived latency derived
- Endpointing mode and parameters, interruptions, false interruptions, overlap and dead air logged
- Every tool call logged with status, latency, error type and redacted args
- Agent-claimed outcome logged next to the tool result
- Cost per component with a `pricing_version`
- Raw end reason and normalized end reason both stored
- Logging is queue-based and never blocks the audio path
- Redaction runs before persistence; raw and redacted stores are separate
- DTMF digits suppressed in payment flows; consent flags on the envelope
- 100 percent retention for errors, escalations and compliance calls
- Deletion by `call_id` works across every tier
- Eval results stored in their own table, keyed by `call_id` and `turn_id`
- Five-minute reconstruction test passes on random calls
The bottom line
Voice agent call logging is the foundation that testing, evaluation and debugging stand on. Teams that log four joined layers, with versions and provider IDs on every record and redaction before storage, can reconstruct, replay and score any call.
Frequently asked questions
How do I monitor tool call failures and latency spikes in production voice agents?
Monitor tool call failures and latency spikes by wrapping every tool call. Log status, latency, error type and schema version, keyed to a turn_id. Alert on failure rate by tool and version, counting timeouts and empty results. Alert on p95 user-perceived latency broken down by stage. Also alert when the agent claims success but the tool result failed.
How do I monitor voice agents in production?
To monitor voice agents in production, log a call envelope, per-turn timing, tool results and outcomes for every call. Build dashboards on p95 user-perceived latency, tool failure rate, interruption rate, dead air and task success. Alert on thresholds per agent version. Then score calls with an independent evaluator so quality regressions surface, not just outages.
How do I monitor and log Deepgram API usage and performance in production?
Log Deepgram's metadata.request_id, model_info name and version, and audio seconds on every stream. Record STT timing per turn, including when speech_final arrives. For usage, pull the Manage API's project requests endpoint, filtered by streaming method and status. Reconcile it daily against your own audio totals to catch dropped streams or billing gaps.
How do I detect prompt regressions in a voice agent?
Detect prompt regressions by stamping a prompt_hash and prompt_version on every call. Compare task success, interruption rate, tool failure rate and latency before and after each hash change. Replay a fixed regression suite of past failed calls against every new prompt. Without the hash on each call, you can notice a regression but never attribute it.
How do I version voice agent prompts, test cases, assertions, and results?
Version voice agent prompts in source control and stamp a hash of the rendered prompt on every call. Give test cases stable IDs and versions. Write assertions as typed rules tied to a test case. Store results as rows keyed by test case version, agent version, prompt hash and run ID. Then any result traces to exact inputs.
Should I record audio on every voice agent call?
Record audio on every call only where consent and policy allow. Dual-channel recordings make replay, overlap and barge-in analysis possible, which transcripts cannot. Announce recording, log how consent was captured, and pause recording during card capture. Store raw audio in a restricted, encrypted bucket with short retention. This is general guidance, not legal advice.
What is user-perceived latency in a voice agent?
User-perceived latency is the time from the end of the caller's speech to the first agent audio reaching them. It spans endpointing, STT, LLM time to first token, tool calls and TTS first byte. Vendor "e2e" numbers often exclude network or carrier legs, so log your own milestones and derive it yourself.
How long should I retain voice agent call logs?
Voice agent call log retention depends on your legal and compliance requirements. A common pattern keeps call and turn rows queryable for 30 to 90 days. Redacted transcripts stay longer in cold storage. Raw audio gets the shortest retention your policy allows. Keep deletion by call_id working everywhere.
Want every call scored independently, straight from these logs? Book a demo.
Related Articles
How to automate voice agent testing: synthetic callers vs manual QA
Learn how ai test automation replaces manual QA for voice agents. Compare synthetic callers vs human testers, with a 5-step framework to scale without hiring.
Read more
AI Agent Testing vs Voice Agent Testing: What General Tools Miss for Voice
AI agent testing measures text outputs. Voice agent testing measures behaviour through an acoustic pipeline. Five failure categories general tools miss.
Read more