Voice agent testing vs monitoring vs observability (and evaluation): a working model
On this page
Most articles on this topic stop at a four-row table. That table is correct and nearly useless. It tells you the words mean different things. It does not tell you which practice catches an endpointing bug, how many calls you must score to see a one-point regression, or how to page someone when task success drops.
This guide does those things. It defines each practice by the question it answers and the data it needs. It maps seven voice failure layers to the practice that catches each one, and when. It shows a voice turn as an OpenTelemetry trace using the current GenAI conventions. Then it works through the sampling math, the alert design, a maturity model, and a runbook you can copy.
The four practices, defined by the question each answers
The cleanest split is not by tool or by team. It is by the question you are asking and the data you need to answer it.
| Practice | The question it answers | Kind of unknown | Data it needs | When it runs | Output |
|---|---|---|---|---|---|
| Testing | Does this build behave as specified under conditions we chose? | Known knowns | Scripted scenarios, synthetic caller audio, expected outcomes | Before deploy, on every change | Pass or fail per scenario |
| Evaluation | How good was this call, against a written rubric? | Defined criteria | Audio, transcript, tool calls, rubric | Both sides of launch | Scores and labels |
| Monitoring | Is a known indicator outside its bound right now? | Known unknowns | Aggregated time series of scores and system metrics | After deploy, continuously | Alerts and tickets |
| Observability | Why did this specific call go the way it did? | Unknown unknowns | Raw, wide, high-cardinality events and traces | After deploy, on demand | Explanations and new test cases |
The "known unknowns" language comes from Charity Majors. In her observability manifesto she puts it plainly: "Monitoring is about known-unknowns and actionable alerts." Observability is the ability to ask new questions of your system without shipping new code to collect new data. Her test is concrete. If you pre-aggregate, or you cannot group by high-cardinality fields like a request ID, you are not doing observability.
Google's SRE book chapter on monitoring adds the other half. A monitoring system should answer two questions: what is broken, and why. The "what" is the symptom. The "why" is a cause. The book recommends paging on symptoms and keeping cause-hunting for debugging. That maps cleanly: monitoring pages on symptoms, observability finds causes.
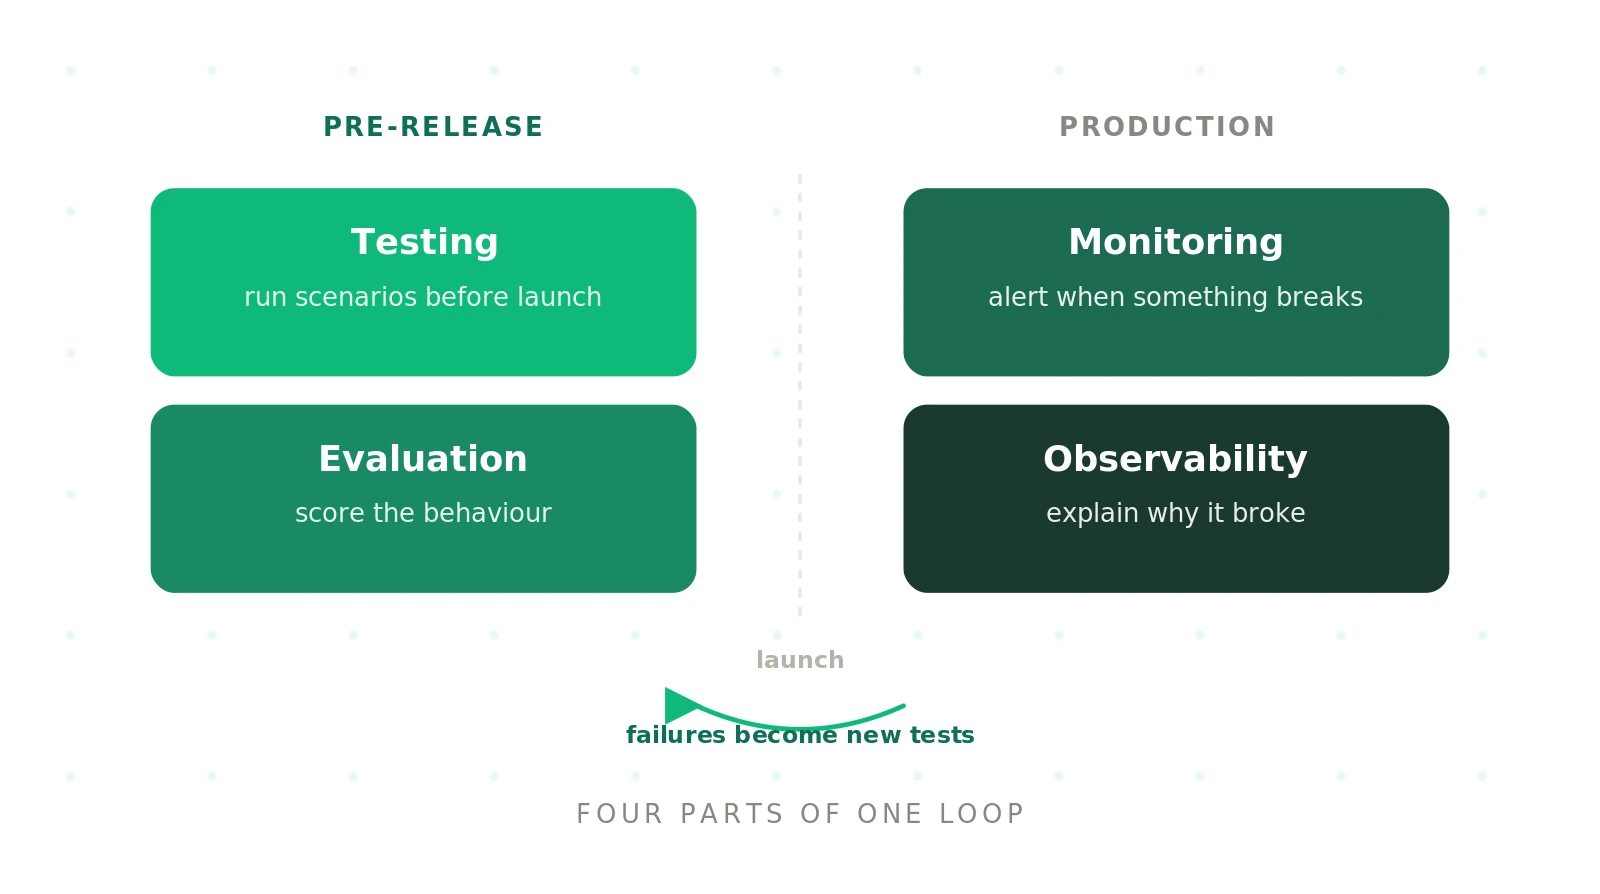
Evaluation is the odd one out because it is not a phase. It is a function. You feed it a call and a rubric, and it returns a score. Testing calls that function on synthetic calls before launch. Monitoring calls it on real calls after launch and watches the scores as a time series. Observability uses the scores as one more field to slice by. If you build one evaluator and reuse it everywhere, the four practices become one system.
The voice-specific problem: the success response that lies
The SRE book lists three kinds of errors. Some are explicit, like an HTTP 500. Some are by policy, like a response slower than your commitment. The third kind is implicit: a success response carrying the wrong content. The book notes that only end-to-end system tests can detect that you are serving the wrong content.
That third kind is the dominant failure mode of a voice agent. The caller asks to move an appointment to Tuesday. The agent says "Done, you're all set for Thursday." Every span is green. STT returned a final transcript. The LLM returned in 600 ms. The tool returned 200. TTS played clean audio. No infrastructure metric moved.
This is why voice teams cannot copy a web-service monitoring playbook. The golden signals of latency, traffic, errors and saturation still matter. But the error that hurts most is semantic, and only an evaluator can turn it into a number. Once it is a number, monitoring can watch it and alert on it. Evaluation is the bridge that lets the other three practices see meaning.
Why pre-deploy testing cannot prove a low failure rate
Teams often treat a green test suite as proof that the agent is reliable. The statistics say otherwise, and this is the main reason testing can never replace monitoring.
The rule of three
Suppose you run 300 synthetic calls on a release candidate and all 300 pass. What failure rate have you ruled out? Hanley and Lippman-Hand answered this in their 1983 JAMA paper If Nothing Goes Wrong, Is Everything All Right?. When you observe zero events in n trials, the 95% upper bound on the true rate is about 3/n.
| Clean test runs (zero failures) | 95% upper bound on true failure rate |
|---|---|
| 100 | 3.0% |
| 300 | 1.0% |
| 1,000 | 0.3% |
| 3,000 | 0.1% |
So 300 clean runs only tell you the failure rate is probably under 1%. A compliance failure at 0.3% of calls is invisible to that suite. At 10,000 calls a day, 0.3% is 30 bad calls a day. You need production volume to see failures that rare.
Single-run pass rates overstate reliability
The tau-bench paper from Yao and colleagues made a related point for tool-using agents. They simulated users with an LLM, gave the agent real API tools and policy rules, and checked the database state at the end of each conversation. They also introduced pass^k: the chance an agent succeeds on the same task in all k independent trials.
Their headline: gpt-4o solved under 50% of tasks, and its pass^8 on the retail domain fell below 25%. An agent that passes a scenario once may fail the same scenario on the next run. For a voice agent, where ASR noise and sampling add variance on top of the LLM, this matters even more.
If trials were independent, pass^k is just p to the power k. This illustrative table shows how fast consistency decays:
| Per-run success (p) | pass^1 | pass^4 | pass^8 |
|---|---|---|---|
| 0.90 | 90% | 66% | 43% |
| 0.95 | 95% | 81% | 66% |
| 0.99 | 99% | 96% | 92% |
The practical rule: run each critical scenario several times and gate on the worst run, not the average. Our guide to synthetic callers for voice agent testing covers how to vary the caller between runs.
What testing is actually for
None of this makes testing less important. It makes its job clearer. Testing catches deterministic breaks and large regressions before any caller hears them. A prompt edit that breaks date parsing fails every time. A model swap that doubles the transfer rate shows up in 200 runs. What testing cannot do is measure small rates. That job belongs to evaluation running on production traffic, watched by monitoring.
A failure taxonomy: which practice catches what, and when
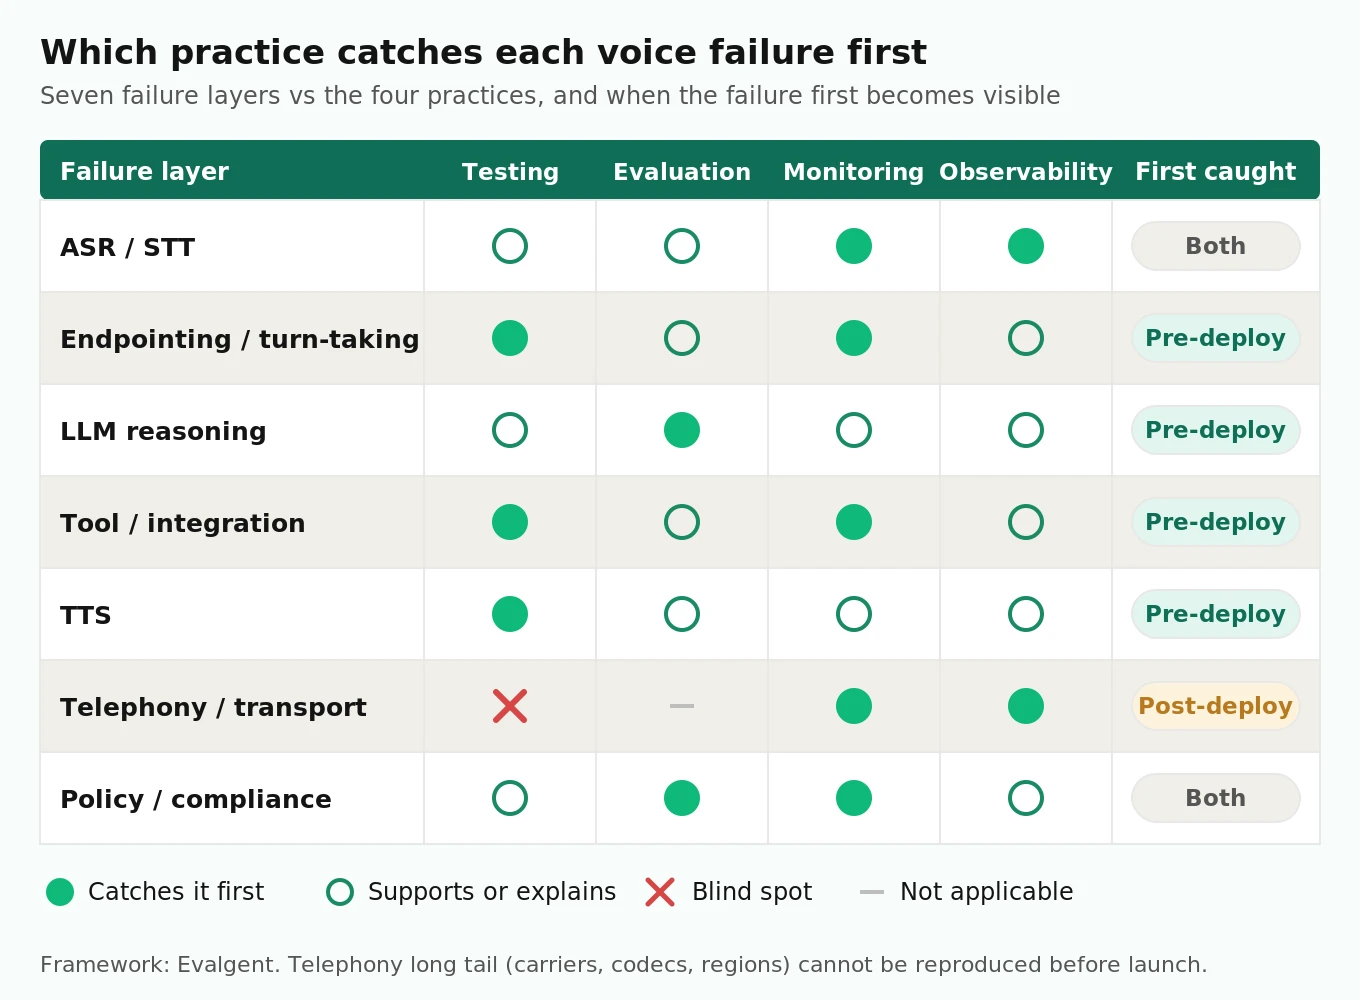
A voice agent fails at seven layers. Each layer fails in its own way, and each is caught first by a different practice. This matrix is the core of the guide.
| Layer | Typical failure | Caught pre-deploy by | Caught post-deploy by | Explained by these fields |
|---|---|---|---|---|
| ASR / STT | Wrong entity, hallucinated words on silence, accent gaps | Testing with noisy and accented audio, scored on entity accuracy | Monitoring ASR confidence, re-ask rate, per-segment entity failure | Audio clip, transcript, confidence, STT model and version |
| Endpointing / turn-taking | Agent cuts in mid-sentence, or waits too long | Testing with scripted pauses and barge-ins | Monitoring interruption rate and turn latency | VAD start and stop times, end-of-turn event, silence timer setting |
| LLM reasoning | Wrong answer delivered fluently, lost context | Evaluation of test calls against a rubric | Evaluation of production calls, watched as a rate | Prompt version, model ID, full context, tool results |
| Tool / integration | Wrong arguments, empty payload returned with 200, timeout | Testing against a stubbed backend with assertions | Monitoring tool error and empty-result rates | Tool name, arguments, result, duration |
| TTS | Mispronounced names, numbers read wrong, clipped audio | Testing with entity-heavy prompts, listened or scored | Monitoring TTS time to first byte and character counts | Text sent to TTS, voice ID, audio clip |
| Telephony / transport | One-way audio, codec mismatch, dropped calls | Limited: a few carrier test calls | Monitoring call setup failure, silence-only calls, jitter | Carrier, codec, SIP response codes, region |
| Policy / compliance | Missing disclosure, wrong refund promise, PII read aloud | Evaluation of adversarial test calls | Evaluation of every production call | Transcript, policy rule ID, agent version |
What the matrix teaches
Three patterns stand out.
First, telephony failures are almost invisible before launch. You can place a few test calls, but you cannot reproduce every carrier, region and handset. PSTN audio arrives as 8 kHz narrowband, often G.711, and your pipeline may resample it to 16 kHz for STT. A codec mismatch or a one-way audio bug shows up as a call with caller speech but no agent audio, or the reverse. Only monitoring at production scale catches the long tail here.
Second, ASR failures need audio in the trace. The Careless Whisper study by Koenecke and colleagues found that roughly 1% of Whisper transcriptions contained entire hallucinated phrases with no basis in the audio. 38% of those hallucinations contained explicit harms. Hallucinations were more frequent for speakers with longer non-vocal stretches. In a voice agent, that means long caller pauses are where invented words appear. A transcript-only log cannot show this. You need the audio clip next to the transcript to see that the words were never spoken.
Third, benchmark accuracy does not transfer. In WER We Are and WER We Think We Are, Szymański and colleagues compared commercial ASR systems on real spontaneous conversations and found error rates significantly higher than the best published benchmark results. Your pre-deploy ASR test only predicts production if its audio looks like production audio. Build your test set from sampled real calls, not clean read speech. Our golden dataset guide covers how.
The policy row is the one teams get wrong most often. A disclosure miss might happen in 0.5% of calls. By the rule of three, you would need about 600 clean test calls just to bound it near that level. The only reliable control is to evaluate every production call for policy rules, then alert on the rate.
Mapping a voice turn to OpenTelemetry GenAI spans
Observability needs a data model. For LLM systems, that model is now the OpenTelemetry GenAI semantic conventions. Three facts about them matter before you build on them.
First, they moved. The GenAI conventions now live in a dedicated repository, open-telemetry/semantic-conventions-genai. The old pages on opentelemetry.io say the content has moved and is no longer maintained there.
Second, they are not stable. Every GenAI span and attribute carries Development status. Names have changed before and will change again. Pin a semantic-conventions version in your instrumentation and expect migrations.
Third, they do not define STT or TTS spans. The inference span covers model calls. There are spans for embeddings, retrieval, memory, tools and agents. There is no standard span for a speech recognizer or a speech synthesizer. An open proposal, PR #394, would add realtime voice session spans, a VAD-bounded user speech span, and an audio transcript field. During review its span names changed more than once, so do not hard-code them yet.
The conventions you can use today
| Convention | What it is | Use in a voice agent |
|---|---|---|
| Inference span, named `{gen_ai.operation.name} {gen_ai.request.model}` | One model call | The LLM step of each turn |
| `gen_ai.operation.name`, `gen_ai.provider.name` | Required on inference spans | Filter by provider and operation |
| `gen_ai.conversation.id` | Correlates a conversation | Set to your call ID |
| `gen_ai.prompt.name`, `gen_ai.prompt.version` | Named prompt template and version | Group quality scores by prompt version |
| `gen_ai.response.time_to_first_chunk` | Seconds to first streamed chunk | LLM share of turn latency |
| `execute_tool` operation with `gen_ai.tool.name`, `gen_ai.tool.call.id`, `gen_ai.tool.call.arguments`, `gen_ai.tool.call.result` | One tool call | Booking, lookup, transfer |
| `invoke_agent {gen_ai.agent.name}` | An agent invocation | The call or the sub-agent |
| `gen_ai.evaluation.result` event | A score for a GenAI output | Attach evaluator output to the turn it judged |
The events document defines `gen_ai.evaluation.result` with `gen_ai.evaluation.name` (required), `gen_ai.evaluation.score.value`, `gen_ai.evaluation.score.label`, and `gen_ai.evaluation.explanation`. It should be parented to the span being evaluated, or carry `gen_ai.response.id` when no span ID is available. This one event is what joins evaluation to observability in a standard way.
The metrics side has `gen_ai.client.operation.duration`, `gen_ai.client.operation.time_to_first_chunk`, `gen_ai.client.token.usage` and `gen_ai.execute_tool.duration`. Those are the series your monitoring layer charts.
One voice turn as a trace
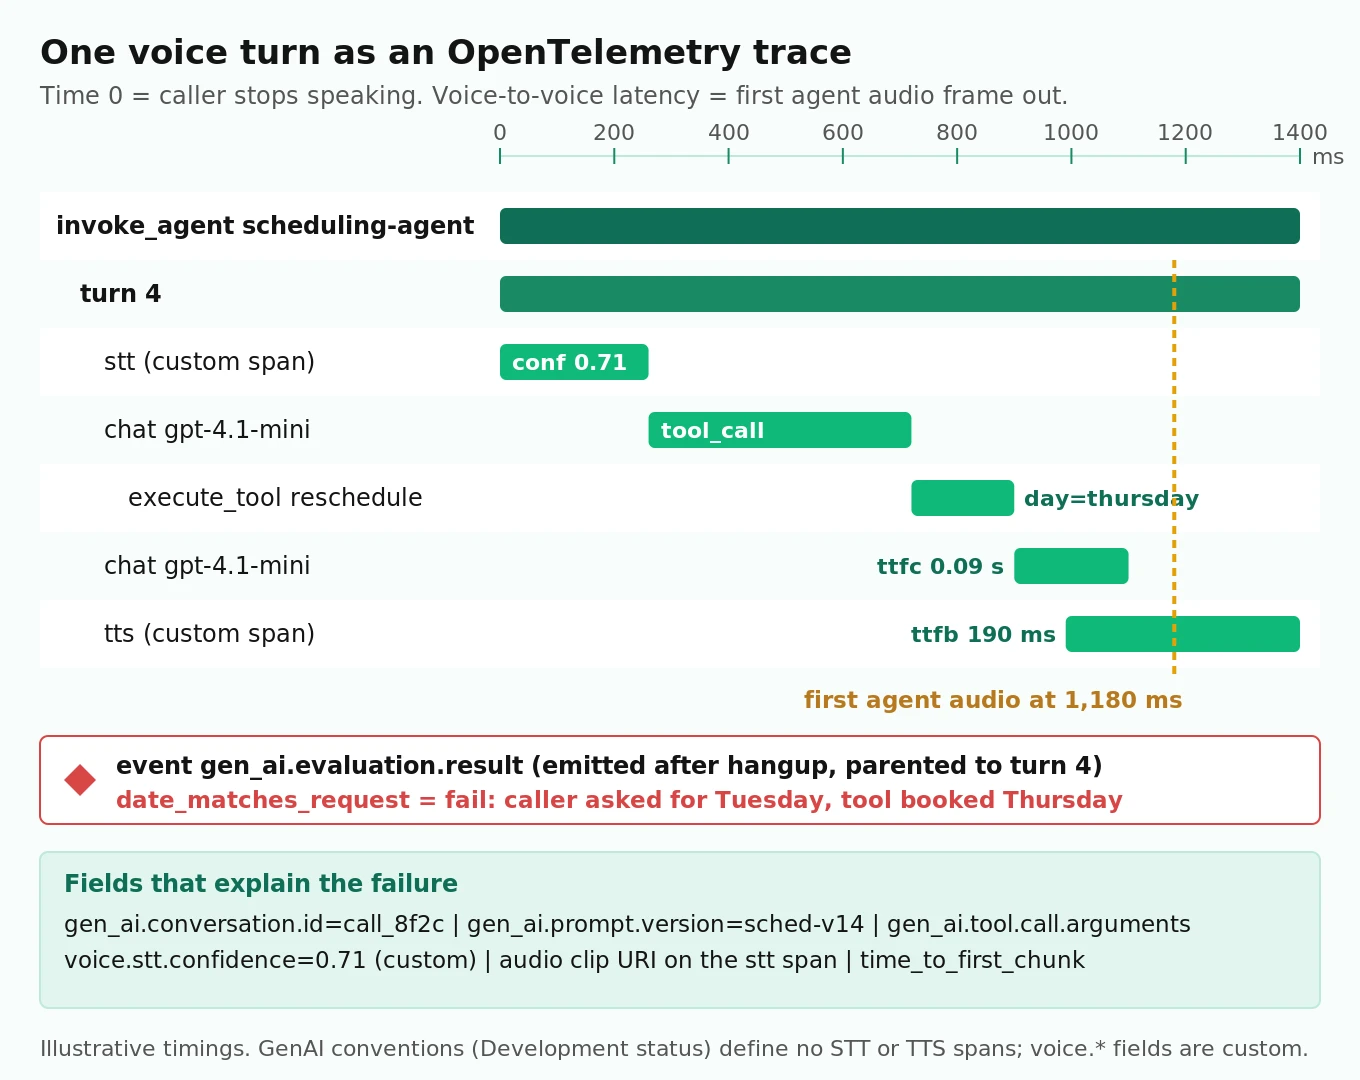
Here is a single turn of an appointment agent, written as a span tree. Durations are illustrative. Custom attributes for the speech layers use a `voice.` prefix, because the spec does not define them.
invoke_agent scheduling-agent        gen_ai.conversation.id=call_8f2c
└── turn 4                           voice.turn.v2v_latency_ms=1180  voice.turn.interrupted=false
    ├── stt                          voice.stt.model=nova-3  voice.stt.confidence=0.71  (custom)
    ├── chat gpt-4.1-mini            gen_ai.prompt.version=sched-v14  time_to_first_chunk=0.41
    │   └── execute_tool reschedule  gen_ai.tool.call.arguments={"day":"thursday"}
    ├── tts                          voice.tts.ttfb_ms=190  voice.tts.chars=58  (custom)
    └── event gen_ai.evaluation.result
          gen_ai.evaluation.name=date_matches_request  score.label=fail
          explanation="Caller asked for Tuesday; tool booked Thursday"
Read it bottom up and the bug explains itself. The evaluator flagged a date mismatch. The tool arguments say Thursday. STT confidence on the turn was 0.71, below this agent's usual range. Pull the audio clip and you will likely hear "Tuesday" spoken over noise. Monitoring would have shown a small rise in date-mismatch failures. Observability shows this exact call and why.
What Pipecat and LiveKit emit, and their gotchas
You rarely build this trace by hand. Both major open-source frameworks emit spans already.
Pipecat's OpenTelemetry tracing organizes traces as conversation, then turn, then stt, llm and tts spans. Turn spans carry `turn.number`, `turn.duration_seconds` and `turn.was_interrupted`. Service spans carry `metrics.ttfb`. STT and TTS spans reuse `gen_ai.provider.name` and `gen_ai.request.model`, even though the spec defines those for model calls. Two defaults bite people. `enable_turn_tracking` defaults to `False` on the `PipelineWorker`, so you get no turn spans unless you set it. And the docs note that missing service data usually means `enable_metrics=True` was not set in `PipelineParams`.
LiveKit Agents exports its session spans once you call `set_tracer_provider` from `livekit.agents.telemetry`. Attributes come from an `lk.` namespace and the `gen_ai.` namespace. Three details are worth knowing:
- Agents 1.7.0 renamed 12 content attributes with an `lk.pii.` prefix, so `lk.chat_ctx` became `lk.pii.chat_ctx`. LiveKit's docs warn that dashboards and queries using old names stop matching without raising an error. That is a monitoring failure caused by an upgrade, and only a test of the dashboards would catch it.
- Passing `allow_pii=False` strips content attributes, tool arguments and results, and exception messages before any exporter sees them. Token counts, model names and durations remain.
- `gen_ai.usage.input_tokens` already includes `gen_ai.usage.cache_read.input_tokens`. Adding the two double-counts cached tokens and inflates cost dashboards.
Two gotchas when attaching evaluation to traces
Most evaluation runs after the call ends. By then the turn span is closed, and you cannot add events to an ended span. Store the trace ID and span ID of each turn when the call runs. The evaluator then creates its own span in the same trace, parented to the stored context.
# Simplified, illustrative. Uses the OpenTelemetry Python API.
from opentelemetry import trace
from opentelemetry.trace import NonRecordingSpan, SpanContext, TraceFlags

tracer = trace.get_tracer("voice-evaluator")

def emit_eval(trace_id: int, span_id: int, name: str,
              score: float, label: str, explanation: str) -> None:
    turn_ctx = SpanContext(
        trace_id=trace_id, span_id=span_id, is_remote=True,
        trace_flags=TraceFlags(TraceFlags.SAMPLED),
    )
    parent = trace.set_span_in_context(NonRecordingSpan(turn_ctx))
    with tracer.start_as_current_span(f"evaluate {name}", context=parent) as span:
        span.add_event("gen_ai.evaluation.result", attributes={
            "gen_ai.evaluation.name": name,
            "gen_ai.evaluation.score.value": score,
            "gen_ai.evaluation.score.label": label,
            "gen_ai.evaluation.explanation": explanation,
        })
The convention defines `gen_ai.evaluation.result` as a log-based event. Some SDKs do not emit those yet, so this sketch records it as a span event. The second gotcha is sampling. If your collector uses tail sampling, it decides to keep or drop each trace after a fixed wait. A score that arrives minutes later may land in a trace the collector already dropped. Either keep every trace that will be scored, or write scores to your call store keyed by call ID as well.
Finally, keep audio out of spans. PR #394 reviewers noted that a minute of raw audio is megabytes. Store clips in object storage and put the URI on the span. Our what to log on every call guide lists the full field set.
How many calls to score: the sampling math
Once evaluation runs on production traffic, the next question is how much of it to score. The answer depends on the smallest change you need to detect.
Detecting a regression between two versions
To compare a failure rate between a baseline (p1) and a new version (p2), the standard two-proportion sample size per arm, at 5% two-sided significance and 80% power, is:
n = (1.96 × sqrt(2 × p̄ × (1 − p̄)) + 0.84 × sqrt(p1(1 − p1) + p2(1 − p2)))² / (p1 − p2)²
where p̄ is the average of p1 and p2. Plugging in:
| Baseline failure rate | New failure rate | Scored calls needed per arm |
|---|---|---|
| 2% | 3% | 3,826 |
| 4% | 5% | 6,745 |
| 5% | 6% | 8,158 |
| 5% | 8% | 1,059 |
| 5% | 10% | 435 |
Two lessons come out of this table. A 200-scenario test suite can catch a doubling of failures, but it cannot see a one-point rise. And a one-point rise needs thousands of scored calls on each side.
The worked example
Assume an agent takes 10,000 calls a day and you want to catch a task-failure rise from 4% to 5% after a prompt change.
- Scoring a 2% random sample gives 200 scored calls a day. Reaching 6,745 per arm takes about 34 days. The regression runs for a month before the data can show it.
- Scoring every call gives 10,000 scored calls a day. You reach 6,745 per arm in well under a day on a 50/50 canary.
This is the core argument behind scoring every call, not a sample. Sampling is not wrong. It just buys you slow detection.
Reading a single rate: use Wilson intervals
For a dashboard tile showing one failure rate, show the interval, not just the point. The Wilson score interval behaves well at the small rates voice teams care about. At 95% confidence:
| Failures / scored calls | Point estimate | Wilson 95% interval |
|---|---|---|
| 5 / 100 | 5.0% | 2.2% to 11.2% |
| 20 / 400 | 5.0% | 3.3% to 7.6% |
| 50 / 1,000 | 5.0% | 3.8% to 6.5% |
| 200 / 4,000 | 5.0% | 4.4% to 5.7% |
A daily tile built on 100 scored calls can swing from 2% to 11% on noise alone. Teams chase those swings and lose trust in the dashboard. Either score more calls or widen the time window.
What scoring every call costs
Cost is the usual objection to full coverage. Work it through with explicit assumptions.
Assume 300,000 calls a month, 4 minutes each. Assume the evaluator reads about 3,000 input tokens per call (transcript, tool log, rubric) and writes 300 output tokens. That is 900 million input tokens and 90 million output tokens a month.
- At an illustrative LLM price of $1.00 per million input tokens and $4.00 per million output tokens, scoring costs about $900 + $360 = $1,260 a month.
- The voice minutes cost far more. 1.2 million minutes at GPT-Live's $0.05 per minute is $60,000 a month.
Under these assumptions, scoring every call adds about 2% to the voice bill. If the judging is mostly classification, a dedicated classifier lowers it further. Jev from TypeSafe System One is one example: highly consistent, priced at $0.042 per million input tokens, with 70 to 500 ms responses. At 900 million input tokens that is about $38 a month.
Where you should sample is human review. People are expensive and slow. A sound pattern: humans review every call the evaluator flags as a severe failure, plus a small random sample each day. The random sample measures how often the evaluator agrees with humans. Our guide to sampling live calls covers stratification.
Your rubric will drift, and that is expected
Human review does more than check the evaluator. It changes what you evaluate. In Who Validates the Validators?, Shankar and colleagues built a tool for aligning LLM graders with human grades. They observed what they called criteria drift: people need criteria to grade outputs, but grading outputs changes their criteria. Some criteria could only be defined after seeing real outputs.
For voice teams this is the formal version of a familiar experience. You read 50 real calls and discover a failure you never wrote a rule for. That is observability feeding evaluation. Version your rubric, re-score a fixed reference set when it changes, and never compare scores across rubric versions without that re-score. Our post on LLM judge limits covers the judge side.
Alert design: SLO burn rates for a voice agent
Monitoring is only useful if it pages the right person at the right time. The SRE Workbook chapter on alerting on SLOs gives a tested method. Voice agents need a few changes to it.
Define SLIs as good events over total events
The workbook recommends SLIs that count good events against total events. Burn rate is how fast you spend the error budget relative to the SLO. A burn rate of 1 uses exactly the whole budget over the SLO window.
Percentile targets like "p95 under 1,200 ms" do not fit this model well. You cannot average percentiles across agent servers. Convert them into ratios instead: "95% of turns have voice-to-voice latency at or under 1,200 ms." Then count slow turns as bad events from a latency histogram.
Here are three voice SLIs, with illustrative targets:
| SLI | Good event | Illustrative SLO (30 days) | Error budget |
|---|---|---|---|
| Turn latency | Agent turn with voice-to-voice latency at or under 1,500 ms | 99% | 1% of turns |
| Task success | Scored call where the evaluator marks the task complete and correct | 95% | 5% of calls |
| Audio path | Call with two-way audio and no transport drop | 99.5% | 0.5% of calls |
Voice-to-voice latency is the gap between the end of caller speech and the first agent audio frame sent back. Measure it at the transport, not inside the LLM span.
Apply the multiwindow, multi-burn-rate thresholds
The workbook's recommended starting point is three tiers. Each needs both a long and a short window to exceed the threshold, so alerts stop soon after a problem ends.
| Severity | Long window | Short window | Burn rate | Budget consumed |
|---|---|---|---|---|
| Page | 1 hour | 5 minutes | 14.4 | 2% |
| Page | 6 hours | 30 minutes | 6 | 5% |
| Ticket | 3 days | 6 hours | 1 | 10% |
Translate that into failure-rate thresholds for each voice SLI:
| SLI | Fast page (14.4x) | Slow page (6x) | Ticket (1x) |
|---|---|---|---|
| Turn latency, 99% SLO | More than 14.4% slow turns | More than 6% slow turns | More than 1% slow turns |
| Task success, 95% SLO | More than 72% failed calls | More than 30% failed calls | More than 5% failed calls |
| Audio path, 99.5% SLO | More than 7.2% bad calls | More than 3% bad calls | More than 0.5% bad calls |
Look at the task-success row. A 72% failure rate means the agent is broken outright. The workbook warns about this case: with a loose SLO, the fast page tier barely ever fires. For quality SLIs, treat the 6x and 1x tiers as the real alerts. Treat the fast tier as a catastrophe detector.
Here is the latency page rule, adapted from the workbook's Prometheus example:
# Simplified. Assumes a histogram voice_turn_latency_seconds with a 1.5 s bucket.
groups:
- name: voice-turn-latency-slo
  rules:
  - record: voice:slow_turns:ratio_rate5m
    expr: |
      (sum(rate(voice_turn_latency_seconds_count[5m]))
        - sum(rate(voice_turn_latency_seconds_bucket{le="1.5"}[5m])))
      / sum(rate(voice_turn_latency_seconds_count[5m]))
  # Repeat the recording rule for 30m, 1h and 6h windows.
  - alert: VoiceTurnLatencyBudgetBurn
    expr: |
      (voice:slow_turns:ratio_rate1h > (14.4 * 0.01)
        and voice:slow_turns:ratio_rate5m > (14.4 * 0.01))
      or
      (voice:slow_turns:ratio_rate6h > (6 * 0.01)
        and voice:slow_turns:ratio_rate30m > (6 * 0.01))
    labels:
      severity: page
Low traffic and sampled scores change the math
Many voice agents are low-traffic services by the workbook's definition. At night, a 5-minute window may hold three calls. One bad call is then a 33% failure rate and a false page. The workbook offers three fixes: generate artificial traffic, combine related services into one SLI, or lengthen the windows.
Artificial traffic is where testing and monitoring meet. A synthetic caller that dials the production number every few minutes is a black-box prober. It keeps the SLI fed overnight, and it is the same asset your test suite already uses. The workbook also warns about the trap: if real callers hit a failure the synthetic caller does not, the probe's successes mask the real errors. Keep probes in their own series, labeled, and never let them dilute real-caller SLIs.
Sampling also adds noise to quality alerts. Take the task-success ticket rule: alert when the 3-day failure rate tops 5%, with a true healthy rate of 4%. Assume 2,880 calls a day.
| Share of calls scored | Scored calls in 3 days | Chance of a false ticket per check |
|---|---|---|
| 100% | 8,640 | Near 0% |
| 10% | 864 | About 6.7% |
| 5% | 432 | About 14% |
At 5% sampling, roughly one check in seven files a false ticket even when nothing changed. Alert fatigue follows. This is the operational cost of sampling, separate from the slow detection shown earlier.
Alert on voice-specific leading indicators
Burn-rate alerts guard the SLO. A few voice-specific signals deserve dashboards and tickets, not pages:
- ASR drift. Track the distribution of STT confidence, the rate of agent re-asks such as "could you repeat that," and entity failure rate. Segment each by carrier and codec. Also replay a fixed set of reference audio through your production STT setup every day and compute WER against known transcripts. If WER on unchanged audio moves, the provider changed something. See our post on voice agent metric drift.
- Prompt regressions. Tag every inference span with `gen_ai.prompt.version`. Roll a new prompt to a canary share. Compare evaluator failure rates by prompt version using the sample-size table above. Our LLM update regression guide covers model swaps the same way.
- Silent tool failures. Count tool calls that return success with an empty or default payload. They never raise errors. See detecting silent tool failures.
A maturity model for voice agent quality
Use this to place your team and choose the next step. Each level adds one capability and an exit test.
| Level | Testing | Evaluation | Monitoring | Observability | Exit test |
|---|---|---|---|---|---|
| 0. Demo | Manual calls by the builder | Gut feel | Provider dashboard | Call recordings, if enabled | Can you name your top three failure modes? |
| 1. Scripted | Scenario suite run before release | Rule checks on test transcripts | Uptime and error-rate alerts | Transcripts searchable by call ID | Every release runs the suite |
| 2. Scored | Synthetic callers with noise, accents, barge-in; k runs per scenario | One rubric scoring test calls | Latency SLI with burn-rate alerts | Traces with STT, LLM, tool and TTS spans | Test and production use the same scorer |
| 3. Closed loop | Every production failure becomes a regression scenario | Same rubric scores every production call | Quality SLIs with ticket and page tiers | Wide events grouped by prompt, model, carrier | A canary can prove a 1-point change |
| 4. Audited | Independent scenario sets and vendor bake-offs | Human-agreement checks and rubric versioning | Synthetic probes kept separate from real-caller SLIs | Audio linked to every scored turn | An outside party can reproduce your scores |
Most teams that think they have "monitoring" are at Level 1. The jump to Level 2 is the shared evaluator. The jump to Level 3 is volume: scoring enough production calls for the statistics to work.
How to wire testing, evaluation, monitoring and observability together
This runbook takes a team from Level 1 to Level 3. Each step produces an artifact the next step uses.
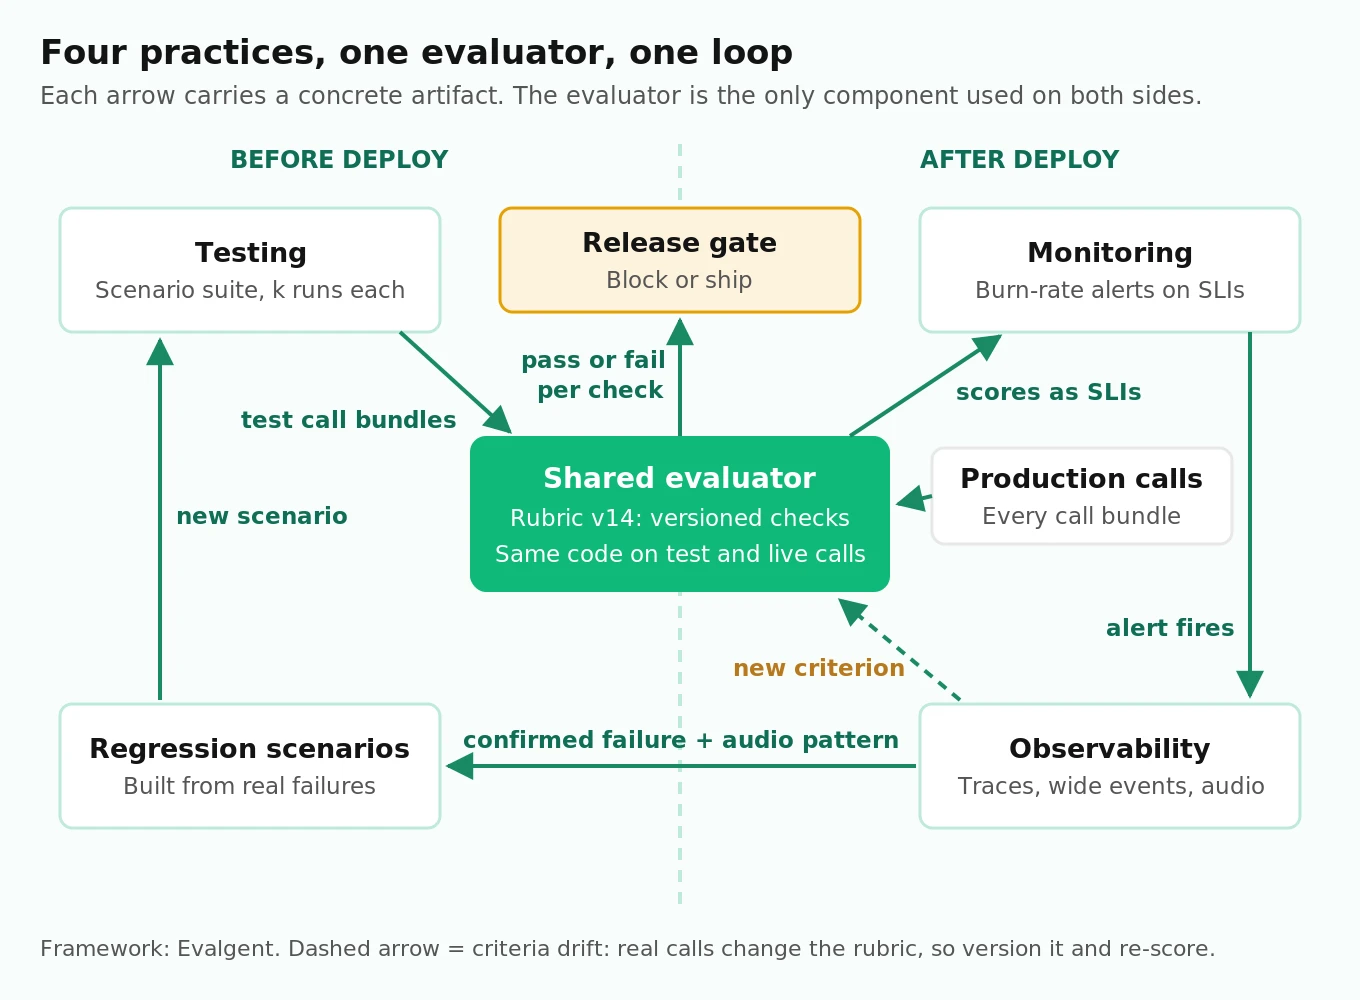
1. Write the rubric first. List five to ten pass or fail checks tied to business outcomes: task completed, correct entity captured, required disclosure spoken, correct escalation. Give each check an ID and a version. This rubric is your evaluator's contract.
2. Build one evaluator service. It takes a call bundle (audio URI, transcript, tool calls, metadata) and returns per-check labels, scores and explanations. Test runs and production calls both call it. Never fork it.
3. Instrument the call path. Emit OpenTelemetry spans for the turn, STT, inference, tools and TTS. Set `gen_ai.conversation.id` to the call ID and `gen_ai.prompt.version` on every inference span. In Pipecat, turn on `enable_turn_tracking`. In LiveKit, set the tracer provider and decide on `allow_pii`.
4. Write one wide event per call. Include call ID, agent version, prompt version, model IDs, STT and TTS models, carrier, codec, region, turn count, interruptions, tool errors, latency percentiles and every evaluator label. This row is what you group by when something breaks.
5. Build the pre-release gate. Run the scenario suite with k runs per critical scenario through the evaluator. Block the release if any critical check fails in any run, or if aggregate pass rates fall outside thresholds set from the sample-size table. The voice agent testing guide covers scenario design.
6. Score production traffic. Send every call bundle to the evaluator after hangup. Emit `gen_ai.evaluation.result` linked to the turn span, and also write labels to the wide event, so late scores survive trace sampling.
7. Define SLIs and alerts. Start with turn latency, task success and audio path. Apply the burn-rate tiers. For quality SLIs, rely on the 6x and 1x tiers and label synthetic probes separately.
8. Roll out behind a canary. Ship each prompt or model change to a traffic share large enough to reach the needed sample size within a day. Compare evaluator rates by version before going to 100%. Shadow testing works for changes you cannot expose to callers.
9. Triage with traces. When an alert fires, filter wide events by the failing check, group by high-cardinality fields, and open the traces and audio for the top cluster. Write down the cause.
10. Close the loop. Convert each confirmed production failure into a regression scenario with the caller audio pattern that triggered it. If the cause was a missed criterion, add a rubric check, bump the rubric version, and re-score a fixed reference set. The production feedback loop post covers the cadence.
Where independent evaluation fits
The weak point in this whole system is the evaluator. If the team that builds the agent also writes and tunes the scorer, the scorer tends to drift toward what the agent already does well. That is not bad faith. It is criteria drift, seen from inside one team.
Evalgent is an independent evaluation platform for voice agents. It covers the parts of this runbook where a neutral scorer matters most: the pre-launch audit, vendor bake-offs on identical scenarios, regression suites on every release, and scoring production calls against the same rubric used before launch. It does not replace your tracing backend or your alerting stack. It feeds them consistent scores. For a wider view of how these failures appear in the field, see why voice agents fail in production and our production monitoring guide.
Frequently asked questions
What is the difference between voice agent monitoring and observability?
Monitoring watches known indicators, such as turn latency or task-failure rate, and alerts when one crosses a threshold. Observability lets you investigate a specific call and ask questions you did not plan for, using raw traces, audio and high-cardinality fields like prompt version or carrier. Monitoring tells you something is wrong. Observability tells you why.
How do you monitor a voice agent for prompt regressions?
Tag every inference span with `gen_ai.prompt.version`, roll the new prompt to a canary share of traffic, and score every canary and baseline call with the same evaluator. Compare failure rates by version. To detect a rise from 4% to 5% at 80% power, you need about 6,745 scored calls per arm.
How do you detect ASR drift in production?
Track STT confidence distributions, agent re-ask rates and entity failure rates, segmented by carrier and codec. Also replay a fixed set of reference audio through your production STT configuration daily and compute WER against known transcripts. If WER moves on unchanged audio, the provider or your configuration changed.
Is LLM observability enough for voice AI agents?
No. LLM observability covers model calls, prompts and tools. Voice agents also fail in STT, endpointing, TTS and telephony, which LLM traces do not capture. The OpenTelemetry GenAI conventions do not yet define STT or TTS spans. You need audio, VAD timings and transport metrics alongside the LLM spans.
How many production voice agent calls should you score?
Score every call automatically if you need to detect small regressions quickly. A 2% sample of 10,000 daily calls takes about a month to show a one-point change. Under typical assumptions, automated scoring costs a few percent of voice minutes. Sample only for human review, which is slow and expensive.
Do voice agent test assertions carry over to production monitoring?
They do if the same evaluator runs both. Write each assertion as a rubric check with an ID, run it on test calls before release, then run it on every production call after. The pass rate of each check becomes a monitorable SLI, and any production failure can be replayed as a test.
Does OpenTelemetry support voice agents?
Partly. The GenAI semantic conventions cover inference, tool and agent spans, plus a `gen_ai.evaluation.result` event, all at Development status. There are no standard STT or TTS spans yet, and a realtime voice proposal is still in review. Pipecat and LiveKit emit OpenTelemetry traces with their own speech attributes.
What should you look for in a voice agent monitoring tool?
Check five things. Can it hold audio linked to each turn? Can it group by high-cardinality fields like call ID and prompt version? Does it accept OpenTelemetry traces? Can it compute ratio SLIs with burn-rate alerts? Does it score calls with the same rubric your pre-release tests use?
The bottom line
Testing proves a build against cases you chose, monitoring watches known indicators, observability explains the calls nobody predicted, and evaluation is the shared scoring function that lets all three see semantic failures. Build one evaluator, score every call, alert on burn rates, and turn every production failure into a test, and the four practices become one system that improves with each release.
Related Articles
Why AI voice agents fail in production: 9 failure layers, how to detect each, and how to prevent them
Voice agents fail in production across 9 layers, from 8 kHz audio to silent tool errors. Symptoms, root causes, alerts, and fixes in one master table.
Read more
Voice agent regression testing: how to detect regressions from model updates you don't control
Voice agent regression testing for changes you don't control: pin each layer, run a nightly pinned-vs-latest canary, and use paired stats to detect drops.
Read more