How to Trace a Voice Call End to End: Phone Network to Agent
On this page
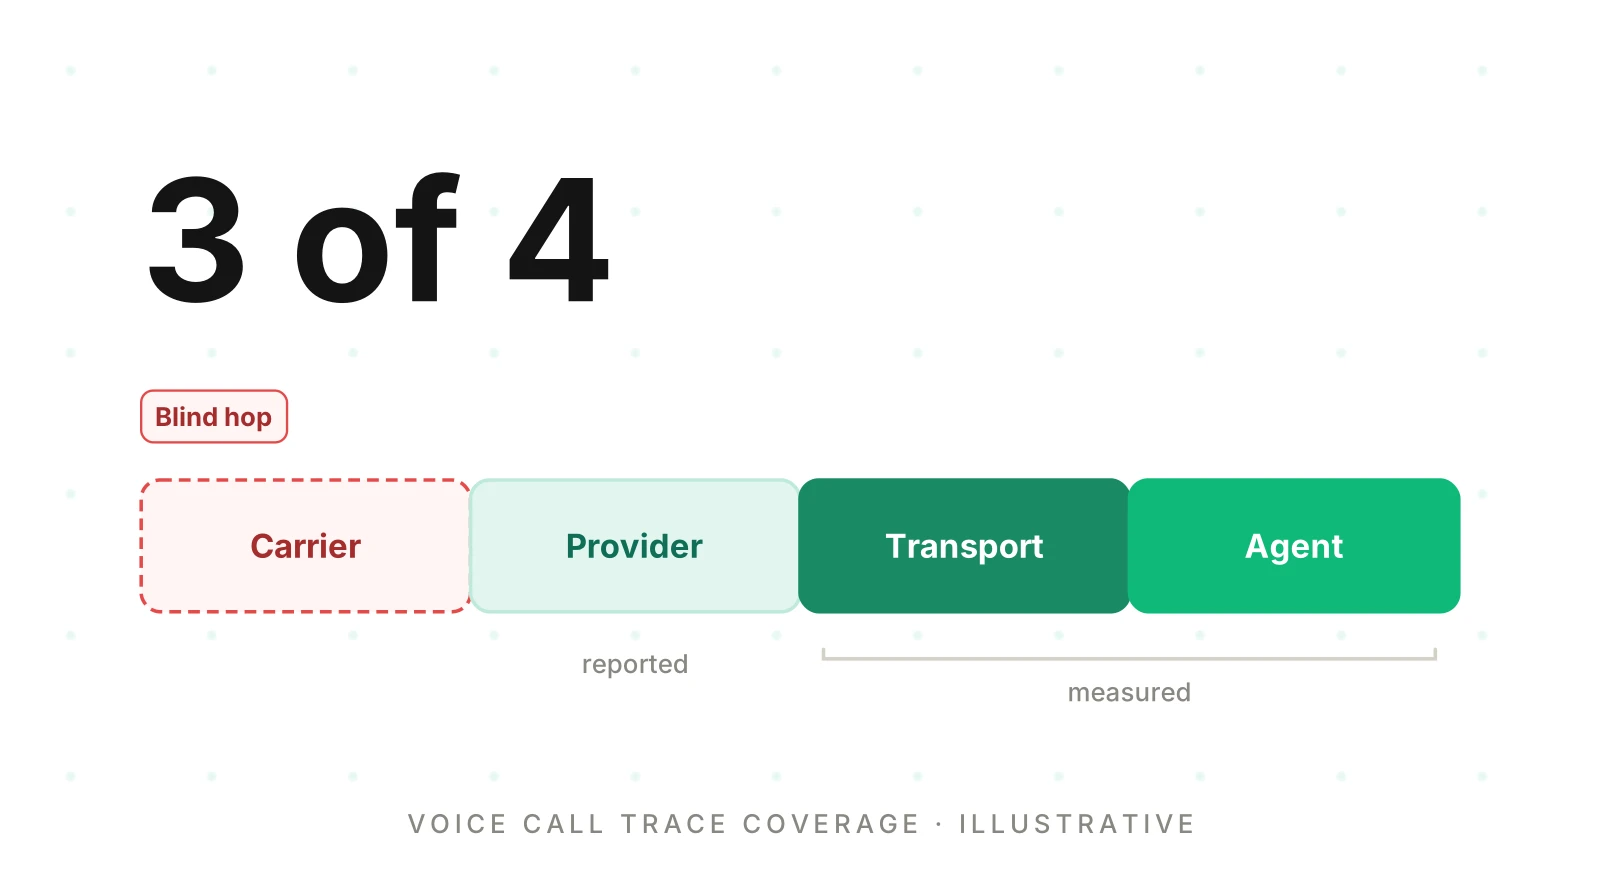
A caller dials a number. Your agent answers a few seconds later. In between, the call crosses a carrier, a telephony provider, a media connection and several of your own services. No single tool sees all of it.
This post shows how to trace voice call end to end across those hops. It covers what each hop can and cannot report, where trace context breaks and how to rejoin it. It also shows how to display coverage gaps instead of hiding them. It is written for teams that run their own voice agent inside a larger product.
Earlier posts cover the structure inside the agent: the trace and span model and the span attributes. This post sits one level out. It covers the path from the phone network to the agent, where end to end tracing voice agent setups usually break. It is distributed tracing voice AI teams need, with one twist: some services are not yours. A separate post goes deep on the voice agent call ID correlation join, so we keep that part short.
Evalgent Observe, which is launching, ingests OpenTelemetry data from any stack and shows coverage gaps. It never sits in the media path. The pattern below works with any OpenTelemetry backend. It is a voice call trace across services: one call, many owners.
The hops of a phone call
A phone call to an AI agent is a relay, not one connection. Different parties run each hop, and each reports different things. The order below is for an inbound call.
- Caller and carrier network. The caller's phone, their carrier and the public telephone network (PSTN) or a SIP trunk. You run none of it.
- Telephony provider. The service that owns your number, receives the call and talks to your app. Twilio, Telnyx and Plivo are examples.
- Your webhook or SIP handler. The first software you control. It decides what happens to the call.
- Transport leg. The media connection into your agent runtime. This is a WebSocket media stream, a SIP leg into a media server or WebRTC. See SIP versus WebRTC.
- Agent runtime. Speech-to-text, the LLM, tool calls and text-to-speech. You run these, or you call hosted providers.
- Return path. Synthesized audio goes back through the transport, the provider and the carrier to the caller's ear.
For outbound calls the order flips. Your API request that places the call is the first hop you control.
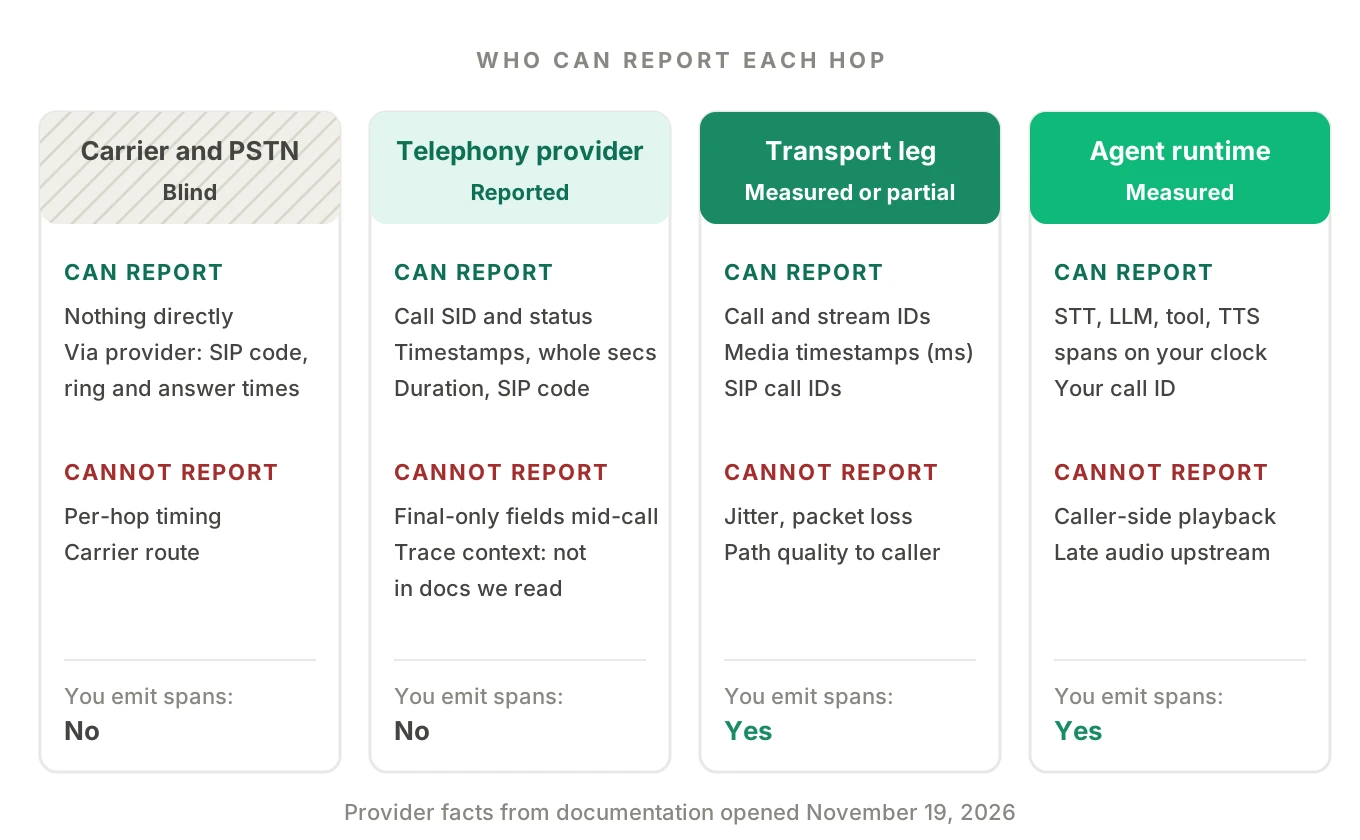
You can only emit spans from software you control. For every other hop, you get reports after the fact, or nothing. A trace that silently skips hops is worse than one that shows its gaps.
What each hop can and cannot report
This section uses vendor documentation we opened on November 19, 2026. Where a page is silent, we say so. We claim no provider behaviour beyond its documentation.
Carrier and PSTN or SIP trunk
You get no spans from the carrier network. What you learn comes second-hand, from your provider: the final SIP response code, ring and answer times, and duration.
SIP does give each call an identifier. The SIP specification, RFC 3261, says the Call-ID header "contains a globally unique identifier for this call". The Call-ID is a join key for the SIP leg. It is not a trace ID, and it does not reach your application unless a component copies it.
What it cannot report: per-hop timing, the carrier route, or anything you could call a span. Treat this hop as blind unless your provider reports otherwise.
Telephony provider
The provider is your first source of call facts. Twilio documents the pieces well, so we use it as the example. Check other providers' docs for their own fields.
The Twilio Call resource has a sid that is a 34-character string starting with CA. It also has a status of queued, ringing, in-progress, completed, busy, failed, no-answer or canceled. Start and end times and a duration are there too. A parent_call_sid identifies the call that created a leg.
Status callbacks add more. The Twilio status callback parameters include CallSid, ParentCallSid, CallStatus, Timestamp and SequenceNumber. Terminal events add CallDuration and SipResponseCode. The page says the sequence number starts at 0 and that arrival order is not guaranteed. So sort events by sequence number, not by when they reached you.
Three limits matter:
- Timestamps are the provider's clock. The
Timestampfield is documented as UTC in RFC 2822 format. That format carries whole seconds, so you cannot rebuild millisecond timing from it. - Some fields arrive only at the end. Duration and the SIP response code are documented for terminal events. You cannot read them mid-call.
- Events are separate HTTP requests. Each status callback is a new inbound request, outside any trace until you attach it.
Transport leg
If the provider streams audio to you over a WebSocket, the Twilio Media Streams messages carry useful fields. The start message includes callSid, streamSid, customParameters and the media format. Each media message has a timestamp, documented as milliseconds from the start of the stream. The documented format is 8 kHz mu-law, one channel.
The callSid joins the stream to the provider's call record. The media timestamp places audio on the call's timeline. Neither reports packet loss, jitter or delay on the path to the caller.
If the provider connects through SIP into a media server, other identifiers apply. LiveKit's SIP participant reference lists sip.callID ("LiveKit's SIP call ID") and sip.callIDFull ("Trunk provider SIP call ID"). For Twilio trunks it lists sip.twilio.callSid. So one call can carry three identifiers across systems. Record all of them. For wiring, see LiveKit with Twilio and Pipecat with Twilio and Telnyx.
Agent runtime
You control this hop fully, and most teams already have spans here. Follow the span model. Your spans only describe what your runtime saw. If audio arrived late, your STT span starts late and looks fine.
Return path
Your TTS span can end when synthesis ends or when playback ends. Neither tells you when the caller heard the last word. Say which one your span uses. Our latency measurement post lists the clocks you can derive.
Where the trace context breaks
OpenTelemetry joins spans across services using context propagation. The OpenTelemetry docs define context as "an object that contains the information for the sending and receiving service". They define propagation as "the mechanism that moves context between services and processes". The default propagator uses the headers from the W3C Trace Context specification.
That specification defines a traceparent header. The W3C Trace Context Recommendation of November 23, 2021 gives it four fields: version, a 16-byte trace ID, an 8-byte parent ID and trace flags. It defines the header for HTTP. The spec says other protocols may define serialization through extensions. If a service gets no traceparent, the spec says it creates a new trace ID and parent ID.
That rule explains most broken voice traces. Each hop that sees no context starts its own trace, so one call yields several traces that each look complete.
Now look at the call path:
- Carrier to provider. Phone signalling is not HTTP. We found nothing in the W3C text we read that defines a trace header for it.
- Provider to your webhook. This is an HTTP request, so a
traceparentheader could ride on it. But none of the Twilio pages we opened mentiontraceparentor trace context. That covers the Stream, Media Streams messages, Connect, Sip and Call resource pages. We cannot say what any provider does with it. Test, do not assume. Log the headers of a real webhook request and look. - Provider to WebSocket. The media stream is a WebSocket connection. Twilio's documented way to pass your own values is the
<Parameter>noun, delivered in thestartmessage. The stream URL does not support query strings. - SIP into a media server. A SIP header could carry a value. The next section covers what the docs say.
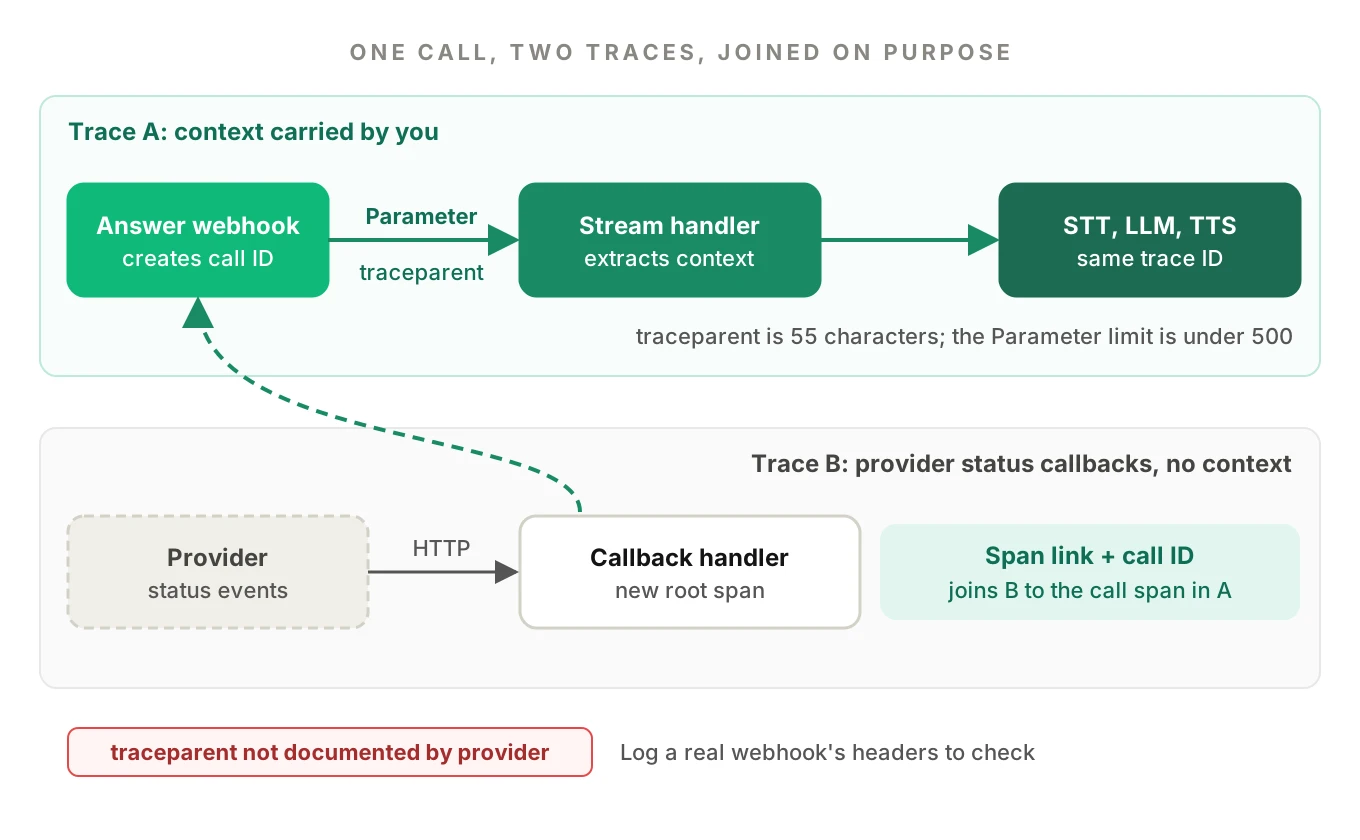
So the question "does Twilio propagate traceparent" has no documented yes. Stop expecting any provider to propagate it. Start the trace at the first hop you control, and carry the context forward yourself.
Carrying context through a stream parameter
Twilio's Stream documentation says you can add key-value pairs using the nested <Parameter> noun. It says "Twilio sends these values to your WebSocket server in the Start message." The combined length of each name and value must be under 500 characters. A version 00 traceparent is 55 characters, so it fits.
<Response>
  <Connect>
    <Stream url="wss://agent.example.com/media">
      <Parameter name="traceparent" value="00-<trace-id>-<span-id>-01"/>
      <Parameter name="call_id" value="<your-call-id>"/>
    </Stream>
  </Connect>
</Response>
The runtime then extracts the context. The OpenTelemetry Python propagation guide shows inject(headers, ctx) on the sender and extract(carrier=carrier) on the receiver, with a plain dictionary as carrier. This sample is simplified.
from opentelemetry import trace
from opentelemetry.trace.propagation.tracecontext import TraceContextTextMapPropagator

tracer = trace.get_tracer("voice-agent")
prop = TraceContextTextMapPropagator()

# 1. In the webhook that answers the call (first hop you control)
def traceparent_for(span):
    carrier = {}
    prop.inject(carrier, trace.set_span_in_context(span))
    return carrier.get("traceparent", "")

# 2. In the media-stream handler, on the "start" message
def on_start(msg):
    start = msg["start"]
    params = start.get("customParameters", {})  # confirm the shape on a real message
    ctx = prop.extract(carrier={"traceparent": params.get("traceparent", "")})
    return tracer.start_span(
        "voice.transport.session",
        context=ctx,
        attributes={"voice.leg.id": start["callSid"],
                    "voice.call.id": params.get("call_id", "")},
    )
If the parameter is missing, there is no span in the context. The trace API specification says that in that case the new span is a root span. That fallback is what you want. The call still gets a trace, and the call ID joins it to the rest.
Carrying context through SIP headers
Twilio's <Sip> documentation says x- headers can be appended to the SIP URI and are sent in the SIP INVITE. The URI must be under 255 characters and the headers under 1024. LiveKit's SIP participant reference says X-* headers can be mapped with headers_to_attributes. It adds that these attributes "are updated asynchronously", so they may be missing when the participant joins.
Together, these suggest a route for a trace ID. Neither page describes trace context, and we did not test the combination. Verify it with a real call. Do not block the agent start on the late attribute. Set the call ID on the span when it appears.
Joining hops with a call identifier and span links
When context cannot be passed, join the pieces with a shared identifier and span links. The separate call ID post goes deeper.
Shared call identifier. Generate your own call ID at the first hop you control. Put it on every span in every trace, as in the span attributes post. Add the provider's call SID, the SIP call IDs and the media stream ID in their own fields. Any backend can then find every trace for one call.
Span links. The OpenTelemetry trace API specification defines a link as a reference to another span's SpanContext, with optional attributes. Linked contexts "can be from the same or a different trace". Adding links at span creation is preferred, because head sampling decisions can only consider information present then.
Span links for voice calls fit the webhook problem well. A provider status callback is its own inbound request. It cannot be a child of your call span, but it can link to it:
from opentelemetry.trace import Link

def on_status_callback(params, call_span_context):
    span = tracer.start_span(
        "voice.provider.status_callback",
        links=[Link(call_span_context, {"voice.link.reason": "provider status event"})],
        attributes={"voice.leg.id": params["CallSid"],
                    "voice.provider.status": params["CallStatus"],
                    "voice.provider.sequence": params.get("SequenceNumber", "")},
    )
    span.end()
Look up call_span_context from a small store keyed by call SID. A link is a pointer, not a parent, which is the honest picture.
Recording hops you do not control
You cannot instrument the carrier, but you can still show it. Record what the provider reported, label it as reported and never draw it as measured.
- A reported span. This is an external span in your trace. When the provider gives a start and end time, create a span with those explicit timestamps. Set
voice.hop.source = "provider_reported"and note the clock source. - An event on the call span. When you only have a moment, such as a ring or an answer, add an event with the provider's timestamp and sequence number.
- A coverage attribute. On the call span, set
voice.trace.coverageper hop to a value such as complete, partial or blind. The names are ours, not a standard. - A gap, not a guess. If a hop reports nothing, leave the space empty on the timeline. The span model post makes the same point for silence between turns.
Clocks differ. Provider timestamps come from the provider, your spans from you. Mixing them can show a child starting before its parent. The source attribute tells a reader which clocks they are comparing.
Evalgent Observe works on the same principle. It gives no verdict without evidence in the data you send. Where the data is blind, it says "undetermined" and shows the coverage gap.
Trace completeness: a coverage table
Use this as a checklist to audit whether you can trace voice call end to end on your own stack. For each hop, answer one question: can I say what happened here, from data I hold? The status column uses three values. Measured means your spans. Reported means the provider told you. Blind means nothing.
| Hop | Typical status | Source of truth | Join key | Gap to flag |
|---|---|---|---|---|
| Carrier and PSTN | Blind | Provider reports only | Provider call SID | No per-hop timing or route |
| Telephony provider | Reported | Call resource, status callbacks | Call SID, parent SID | Final-only fields, second-level timestamps, event order |
| Your webhook or SIP handler | Measured | Your spans | Your call ID | Context not passed onward |
| Transport leg | Measured or partial | Stream messages, SIP attributes | Stream SID, SIP call IDs | No network quality data |
| Agent runtime | Measured | Your spans | Your call ID | Late audio looks like a late span |
| Return path | Partial | Your TTS span | Your call ID | Playback to the caller not observed |
Run the table against a real trace. A row you cannot fill is a finding. A trace with two blind hops that says so beats one that implies it saw everything.
How to trace a voice call end to end in six steps
This is the procedure we suggest to trace voice call end to end and stitch one call. It assumes OpenTelemetry in your own services.
1. Choose the first hop you control — For inbound calls, that is your answer webhook or SIP handler. For outbound calls, it is the API request that places the call. Start the root voice.call span there.
2. Mint one call ID and store the provider IDs — Generate your call ID at that point. Save the provider's call SID, any parent SID and later the stream and SIP IDs. Index them so each one finds the call. Put the call ID on every span.
3. Pass the trace context forward yourself — Inject a traceparent into whatever the next hop accepts: a stream parameter, a SIP header or a queue message. Do not assume the provider propagates it. Check by logging the headers of a real request.
4. Extract it at the agent runtime — On the first message from the transport, read the carried value and start the session span from it. If it is missing, start a root span and rely on the call ID. Both paths must work.
5. Record external hops as labelled spans, events or links — Turn provider status callbacks into events or reported spans with the provider's timestamps. Link late webhooks to the call span. Mark each as reported, never measured.
6. Score coverage on every call — Set a coverage value for each hop on the call span. Alert when a hop that should be measured shows up blind. Review blind hops on a schedule.
A worked example, with illustrative numbers
These numbers are invented to show the method. They are not measurements.
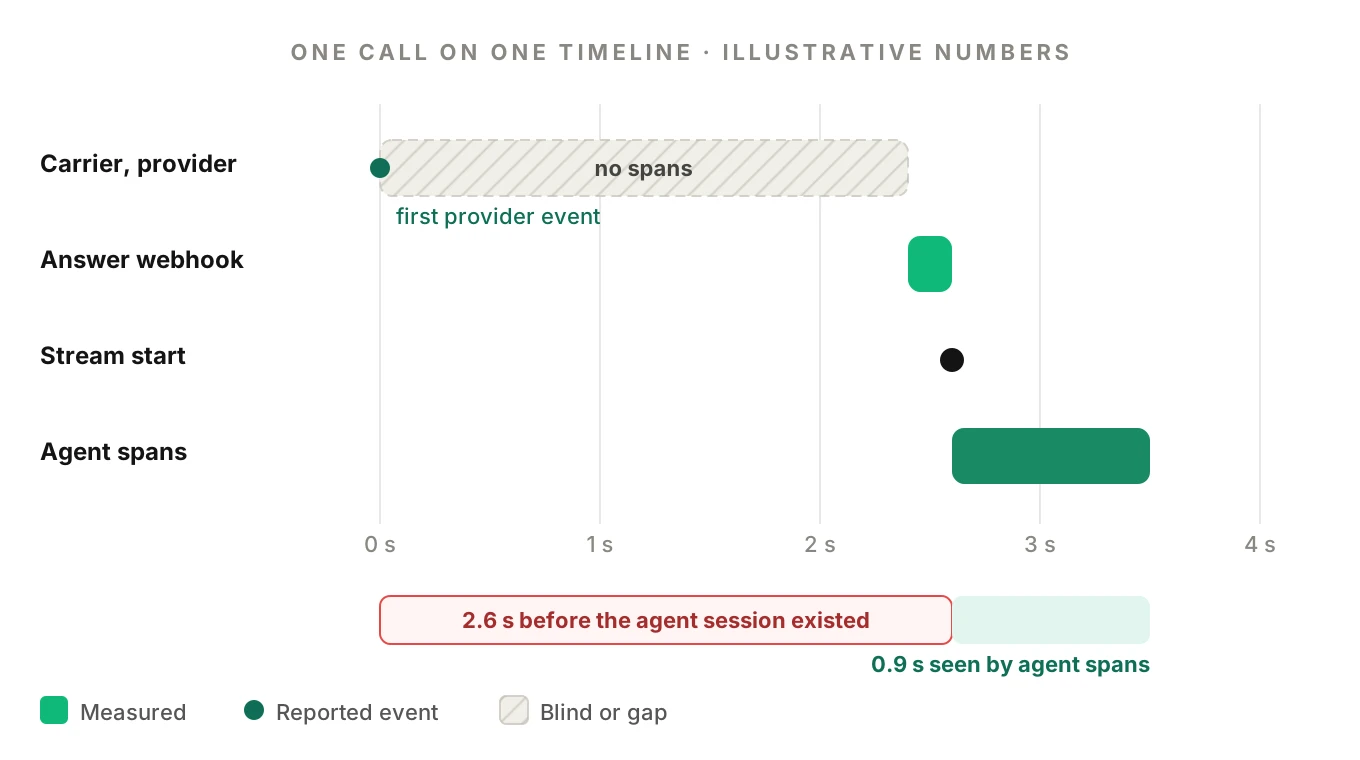
A caller says the agent "took forever to pick up". Your agent trace shows the first greeting 0.9 seconds after the stream started. Those spans look fine. So you check the other hops.
The provider's first status event is at 0.0 seconds. Your webhook span starts 2.4 seconds later. The stream start message arrives 0.2 seconds after that. The greeting plays 0.9 seconds after the start message.
On one timeline, about 3.5 seconds passed. Your agent spans saw only the last 0.9. Without the provider events, the other 2.6 seconds would be invisible, and 2.4 of them came before your first span. Provider timestamps are whole seconds, so the comparison is approximate, and the trace should say so. This is a finding from traces and call data: a long wait before the agent started, with the hop named.
To read a trace like this, see how to debug a bad voice agent call. For why a trace alone does not name a cause, see root cause analysis. When many calls share a gap, clustering failures turns them into one fix.
Testing the trace before callers do
A trace never exercised has unknown holes. Place a test call down every path callers use, so you can trace phone call to agent on each: a PSTN number, a SIP trunk and a WebRTC client. Evalgent's call simulator reaches the agent over PSTN, SIP or WebRTC, so it can drive those calls.
On each test call, confirm that the root span carries your call ID and that the provider and SIP IDs sit on the right spans. Confirm the context passed, or that the fallback join worked. Confirm each blind hop is marked blind, not missing. Repeat after any change to the webhook, the telephony setup or the media server, where context passing breaks silently. Keep phone numbers out of span names and labels, as covered in voice agent PII redaction in logs and traces.
Frequently asked questions
How do you trace a voice call end to end?
Start a root span at the first service you control, mint a call ID and carry trace context to the next hop yourself. Join provider records by call SID, link late webhooks with span links, and record external hops as labelled spans or events. Then score each hop as measured, reported or blind.
Does Twilio propagate the W3C traceparent header?
We cannot say. The Twilio pages we opened on November 19, 2026 (Stream, Media Streams messages, Connect, Sip, Call resource) do not mention traceparent or trace context. Do not assume it. Log the headers of a real webhook request, and pass context yourself through a stream parameter or SIP header.
How do you trace a phone call to an agent across different services?
Use two joins. Pass a traceparent through whatever the next hop accepts, such as a stream parameter. Put a shared call ID and the provider's call SID on every span. If context is lost, the call ID still lets you combine every trace for that call.
What is the difference between a span link and a parent-child span?
A parent-child relationship puts a span inside another span's trace. A link points to another span's context, possibly in a different trace. Use a link for a late provider webhook that relates to a call but did not start inside it.
Where should the trace start for an inbound call?
At the first hop you control, usually the webhook or SIP handler that answers the call. Time before that, such as ringing and carrier routing, is outside your spans. Record it as provider-reported events, or mark it blind if the provider reports nothing.
How do you record a hop you do not control?
Create a span with the provider's reported start and end times, or add an event with its timestamp. Mark it provider reported and note the clock source. If the hop reports nothing, leave a visible gap and mark it blind. Never draw a guess as a measured span.
Can you pass a trace ID through a WebSocket media stream?
Twilio documents custom <Parameter> values that arrive in the stream's start message, under 500 characters per name and value. A version 00 traceparent is 55 characters, so it fits. Extract it with the W3C propagator. If it is missing, start a root span and join by call ID.
How do you show trace coverage gaps instead of hiding them?
Set a coverage value for each hop on the call span: measured, reported or blind. Leave empty timeline space where a hop reports nothing. Alert when a hop that should be measured is blind. Evalgent Observe, which is launching, shows coverage gaps and says "undetermined" where data cannot support a verdict.
The bottom line
To trace voice call end to end, start at the first hop you control, carry context forward yourself and join everything else with a call ID and span links. Mark each hop as measured, reported or blind, because a trace that shows its gaps is worth more than one that hides them.
Related Articles

How to automate voice agent testing: synthetic callers vs manual QA
Learn how ai test automation replaces manual QA for voice agents. Compare synthetic callers vs human testers, with a 5-step framework to scale without hiring.
Read more
AI Agent Testing vs Voice Agent Testing: What General Tools Miss for Voice
AI agent testing measures text outputs. Voice agent testing measures behaviour through an acoustic pipeline. Five failure categories general tools miss.
Read more