Voice Agent Traces Show What Happened, Not Why the Call Failed
On this page
A caller asks to move an appointment. The agent goes quiet for several seconds, then gives a vague, wrong answer. The trace is open on your screen. It shows a slow tool span, then a fallback reply. Now what?
That is the gap this post covers. A trace shows what happened. It rarely shows why. Voice agent root cause analysis is the work between the two, and most of that work happens outside the trace.
This post is vendor-neutral until the last sections. It sets out what a trace can and cannot tell you, walks one illustrative failure, and ends with a six-step routine. It makes no benchmark claims. For the buyer checklist, see voice agent observability. For the split between testing, monitoring and observability, see the working model.
What a trace records, and what it leaves out
OpenTelemetry's trace documentation defines a span as a unit of work. Each span carries a name, a parent, start and end timestamps, attributes, events and a status. A trace is the set of spans that share one trace ID, arranged by parent.
That is a precise record of sequence and time. For a voice call it answers real questions. Which step ran next? How long did the tool take? Did the model call start before the transcript was final?
It does not answer three other questions.
- What was different about this call? A span has no memory of the release it ran in, unless someone put that on it.
- Is this call alone? One trace is one sample. It cannot say whether the pattern is rare or common.
- Which of several plausible causes is true? The trace shows the effect. Many causes produce the same effect.
There is a second trap. In the same documentation, span status defaults to Unset, which means the operation finished without error. A slow span that eventually returned is usually not an error. A fallback reply that sounds fluent is not an error either. Every span can look healthy while the caller got a wrong answer. Our post on silent tool failures covers that pattern in depth.
So a trace is necessary and not sufficient. It is the best evidence of what happened on one call. It is weak evidence of why.
Three layers: what happened, what was different, what else failed
Google's SRE book frames troubleshooting as a loop. You hypothesize potential causes and test them until a root cause is identified. It also says recent changes are a productive place to start. And it warns that correlation is not causation.
Map that onto a voice agent and you get three layers of evidence.
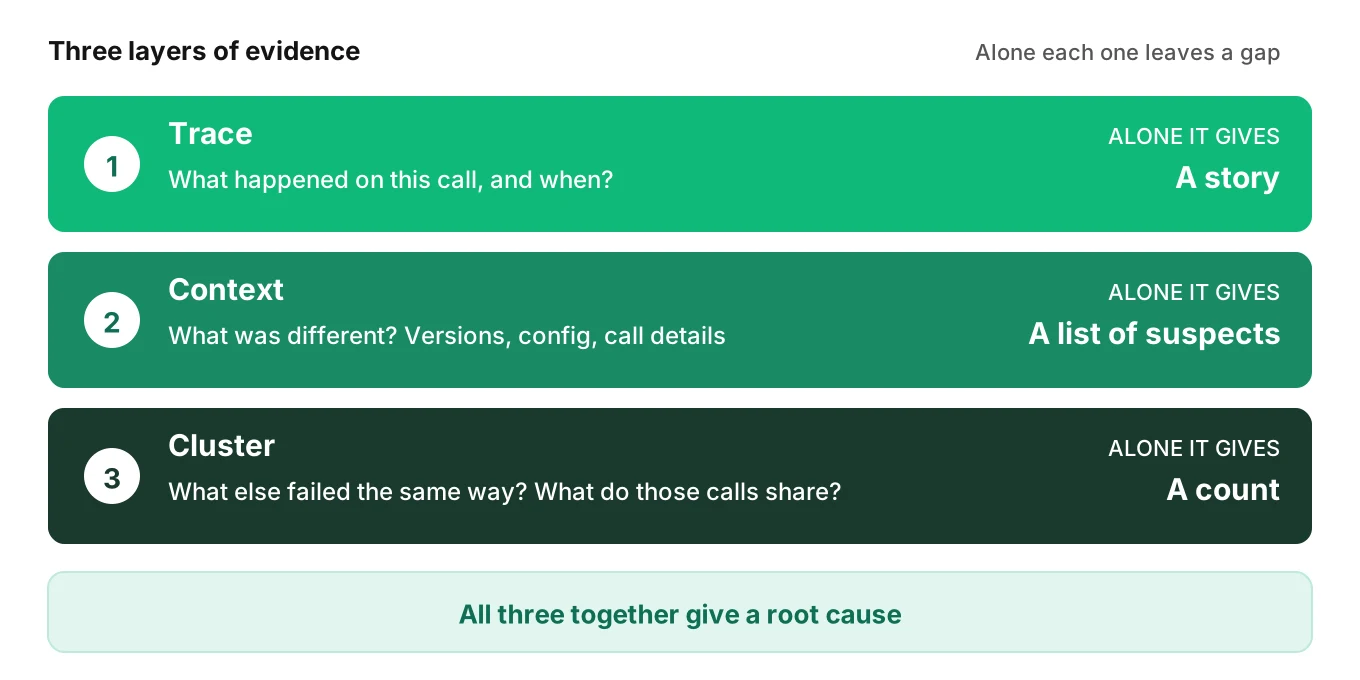
| Layer | Question it answers | Evidence | Where it comes from |
|---|---|---|---|
| Trace | What happened on this call, and when? | Spans, timings, status, tool inputs and results | Your tracing, for example OpenTelemetry |
| Context | What was different about this call? | Prompt, model and tool versions, config, caller and call details | Stamps you attach to every call |
| Cluster | What else failed the same way, and what do those calls share? | A group of failed calls and their shared attributes | Grouping many calls, not reading one |
Each layer narrows the space. The trace limits the failure to a step. Context lists what changed near that step. The cluster tests each candidate against many calls and drops the ones that do not fit.
Skip a layer and you guess. A trace with no context gives you a story. A cluster with no trace gives you a count. You need all three to get a cause. That join is what a voice agent trace root cause search really needs.
A worked example: a long pause, then a wrong answer
This example is illustrative. It is a composite built to show the method. It does not describe a real customer, and every number is an assumption.
The call
A scheduling agent handles reschedules. On one call, the caller asks to move an appointment to Tuesday. The agent says nothing for several seconds. Then it says, "I'm having trouble with that. I can note your request and someone will confirm." The caller repeats the request, then hangs up.
What the trace shows
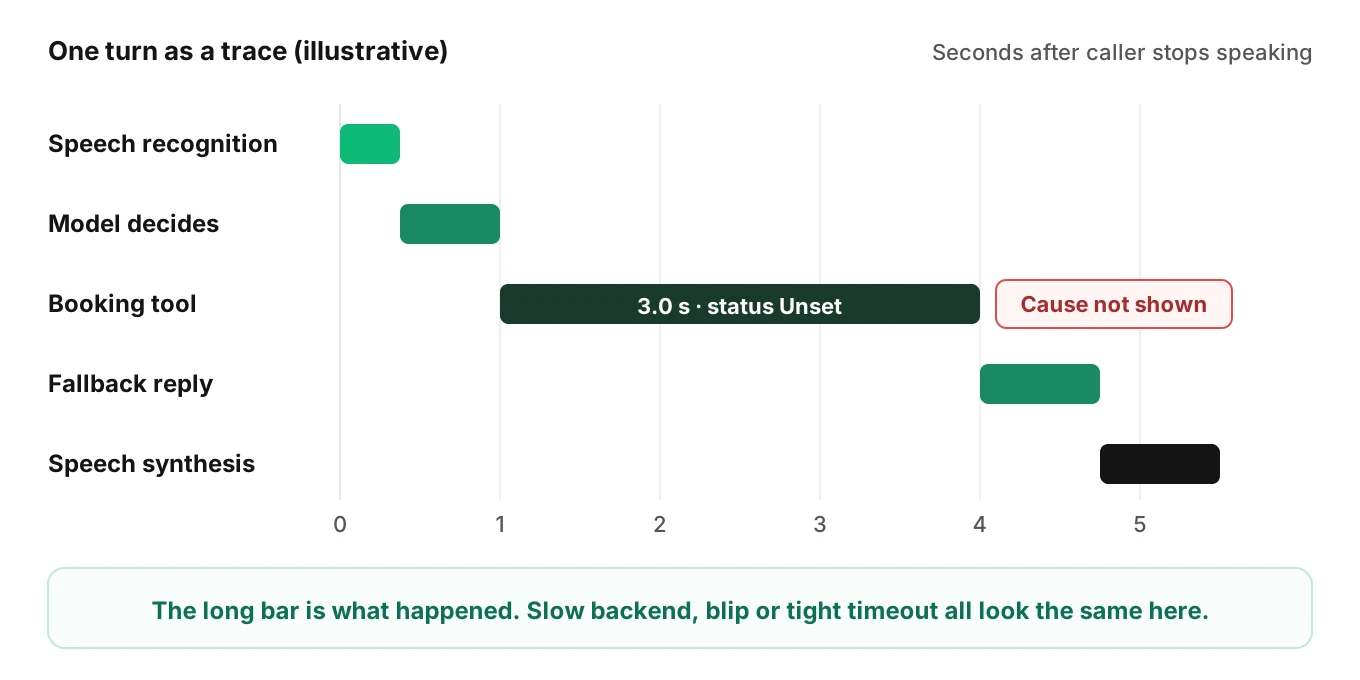
The trace for that turn, in order:
1. Speech recognition returns a final transcript quickly.
2. The model decides to call the booking tool.
3. The booking tool span runs for 3.0 seconds and ends.
4. The model produces the fallback reply.
5. Speech synthesis plays it.
The slow step is easy to see. The tool span is the long bar. That is what happened. It is not why.
Why the trace alone cannot settle it
At least three causes fit this trace.
| Candidate cause | What it predicts | What the trace shows |
|---|---|---|
| The booking backend got slow | Tool spans longer than before, ending when the backend answers | A long tool span, but not whether it finished or was cut off |
| A network or provider blip | A short cluster of slow calls, then recovery | One slow span, with no sense of time or rate |
| A tool timeout setting is too tight | Tool spans that all end at the same duration, then fallback | One span ending at 3.0 seconds, which looks like any other duration |
On one trace you cannot tell these apart. You would pick the likeliest, probably "the backend is slow," and open a ticket with the backend team. That ticket would stay open for a week. It would be the wrong ticket.
What context adds
Now add the stamps that were on the call. The agent ran release r2.14. Its tool configuration came from that release. The caller was on a standard phone call, in a normal region, at a normal time. Nothing about the caller stands out.
The release stamp is the first useful clue. The SRE book tells you to look at what changed. The release notes for r2.14 include a line: the booking tool timeout was lowered from 8 seconds to 3 seconds. The change was meant to cut dead air on slow lookups. It was in a config file, not in the prompt, so no prompt review saw it.
That is a hypothesis, not a finding. Lowering a timeout does not prove this call hit it. Correlation is not causation. The next layer tests it.
What clustering shows
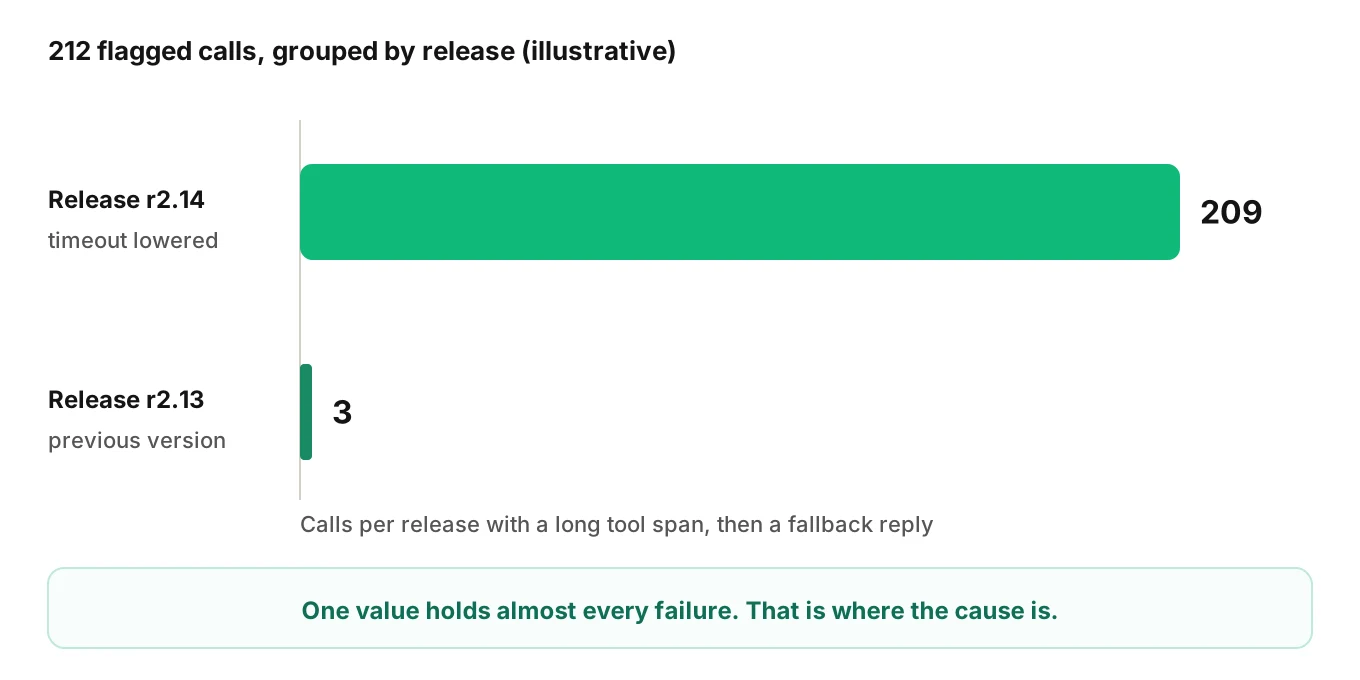
Pull every call from the past week that matches the symptom: a long tool span followed by the fallback reply. In this illustrative set, that is 212 calls. Now group them by what they share.
| Grouping | Result in the illustrative set |
|---|---|
| By release | 209 of 212 on r2.14, 3 on r2.13 |
| By tool | All 212 on the booking tool |
| By tool span end time (r2.14 group) | Nearly all end at about 3.0 s, the new cutoff |
| By backend response time, same tool, same week | Distribution unchanged from the week before |
| By caller region, device or time of day | No skew |
Read the table as a set of tests. Each candidate cause predicted something, and each prediction can now fail.
- A slow backend predicts longer backend response times. They did not change.
- A network blip predicts a short burst. The failures run across the whole week.
- A tight timeout predicts spans that end at one value and calls that cluster on one release. Both show up.
Only the timeout hypothesis survives. The 3 calls on r2.13 look like ordinary slow calls and are a separate, minor issue. That is the root cause: a timeout lowered in a release, cutting off lookups that used to finish.
The fix and the test
The fix is a decision, not a patch. Raise the timeout, or keep it and add a spoken holding line. Or return an honest "this is taking longer" instead of a fallback that sounds like failure. Either way, write a test for it. Replay the slow-lookup condition against the next release and check the outcome, not only the timing. Our production feedback loop post covers turning failed calls into regression tests.
The point of the example is the order of work. The trace found the step. The context produced the suspect. The cluster confirmed it, and ruled out the others.
Why one-call debugging stalls
Teams often debug by reading one bad call after another. It feels thorough. It has three limits.
It over-weights the vivid call. The worst-sounding call gets the most attention. It is not always the most common failure. A cluster of 212 mild failures outweighs one dramatic one.
It cannot test a cause. A single call cannot confirm that a release caused a failure. You need calls on the other side of the change. Without them, "it started after the release" stays a feeling.
It does not scale across causes. A live agent fails for many reasons at once. A single queue of bad calls mixes them. Fixing the last call you read is a random walk through that mix.
Research on LLM agents shows the same difficulty at a larger scale. Zhang and colleagues built a benchmark for automated failure attribution in multi-agent LLM systems. Their best method identified the failure-responsible agent 53.5% of the time. It pinpointed the decisive failure step 14.2% of the time. That is a different setting from a voice call, and it is one study. Still, it shows that reading a long log and naming the cause is hard, even for a strong model.
The practical lesson is to give the analysis more structure. Version stamps, shared attributes and grouping cut the search space before anyone, or any model, reads a transcript.
What context to attach to every call
You cannot cluster on data you did not keep. The context layer has to exist before the failure. Below is what to stamp, described at the level a team can act on. For field-by-field detail, see what to log on every voice agent call.
| Context | Why root cause needs it | Example question it answers |
|---|---|---|
| Release and prompt version | Failures that start at a change point to that change | Did failures rise after a given release? |
| Model and provider versions | Provider updates change behavior without your release | Did the same prompt behave differently after a model change? |
| Tool and config versions | Timeouts, retries and endpoints live in config | Which tool settings were live on this call? |
| Call details | Region, channel, language and duration shape failures | Do failures skew to one cohort? |
| How the call ended | Separates hangups, transfers and completions | Did callers hang up after the pause? |
| Link to the trace | Lets you jump from cluster to evidence | What did the slow call look like inside? |
OpenTelemetry has a home for the version stamp. Its service conventions define service.version as the version string of the service component. A resource describes the entity producing the telemetry. Version data that lives there travels with every span. Prompt and model versions need your own attributes or the GenAI conventions, which are still evolving. We cover that in OpenTelemetry for voice agents.
One caution. A stamp that exists on 80 percent of calls is a stamp that hides 20 percent. If the data is blind for some calls, the honest label is "undetermined," not a guess.
Grouping failures into causes
Clustering sounds heavy. At its simplest it is a pivot table. The skill is choosing what to group by.
Group by the step where the failure first appears
Not where it ends. A caller hangs up at the end, so "hangup" is a bad cluster key. Trace the failure back to the first step that went wrong, such as a tool span that ended early or a turn that never closed.
Group by symptom categories you can derive from trace and call data
These categories can be found from trace and call data:
- long latency on a turn
- dead air, meaning a long gap with no agent response
- unanswered callers
- the agent interrupting the caller
- the agent slow to stop talking when interrupted
- repeated tool calls
- failed steps
- the agent repeating itself
Each category is a hypothesis generator. Dead air points to a slow step or a long turn wait. Repeated tool calls point to a retry loop. Our posts on measuring latency and repetition loops go deeper on two of these.
Then split each symptom group by shared context
Split by release, tool, provider, region and call type. A cause shows as a split where one value holds almost all the failures. In the example, release did that. Region did not.
Keep the taxonomy light
A layered taxonomy helps, and the failure layer map gives one. But do not let it become the work. A short list of symptoms, split by context, beats a long label tree nobody maintains.
How to run a voice agent root cause analysis in six steps
People search "find root cause bad voice call" because the usual advice is to read the transcript. This routine works from evidence instead. It takes the trace as the start, not the answer.
1. Define the symptom in observable terms — Write what happened in words a query can match: a long gap before a fallback reply, a repeated tool call, a call that ended after a pause. Avoid causes in the symptom. "The backend is slow" is a guess. "Tool span over a few seconds, then a fallback" is a symptom.
2. Read one trace to locate the step — Open one failed call. Find the first step that went wrong, not the last thing the caller heard. Note the span, its duration and its status. This is the "where" in the SRE book's what, where and why.
3. List what changed near that step — Check release notes, prompt edits, model or provider changes, and config. Include config files and environment settings, which prompt reviews miss. Write each as a hypothesis with a prediction.
4. Find the other calls with the same symptom — Query for calls that match step one's symptom and step two's location. Do not stop at five. You need enough calls to see which attributes they share.
5. Group and test each hypothesis against the group — Split the group by release, tool, provider, region and call type. Ask what each hypothesis predicts. Drop the ones the data contradicts. Keep the one that explains most calls, and label the rest "other" or "undetermined."
6. Fix, then turn the failure into a test — Make the change. Write a scenario that reproduces the condition. Run it before the next release and after it. Then watch the cluster shrink in production.
Two habits keep this honest. Order your hypotheses by likelihood and test the simplest first, as the SRE book advises. And write down what you could not determine. A report that says "undetermined for 14 calls, no version stamp" is more useful than one that quietly absorbs them.
Common mistakes in voice agent failure analysis
- Treating span status as truth. A healthy status does not mean the caller was helped.
- Debugging the last call. The cause may sit three steps earlier.
- Blaming the biggest dependency first. Slow backend is a popular guess. Config and release are cheaper to check.
- Reading transcripts instead of counting. Transcripts give color. Counts give causes.
- Fixing without a test. The cluster comes back with the next release.
- Hiding the blind spots. Calls without version stamps belong in a visible "undetermined" bucket.
The AAIF's voice agent failure series makes a related point on latency. It advises tracking tail response times and attributing the slow interactions to individual stages. That is step two of the routine, applied to latency.
Where Evalgent fits
Evalgent is a testing, evaluation and monitoring platform for voice agents. Its production call monitoring flags problems such as tool-call failures and latency spikes, with fix recommendations. Evalgent Observe, which is launching, is aimed at the gap this post describes. It traces each failure to the step or handoff that caused it, and it clusters failures into root causes, so a team fixes causes instead of single calls.
Observe works with any stack. It ingests data in OpenTelemetry format, so you do not have to change your voice platform. Where the data you supply cannot support a verdict, it says "undetermined" and shows the coverage gap instead of hiding it. Evalgent does not sit in the media path, so nothing touches live audio or slows a call. Native connectors for ElevenLabs, Vapi and Retell are planned. Today those stacks connect through OpenTelemetry and an upload path for call details.
Even without any tool, the routine above works. For the alerting side, see monitoring voice agents in production. The tool saves the grouping work. It does not replace the habit of asking what changed.
Frequently asked questions
What is voice agent root cause analysis?
Voice agent root cause analysis is the process of finding the single change or condition behind a class of failed calls. It starts from one trace, adds context such as release and config versions, and groups similar failures. The goal is a fix for the cause, not for each call.
Why did the voice agent fail on this call?
Start with the trace to find the first step that went wrong. Then check what changed near that step: prompt, model, tool config or release. Finally find other calls with the same symptom and see what they share. One call rarely proves a cause. A group of calls can.
Can a trace show the root cause of a failure?
A trace shows the sequence and timing of one call, so it locates the failing step. It rarely shows why that step failed. Many causes produce the same slow span or fallback. You need version context and similar calls to tell them apart.
How do I find the root cause of a bad voice call?
Define the symptom, read one trace to find the step, and list recent changes. Then query other calls with the same symptom. Split them by release, tool, provider and region. The hypothesis that explains most of them is your leading cause. Fix it and add a test.
What context should a voice agent trace carry?
It should carry release and prompt version, model and provider versions, tool and config versions, call details such as region and channel, and how the call ended. Add a link from each call record to its trace. Without these, you cannot group failures by cause.
How do you group voice agent failures into root causes?
Pick a symptom, such as dead air or repeated tool calls. Trace each call to the first failing step. Then split the group by shared context: release, tool, provider, region, call type. A cause shows up as one value holding most of the failures. Label leftovers "undetermined."
Is voice agent failure analysis the same as monitoring?
No. Monitoring watches known indicators and alerts when they move. Failure analysis explains why a specific group of calls failed, including causes you did not plan for. Honeycomb's observability manifesto describes monitoring as being about known-unknowns. Root cause work handles the unknowns.
Do I need OpenTelemetry for root cause analysis?
No, but it helps. OpenTelemetry gives you a common span format and a place to put version attributes. You can run the six-step routine on any structured call logs that include timings, versions and outcomes. Standard formats make it easier to move between tools.
The bottom line
A trace shows what happened on one call, and that is rarely the same as why the call failed. Root cause comes from the trace plus the versions and call details around it, tested against other calls that failed the same way.
Related Articles

How to automate voice agent testing: synthetic callers vs manual QA
Learn how ai test automation replaces manual QA for voice agents. Compare synthetic callers vs human testers, with a 5-step framework to scale without hiring.
Read more
AI Agent Testing vs Voice Agent Testing: What General Tools Miss for Voice
AI agent testing measures text outputs. Voice agent testing measures behaviour through an acoustic pipeline. Five failure categories general tools miss.
Read more