Open door for builders.
How to Benchmark LiveKit vs Pipecat on Your Own Workload
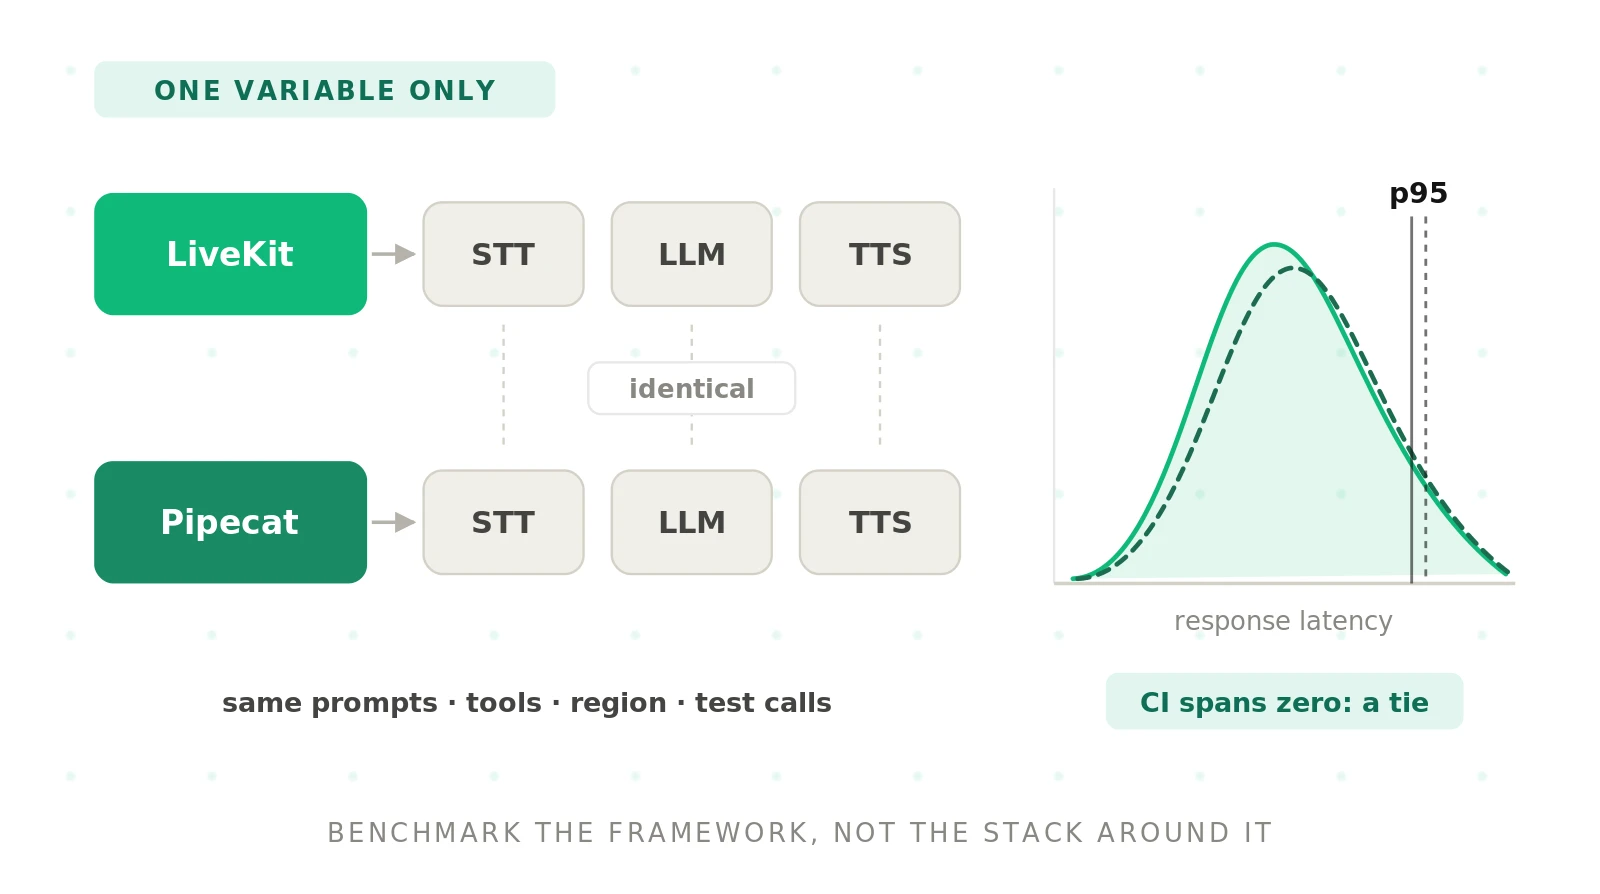
Most "LiveKit vs Pipecat" latency numbers are not wrong. They are just not about you.
A published figure measured one stack, in one region, on one network, with one prompt. Change any of those and the number moves more than the framework does. This guide is the bake-off playbook we would run ourselves. It covers what to hold constant, what to measure, how to instrument both frameworks with their real hooks, and how to tell a real gap from noise.
If you need the architecture comparison first, start with the Pipecat vs LiveKit hub. This post assumes you have a shortlist and want evidence.
Why generic LiveKit vs Pipecat benchmarks mislead
Published comparisons tend to report end-to-end latency somewhere around 750 to 950 ms for both frameworks. Both communities aim for roughly 300 ms of processing that feels conversational. Those ranges overlap almost completely. That overlap is the real finding.
The reason is simple. In a cascaded voice agent, the framework is a thin layer. Most of each turn's time goes to things the framework does not own.
| Confounder | Why it moves the number | Typical size of the effect |
|---|---|---|
| STT provider and model | Final-transcript timing varies by vendor and endpointing mode | Large |
| LLM and prompt length | Time to first token grows with context and model choice | Largest |
| TTS provider and voice | Time to first byte and leading silence vary | Medium |
| Region and network path | Every hop between caller, media server, and model APIs adds delay | Medium to large |
| Transport | WebRTC, SIP, and WebSocket media streams buffer differently | Medium |
| Turn-detection settings | Silence timeouts add delay on every single turn | Large |
| Load and warm state | Cold processes and saturated CPUs inflate tails | Large at p99 |
A benchmark that changes two of these at once cannot attribute the difference to the framework. Many public comparisons change four or five.
There is a second problem. Each framework measures latency with its own clock and its own definition of "user stopped speaking." LiveKit's `e2e_latency` and Pipecat's `UserBotLatencyObserver` are both useful. But they anchor on different internal events. Comparing one framework's native number against the other's is comparing two rulers. We cover the fix in the instrumentation section below.
What a fair framework benchmark holds constant
Fair framework benchmark: a controlled test in which STT, LLM, TTS, prompts, tools, region, network, and test calls are identical across arms, and only the orchestration framework changes.
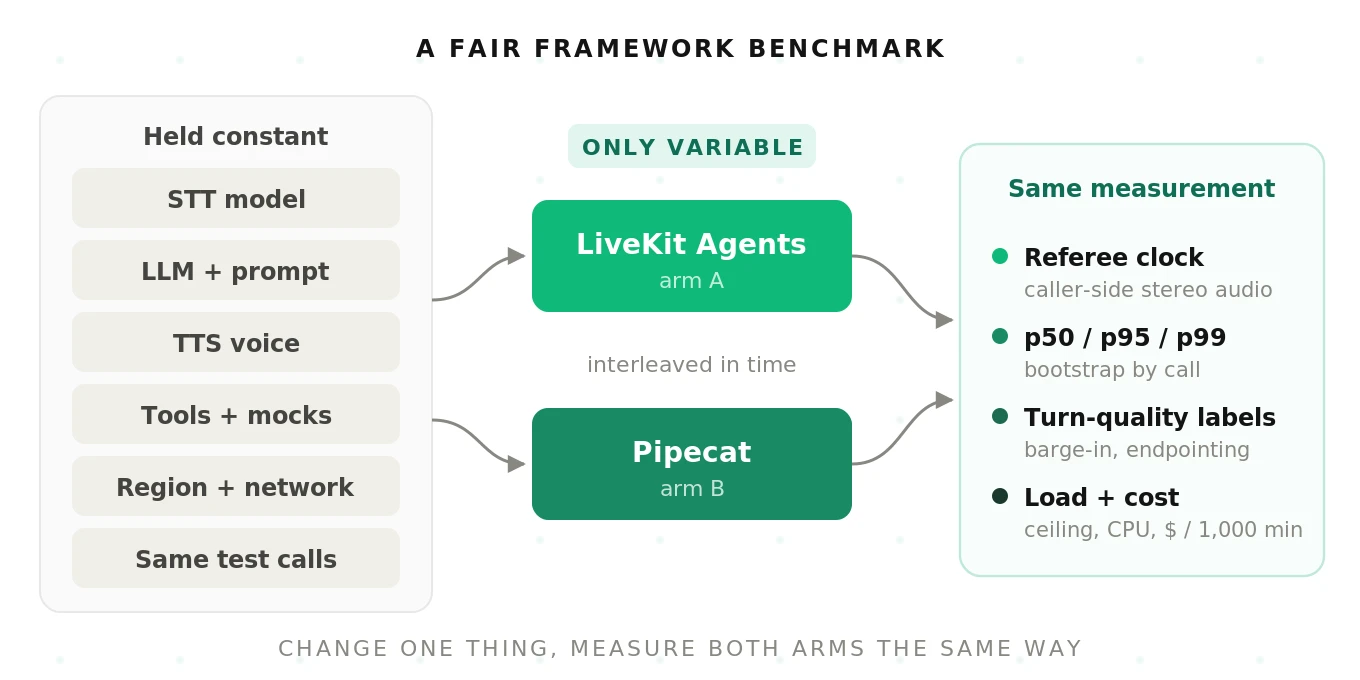
Pin these before you run a single call:
- Providers and models. Same STT model, LLM model and version, and TTS voice. Same API regions.
- Prompts and tools. Byte-identical system prompt. Same tool schemas. Same mock backends with fixed response times.
- Compute. Same instance type, CPU limits, and container image base. Same number of prewarmed workers.
- Region and network. Agents, media, and callers in the same cloud region. Same egress path to model APIs.
- Turn-detection intent. Tune each framework to a documented target, such as "respond within 600 ms of a complete thought." Record every parameter.
- Versions. Pin framework and plugin versions. Both projects ship often. Pipecat renamed `PipelineTask` to `PipelineWorker` in its 1.3.0 release. LiveKit Agents 1.7.0 renamed a dozen span attributes. A mid-benchmark upgrade silently changes your data.
Pick one of two benchmark designs
There are two honest questions you can ask. Pick one per run.
Orchestration-only benchmark: both frameworks share one transport, so only pipeline orchestration differs. Pipecat can run on a LiveKit transport, which makes this possible. See using LiveKit and Pipecat together.
Full-stack benchmark: each framework runs on its natural transport and telephony path. This answers "which complete stack serves my callers better." Transport and SIP differences are part of the result, not noise. The telephony comparison covers those paths.
Label your report with the design you used. Mixing the two is the most common way bake-offs go wrong.
The metrics to capture, defined precisely
Vague metric names cause most benchmark arguments. Define each metric by its start event, its stop event, and who measures it.
| Metric | Precise definition | Measured by |
|---|---|---|
| End-to-end response latency | Caller's last voiced audio frame to the agent's first voiced audio frame, at the caller | External recorder |
| STT final delay | End of user speech to final transcript | Framework hooks |
| Turn-detection delay | End of user speech to the end-of-turn decision | Framework hooks |
| LLM TTFT | LLM request sent to first token received | Framework hooks |
| TTS TTFB | First text sent to TTS to first audio byte back | Framework hooks |
| Barge-in stop latency | Onset of caller's interrupting speech to agent audio stopping, at the caller | External recorder |
| False-interruption rate | Share of agent utterances cut off by noise, coughs, or backchannels | Labeled recordings |
| Premature endpointing rate | Share of user turns where the agent spoke before the caller finished | Labeled recordings |
| Turn-detection accuracy | Share of end-of-turn decisions that match human labels | Labeled recordings |
| Dropped-call and cold-start rate | Calls that fail to connect, or wait over a set threshold for first greeting | Test harness |
| Concurrency ceiling | Highest concurrent sessions before p95 or failure rate breaches your target | Load test |
| CPU and memory per session | Steady-state resource use per active call at fixed load | Host metrics |
| Cost per 1,000 minutes | Total infrastructure plus provider spend, normalized to 1,000 call minutes | Invoices and usage |
| Task success and WER | Did the caller's goal complete? How accurate were transcripts? | Scoring rubric |
Report every latency metric as p50, p95, and p99. Averages hide exactly the turns callers remember. A voice agent with a 700 ms median and a 2.4 s p99 feels broken on one turn in a hundred. Our latency guide explains why tails dominate perceived quality.
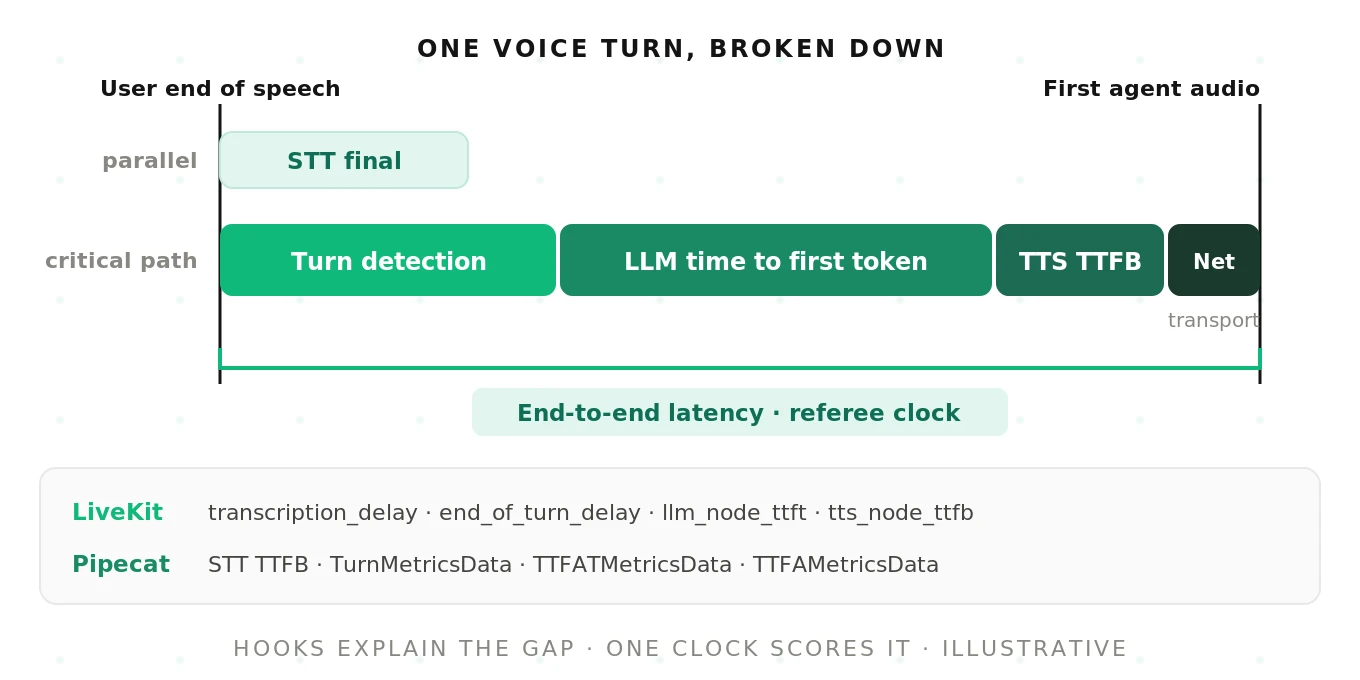
End-to-end response latency: the gap a caller hears between finishing a sentence and hearing the agent begin to answer, measured from recorded audio rather than from inside either framework.
False interruption: an event where the agent stops or yields its speech even though the caller did not intend to take the turn.
The last four rows of the table matter as much as latency. A framework that answers 80 ms faster but cuts callers off twice as often is not faster in any useful sense. See endpointing and barge-in for how these failures feel on a real call.
Instrumenting LiveKit Agents
LiveKit Agents exposes metrics at four scopes, per its data hooks documentation. Per-plugin `metrics_collected` events cover single STT, LLM, TTS, or VAD calls. `ChatMessage.metrics` carries per-turn latency. The `session_usage_updated` event and `session.usage` carry cumulative usage. `ctx.make_session_report()` produces an end-of-session snapshot.
For a benchmark, per-turn metrics are the most useful. User messages carry `transcription_delay` and `end_of_turn_delay`. Assistant messages carry `llm_node_ttft`, `tts_node_ttfb`, and `e2e_latency`. Note that the session-level `metrics_collected` event is now deprecated in favor of these.
Interruption behavior has its own events. The turns documentation describes `user_interruption_detected` and `agent_false_interruption`. The second fires when an interruption produces no transcribed speech within `false_interruption_timeout`.
# Simplified LiveKit Agents hooks for a benchmark run.
# Verify event and field names against your pinned version.
import json, time
from livekit.agents import ConversationItemAddedEvent, SessionUsageUpdatedEvent
from livekit.agents.llm import ChatMessage

def attach_benchmark_hooks(session, call_id, sink):
    def emit(kind, **fields):
        sink.write(json.dumps({"framework": "livekit", "call_id": call_id,
                               "kind": kind, "wall_ms": time.time() * 1000,
                               **fields}) + "\n")

    @session.on("conversation_item_added")
    def _turn(ev: ConversationItemAddedEvent):
        if not isinstance(ev.item, ChatMessage):
            return
        m = ev.item.metrics or {}
        if ev.item.role == "user":
            emit("user_turn",
                 stt_final_s=m.get("transcription_delay"),
                 eot_delay_s=m.get("end_of_turn_delay"))
        elif ev.item.role == "assistant":
            emit("agent_turn",
                 llm_ttft_s=m.get("llm_node_ttft"),
                 tts_ttfb_s=m.get("tts_node_ttfb"),
                 native_e2e_s=m.get("e2e_latency"))

    @session.on("user_interruption_detected")
    def _interrupt(ev):
        emit("interruption", probability=getattr(ev, "probability", None))

    @session.on("agent_false_interruption")
    def _false_interrupt(ev):
        emit("false_interruption")

    @session.on("session_usage_updated")
    def _usage(ev: SessionUsageUpdatedEvent):
        for u in ev.usage.model_usage:
            emit("usage", provider=u.provider, model=u.model)
Two LiveKit details change benchmark results. First, the framework runs each job in its own process and keeps a pool of idle, prewarmed processes, per its server options. Cold-start numbers depend on that pool size. Second, the default load function is average CPU over five seconds, with a default threshold of 0.7. Above that, the server stops accepting new jobs. Your "concurrency ceiling" may simply be that threshold. Record it.
For a deeper LiveKit test plan, see the LiveKit voice agent testing guide.
Instrumenting Pipecat
Pipecat emits a `MetricsFrame` for each interaction when you set `enable_metrics=True`, per its metrics guide. Metric types include `TTFBMetricsData`, `TTFAMetricsData` for TTS time to first audio, `TTFATMetricsData` for LLM time to first answer token, and `TurnMetricsData` from turn analyzers such as Smart Turn.
Observers are the cleaner hook for a benchmark. `UserBotLatencyObserver` reports user-to-bot latency. `TurnTrackingObserver` reports turn start and end, including whether the turn was interrupted. `ServiceMetricsObserver` reports each service latency as a structured record.
# Simplified Pipecat hooks for a benchmark run (Pipecat 1.3+ naming).
# Older releases use PipelineTask / PipelineRunner instead.
import json, time
from pipecat.pipeline.worker import PipelineWorker, PipelineParams
from pipecat.observers.user_bot_latency_observer import UserBotLatencyObserver
from pipecat.observers.turn_tracking_observer import TurnTrackingObserver
from pipecat.observers.service_metrics_observer import ServiceMetricsObserver

def build_worker(pipeline, call_id, sink):
    def emit(kind, **fields):
        sink.write(json.dumps({"framework": "pipecat", "call_id": call_id,
                               "kind": kind, "wall_ms": time.time() * 1000,
                               **fields}) + "\n")

    latency = UserBotLatencyObserver()
    turns = TurnTrackingObserver(turn_end_timeout_secs=2.5)
    services = ServiceMetricsObserver()

    @latency.event_handler("on_latency_measured")
    async def _lat(observer, seconds):
        emit("agent_turn", native_e2e_s=seconds)

    @turns.event_handler("on_turn_ended")
    async def _turn(observer, turn_count, duration, was_interrupted):
        emit("turn_end", turn=turn_count, interrupted=was_interrupted)

    @services.event_handler("on_service_latency")
    async def _svc(observer, record):
        emit("service_latency", stage=record.kind,
             seconds=record.seconds, processor=record.processor)

    return PipelineWorker(
        pipeline,
        params=PipelineParams(enable_metrics=True, enable_usage_metrics=True),
        observers=[latency, turns, services],
        enable_tracing=True,
        enable_turn_tracking=True,
        conversation_id=call_id,
    )
One Pipecat caveat matters for benchmarks. `UserBotLatencyObserver` anchors on the VAD's stop event. Maintainers confirmed in issue #5311 that turns started without a VAD event produce no latency sample, by design. A soft-spoken caller whose speech the STT catches but VAD misses simply vanishes from the native number. That is a defensible engineering choice. It also means native coverage can differ between frameworks. Count turns, not just latencies.
For the full Pipecat test plan, see the Pipecat voice agent testing guide.
One schema and one referee clock for both
Native hooks explain where time goes. They should not decide who is faster. For that you need a single referee clock outside both frameworks.
The referee is simple. Record every test call as stereo audio at the caller side: caller on one channel, agent on the other. Run the same energy-based voice detector over both channels. Derive end-of-speech, first agent audio, and barge-in stop times from that recording. Both frameworks get measured by the same ruler.
Both frameworks also export OpenTelemetry traces. Pipecat's tracing setup builds conversation, turn, and service spans. LiveKit's OpenTelemetry traces use `lk.*` attributes plus the GenAI semantic conventions. Send both to one collector. Then normalize every turn into one shared record.
# Normalized turn record, one per user turn, identical for both arms
turn_record:
  framework: livekit | pipecat
  design: orchestration_only | full_stack
  call_id: string
  turn: int
  scenario_id: string            # from the test set
  # referee clock (caller-side stereo recording), epoch ms
  user_eos_ms: int
  agent_first_audio_ms: int | null
  barge_in_onset_ms: int | null
  agent_audio_stop_ms: int | null
  # native breakdown (framework hooks), seconds
  stt_final_s: float | null
  eot_delay_s: float | null
  llm_ttft_s: float | null
  tts_ttfb_s: float | null
  # labels (human or rubric), booleans
  false_interruption: bool
  premature_endpoint: bool
  task_success: bool | null
Our OpenTelemetry guide for voice agents covers collector setup and span naming in more depth.
Designing the test set
The test set is the benchmark. A weak one produces a confident, useless result.
Build scripted caller scenarios that mirror your real traffic. Each scenario defines a persona, a goal, audio conditions, and the specific stress it applies.
| Scenario family | What it stresses | Example |
|---|---|---|
| Clean baseline | Raw pipeline latency | Clear speaker, quiet room, simple question |
| Accents and speech rate | STT accuracy and endpointing | Fast speaker, strong regional accent |
| Background noise | VAD and false interruptions | TV, café, street, car cabin at set SNR levels |
| Mid-sentence pauses | Premature endpointing | "My account number is... hold on... 4417" |
| Deliberate barge-in | Stop latency and recovery | Caller interrupts one second into a long answer |
| Backchannels | False interruptions | "Mm-hm," "right," "okay" during agent speech |
| DTMF and digits | Telephony path and entity capture | Keypad entry of an account number |
| Long silence | Timeouts and re-prompts | Caller goes quiet for eight seconds |
| Tool-heavy turns | LLM and tool latency | Lookup that calls two backend tools |
Use the noise robustness guide to set realistic noise levels. Use fixed seeds and pre-rendered audio so both arms hear the same bytes.
# One scenario definition (illustrative)
id: pause-account-number-noisy-01
persona: {accent: en-US-southern, rate_wpm: 170}
audio: {channel: pstn_8khz, noise: cafe, snr_db: 10}
script:
  - say: "Hi, I need to check a charge on my card."
  - say: "The last four are..."
  - pause_ms: 1400            # tests premature endpointing
  - say: "four four one seven."
  - barge_in_after_ms: 900    # interrupt the agent's next answer
    say: "Sorry, it was the one from Tuesday."
expect:
  task: identify_disputed_charge
  must_not: [speak_during_pause]
Synthetic callers vs real PSTN calls
Use both, in a ratio you document.
Synthetic callers give you control. Every arm hears the same audio, with the same pauses, at the same moments. They are ideal for latency and turn-behavior metrics. Run them over the real transport, not a local loopback, or you will miss network effects.
Real PSTN calls give you truth. Carrier codecs, jitter, and handset audio behave differently from clean WebRTC. Route a smaller share of calls through real phone numbers into both arms. A common split is roughly 80% synthetic and 20% PSTN. Treat that as a starting point, not a rule. The SIP vs WebRTC guide explains why the phone path changes results.
For concurrency, drive load in steps. Hold each step long enough for p95 to stabilize. The stress testing guide and the LiveKit vs Pipecat scaling comparison cover ramp design.
How many calls you need
Sample size is where most bake-offs fail quietly. Too few calls and random variation looks like a winner.
For latency percentiles, the tail needs data. A p95 from 100 turns rests on five data points. Aim for at least 400 to 600 turns per arm per condition for p95. Aim for 1,000 or more for p99.
For rates, the math is less forgiving. Suppose you want to detect a false-interruption rate of 4% versus 6%. A standard two-proportion power calculation, at 95% confidence and 80% power, needs about 1,860 turns per arm. Smaller gaps need far more.
Turns inside one call are correlated. The same caller, line, and context repeat. So resample whole calls, not individual turns, when you compute confidence intervals. Also interleave arms in time. Run LiveKit and Pipecat calls alternately, not one arm on Monday and the other on Tuesday. Model API latency drifts across a day.
Computing p50, p95, and p99 and the comparison
This script reads normalized turn records and computes percentiles and error rates for each framework. It then builds a bootstrap confidence interval for the p95 difference, resampling by call.
import json, math, random
from collections import defaultdict

def pct(values, q):
    """Nearest-rank percentile, q in (0, 100]."""
    s = sorted(values)
    return s[max(0, math.ceil(q / 100 * len(s)) - 1)]

def latencies(calls):
    # User end-of-speech -> first agent audio, per turn, in ms.
    return [t["agent_first_audio_ms"] - t["user_eos_ms"]
            for turns in calls.values() for t in turns
            if t.get("agent_first_audio_ms") is not None]

def rate(calls, key):
    rows = [t for turns in calls.values() for t in turns]
    return sum(bool(t[key]) for t in rows) / len(rows)

def boot_ci(a, b, q=95, n=2000, seed=7):
    """95% CI for pct(b) - pct(a). Resamples whole calls, not turns,
    because turns inside one call are correlated."""
    rng = random.Random(seed)
    ka, kb, diffs = list(a), list(b), []
    for _ in range(n):
        ra = {i: a[rng.choice(ka)] for i in range(len(ka))}
        rb = {i: b[rng.choice(kb)] for i in range(len(kb))}
        diffs.append(pct(latencies(rb), q) - pct(latencies(ra), q))
    diffs.sort()
    return diffs[int(0.025 * n)], diffs[int(0.975 * n)]

# turns.jsonl: one normalized turn record per line (schema above)
data = defaultdict(lambda: defaultdict(list))
with open("turns.jsonl") as f:
    for line in f:
        t = json.loads(line)
        data[t["framework"]][t["call_id"]].append(t)

for fw in ("livekit", "pipecat"):
    lat = latencies(data[fw])
    print(f"{fw:8} turns={len(lat):4}  p50={pct(lat, 50):4.0f}  "
          f"p95={pct(lat, 95):5.0f}  p99={pct(lat, 99):5.0f}  "
          f"false_int={rate(data[fw], 'false_interruption'):.1%}  "
          f"premature_eot={rate(data[fw], 'premature_endpoint'):.1%}")

lk, pc = data["livekit"], data["pipecat"]
diff = pct(latencies(pc), 95) - pct(latencies(lk), 95)
lo, hi = boot_ci(lk, pc)
print(f"p95 diff (pipecat - livekit): {diff:+.0f} ms, 95% CI [{lo:+.0f}, {hi:+.0f}]")
print("verdict:", "not distinguishable" if lo <= 0 <= hi else "real difference")
Sample output on synthetic, illustrative data (600 turns per arm):
livekit  turns= 600  p50= 815  p95= 1225  p99= 1380  false_int=3.8%  premature_eot=7.0%
pipecat  turns= 600  p50= 862  p95= 1243  p99= 1414  false_int=3.5%  premature_eot=4.8%
p95 diff (pipecat - livekit): +18 ms, 95% CI [-31, +81]
verdict: not distinguishable
Look at that output closely. The medians differ by 47 ms. A chart would make that look like a winner. The confidence interval says otherwise. The two arms cannot be told apart at p95. This is the most common honest result of a well-run framework benchmark.
A results table template
Report every metric side by side, with sample sizes and intervals. The numbers below are illustrative only. They show format, not a real result.
| Metric (illustrative) | LiveKit arm | Pipecat arm | Read |
|---|---|---|---|
| E2E latency p50 / p95 / p99 (ms) | 815 / 1,225 / 1,380 | 862 / 1,243 / 1,414 | Tie at p95 (CI spans 0) |
| LLM TTFT p95 (ms) | 540 | 545 | Tie (same model) |
| Barge-in stop latency p95 (ms) | 310 | 350 | Needs more data |
| False-interruption rate | 3.8% | 3.5% | Tie |
| Premature endpointing rate | 7.0% | 4.8% | Worth a tuning pass |
| Turn-detection accuracy | 91% | 93% | Tie |
| Cold-start rate (>3 s greeting) | 0.4% | 1.1% | Depends on warm pool |
| Concurrency ceiling per host | 38 | 44 | Check load thresholds |
| CPU per session (vCPU) | 0.21 | 0.18 | Within noise |
| Cost per 1,000 min (USD) | Your invoice | Your invoice | Mostly provider spend |
| Task success / WER | 86% / 9.1% | 87% / 9.0% | Tie (same STT) |
Notice the pattern in the "Read" column. Most rows are ties, because the heavy components are identical. The rows that differ are usually tunable settings, such as endpointing delay or warm-pool size. A good report says so rather than declaring a winner.
For cost, compute the full stack per 1,000 minutes from your own invoices and usage exports. Provider spend for STT, LLM, and TTS is identical by design, so the framework mostly moves hosting, media, and telephony. Check current pricing on each vendor's page, and date it. Our cost per resolution guide shows why cost per resolved call beats cost per minute.
Failure modes that invalidate a benchmark
We see the same mistakes again and again. Each one can flip a result.
1. Comparing native latency numbers. Each framework anchors "end of speech" differently. Use the referee clock.
2. Different endpointing settings. A 300 ms silence timeout against an 800 ms one is a settings test, not a framework test.
3. Mismatched warm state. One arm has prewarmed processes, the other cold-starts every call.
4. Sequential arms. Running arms hours apart captures model API drift, not framework differences.
5. Loopback-only testing. Local audio skips jitter buffers, codecs, and carrier effects.
6. Undercounted turns. Native observers can skip turns they cannot measure. Pipecat's issue #5921 shows how early STT results can drop stages from a breakdown.
7. Unpinned versions. A mid-run upgrade renames attributes or changes defaults.
8. Latency-only scoring. Speed without turn quality rewards the agent that interrupts callers.
The open-source voice-rtc-bench project notes a practical trap. Its author found that Pipecat's Daily SDK and LiveKit's Python SDK could not share one process, so each arm ran separately. Plan for separate processes and identical host specs from day one.
How to run a fair LiveKit vs Pipecat benchmark
1. Write the question down. Choose orchestration-only or full-stack. Name the decision the result will drive.
2. Freeze the stack. Pin STT, LLM, TTS, prompts, tools, mock backends, region, instance type, and framework versions in one config file.
3. Set a common tuning target. Tune each framework's turn detection to the same documented behavior. Record every parameter.
4. Build the test set. Script 30 to 60 scenarios across clean, accented, noisy, pause, barge-in, backchannel, DTMF, silence, and tool-heavy families.
5. Render audio once. Pre-render every caller utterance with fixed seeds so both arms hear identical bytes.
6. Instrument both arms. Attach native hooks for breakdowns. Export OpenTelemetry traces to one collector.
7. Add the referee clock. Record caller-side stereo audio and derive latency and barge-in timing from it.
8. Interleave and scale. Alternate arms in time. Mix synthetic and PSTN calls. Run enough turns for your target percentiles and rates.
9. Label turn quality. Mark false interruptions, premature endpoints, and task outcomes with a written rubric.
10. Analyze with intervals. Compute p50, p95, and p99 and rates per arm. Bootstrap by call. Treat overlapping intervals as ties.
11. Load-test separately. Step concurrency until p95 or failure rate breaches target. Record CPU and memory per session.
12. Publish the full method. Share configs, versions, scenario list, sample sizes, and raw turn records with the result.
The voice agent POC bake-off guide covers scheduling and stakeholder sign-off around these steps.
Why an independent party should run it
There is one more confounder we have not named. It is you.
The team running a bake-off usually knows one framework better. They tune it harder. They debug its failures faster. Nobody intends bias, but the familiar arm tends to win. The result is then hard to defend to a CTO, a procurement lead, or a skeptical engineer on the other side.
This is where independent evaluation earns its keep. Evalgent runs the identical test suite against both stacks. The same scenarios, the same referee clock, the same labeling rubric, the same statistics. We have no stake in which framework you pick. We care that the result holds up. The approach mirrors how we compare voice agents on the same test cases. It is also why independent voice AI evaluation exists as a category.
Neither framework tells you when silence detection misfires, an interruption fires wrongly, latency spikes mid-call, or quality degrades on a noisy line. A benchmark catches those once. Evaluation keeps catching them after launch.
Frequently asked questions
How do you benchmark LiveKit vs Pipecat fairly?
A fair LiveKit vs Pipecat benchmark changes only the framework. Keep STT, LLM, TTS, prompts, tools, region, network, compute, and test calls identical. Tune turn detection in both to the same documented target. Measure latency from caller-side recordings, not from each framework's own metrics. Run enough interleaved calls to compute confidence intervals, and treat overlapping results as ties.
Which is faster, LiveKit or Pipecat?
Neither LiveKit nor Pipecat is reliably faster in general. Public comparisons report overlapping end-to-end ranges of roughly 750 to 950 ms for both. Most turn latency comes from STT, the LLM, TTS, network, and endpointing settings, which the framework does not own. On your own stack, the gap is often within noise. Benchmark to find out.
What metrics should a voice agent framework benchmark measure?
A voice agent framework benchmark should measure end-to-end response latency at p50, p95, and p99. It should break down STT final delay, turn-detection delay, LLM time to first token, and TTS time to first byte. It should also measure barge-in stop latency, false interruptions, premature endpointing, cold starts, concurrency ceiling, resource use, cost, and task success.
How many test calls do you need to compare voice agent frameworks?
Comparing voice agent frameworks needs more calls than most teams expect. Plan on 400 to 600 turns per arm for a stable p95, and 1,000 or more for p99. Detecting a two-point gap in an error rate, such as 4% versus 6%, needs roughly 1,860 turns per arm. Resample by call when computing intervals.
Can you trust published LiveKit vs Pipecat latency numbers?
Published LiveKit vs Pipecat latency numbers are useful as rough ranges, not as decisions. Each test used its own providers, region, network, prompts, and settings, and often changed several at once. Each framework also defines "end of speech" with its own internal clock. Treat published figures as a hypothesis and confirm them on your own workload.
How do you measure barge-in latency on a voice agent?
Barge-in latency is the time from the onset of a caller's interrupting speech to the moment the agent's audio stops. Measure it from a caller-side stereo recording, with the caller and agent on separate channels. Run the same voice detector over both channels. Native framework events help explain delays but should not be the referee.
Should you benchmark with synthetic callers or real phone calls?
A voice agent benchmark should use both synthetic callers and real phone calls. Synthetic callers give identical, repeatable audio for latency and turn-behavior metrics. Real PSTN calls expose carrier codecs, jitter, and handset audio that synthetic tests miss. A common starting mix is about 80% synthetic and 20% PSTN, adjusted to your traffic.
How do you instrument LiveKit and Pipecat with OpenTelemetry?
LiveKit Agents exports session traces after you set a tracer provider with `set_tracer_provider`. Pipecat exports conversation, turn, and service spans after `setup_tracing()` and `enable_tracing=True` on the pipeline worker. Send both to one OTLP collector. Normalize turns into a shared schema so both frameworks report the same fields.
The bottom line
A fair LiveKit vs Pipecat benchmark changes only the framework and measures both arms with one external clock. On identical providers, most metrics come out as ties, and the real differences usually trace back to tunable settings and operational fit.
Want a result your whole team will trust? Book a demo and let Evalgent run the same test suite on both stacks, independently.
Related Articles
Why AI voice agents fail in production: 9 failure layers, how to detect each, and how to prevent them
Voice agents fail in production across 9 layers, from 8 kHz audio to silent tool errors. Symptoms, root causes, alerts, and fixes in one master table.
Read more
Voice agent regression testing: why LLM updates break production
LLM updates improve benchmarks but break voice agents in 5 predictable ways. How to detect and prevent regressions after every model or prompt change.
Read more