Open door for builders.
LiveKit vs Pipecat at Scale: Concurrency, Workers, and Production Load
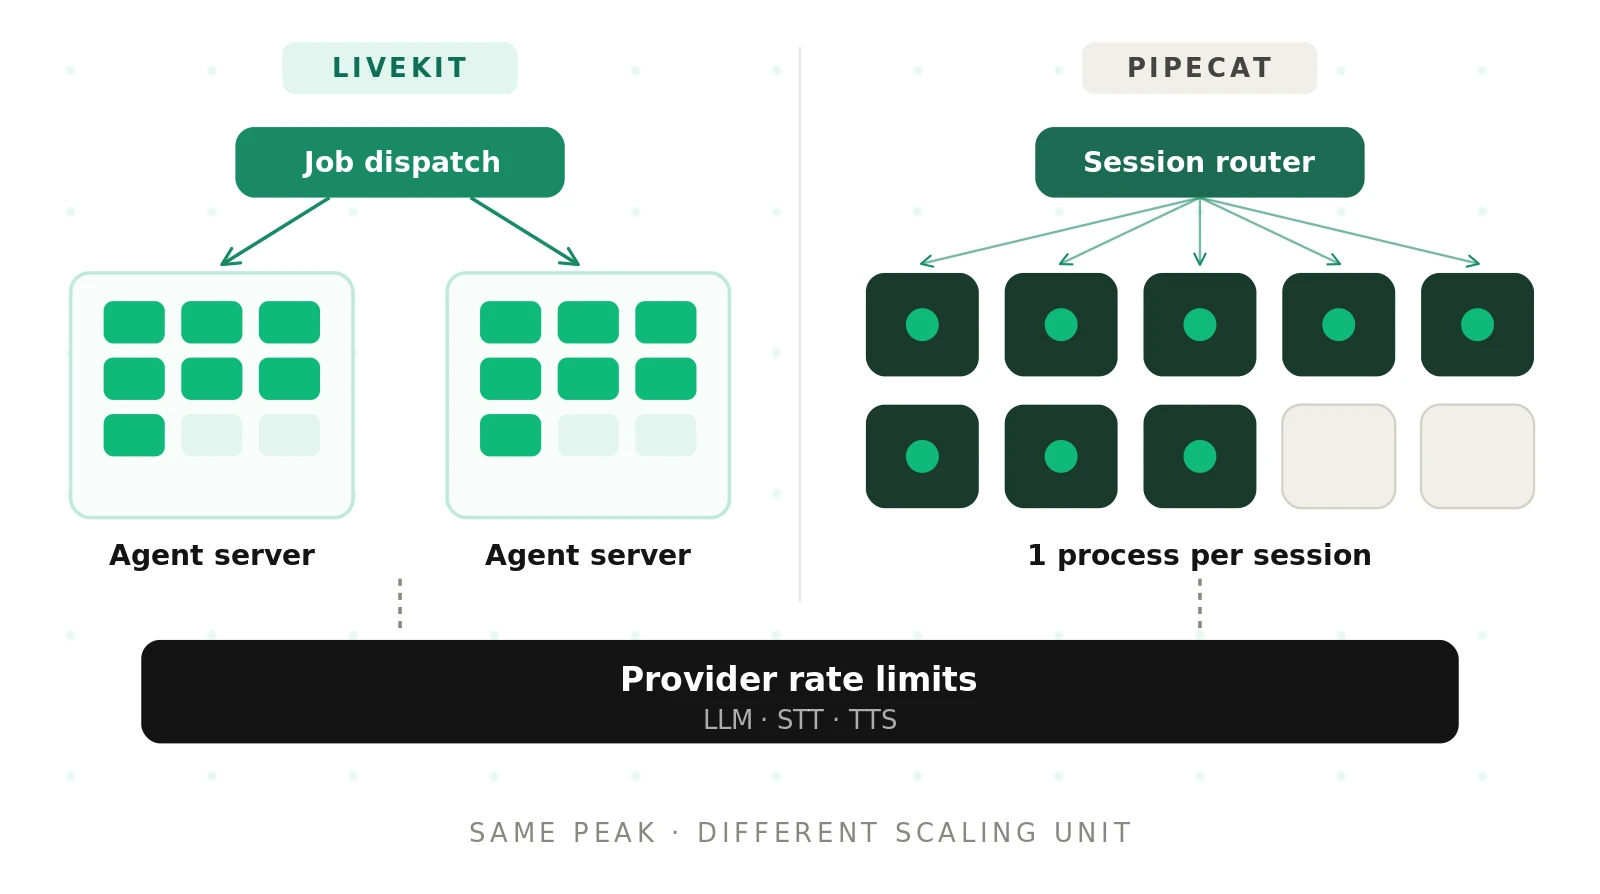
Most comparison posts stop at "both scale horizontally." That is true and useless. It says nothing about calls per node, deploys at peak, or the moment your LLM provider starts returning 429s.
This post goes one level down, from 10 to 10,000 concurrent calls. It ends with a capacity worksheet and a load-test plan you can run this week.
Neither framework wins at scale. They put the hard problems in different places. For the broader comparison, start with our Pipecat vs LiveKit hub.
Concurrency: the number of calls running at the same instant. Average concurrency equals calls per hour times average call duration in hours.
Agent server: LiveKit's name for the long-running process that registers with LiveKit server and accepts jobs. Older docs, and most engineers, still call it a "worker."
Session process: in Pipecat, the Python process that runs one `bot()` pipeline for one conversation, then exits.
The scaling unit: dispatched jobs vs one process per session
The biggest difference is who decides where a call runs.
LiveKit: agent servers accept dispatched jobs
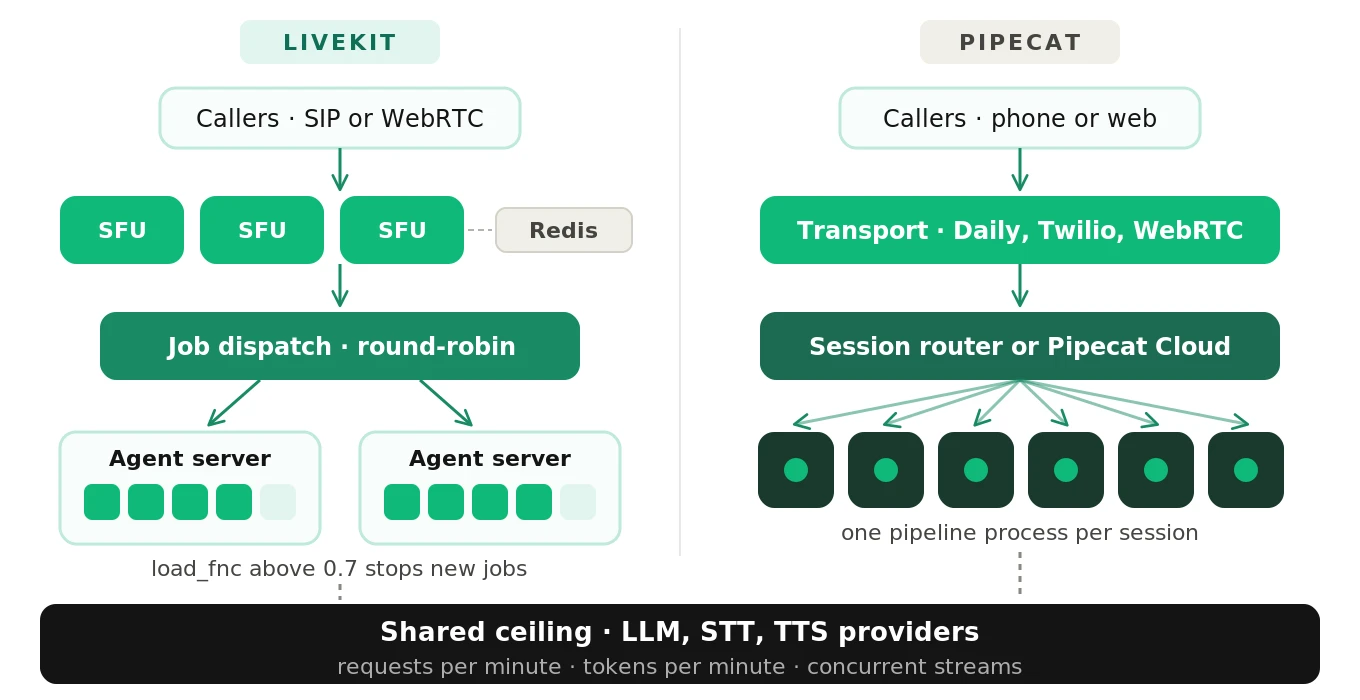
In LiveKit, your agent code starts as an agent server. It opens a WebSocket to LiveKit server, registers, and waits. When a room needs an agent, LiveKit sends a job request. The first available server accepts it and spawns a new process for that job. The server lifecycle docs describe this flow.
A few details matter at scale:
- Load reporting is built in. Agent servers exchange availability and capacity with LiveKit server. LiveKit uses that to balance new jobs.
- Availability has a threshold. The default `load_fnc` is average CPU over a 5-second window. The default `load_threshold` is 0.7. Above it, the server stops taking new jobs.
- Distribution is round-robin. Each job goes to exactly one server. If a server doesn't accept in time, the job moves to the next one.
- Dispatch is fast. LiveKit's dispatch docs cite a max dispatch time under 150 ms.
- No inbound ports. Agent servers dial out over WebSocket. You don't expose them to the internet.
The upshot: LiveKit ships the router. You scale by adding more agent servers.
Pipecat: you own the dispatcher
A Pipecat bot is a Python process. The Pipecat deployment overview says so directly. Something must receive "start a session" requests, set up the transport, and spawn that process. In development, the built-in runner does this. In production, the docs say plainly that the runner isn't built for it.
So you pick a pattern. The Pipecat docs describe three:
- VM per session. A dispatcher calls a machines API (Fly.io, AWS, GCP) for a fresh VM. Strong isolation. You pay a cold start every time.
- Warm pool with subprocess workers. A long-lived host pre-creates rooms and spawns bot subprocesses. Very fast starts. Capped by what one host can hold.
- Managed runtime. Hand the lifecycle to a platform. Pipecat Cloud is Daily's managed runtime for Pipecat.
The docs also mention Kubernetes fleets scaled by HPA or KEDA on a custom session-count metric. It is a common self-hosted shape.
The upshot: Pipecat gives you the pipeline. Routing, admission control, and fleet shape are your design. Our managed vs self-hosted orchestration guide covers that trade in more depth.
LiveKit has two fleets to scale, not one
Teams often forget that self-hosted LiveKit means two fleets. One carries media. One runs agents.
The media fleet (SFU)
LiveKit server is a WebRTC SFU. In distributed mode it uses Redis as a shared store and message bus. Each node reports stats to Redis, so any node can place a new room on an available node. The distributed deployment docs add one hard rule: a room must fit on a single node.
For one-caller voice rooms, that rule rarely bites. For large rooms with many participants, it does.
On Kubernetes, the LiveKit Helm chart uses host networking. That limits you to one LiveKit pod per node. The chart sets `terminationGracePeriodSeconds` to 5 hours so nodes can drain. LiveKit also states it doesn't support serverless or private clusters, because extra NAT layers break WebRTC.
Multi-region uses a region-aware node selector. Geo DNS sends the user to the nearest load balancer. LiveKit then picks a node in that region below a `sysload_limit`.
The agent fleet
Agent servers are ordinary containers. You can run many per node. Here is a custom load function adapted from the server options docs. It caps jobs by count instead of CPU:
# Adapted from LiveKit's server options docs (simplified).
from livekit.agents import AgentServer, JobContext, cli

server = AgentServer(
    load_threshold=0.9,   # stop accepting above this load
    drain_timeout=1800,   # seconds to let live calls finish on SIGTERM
)

def compute_load(s: AgentServer) -> float:
    # With /10 and a 0.9 threshold, this caps the server at 9 jobs.
    return min(len(s.active_jobs) / 10, 1.0)

server.load_fnc = compute_load

@server.rtc_session(agent_name="support-agent")
async def entrypoint(ctx: JobContext):
    ...  # build your AgentSession here

if __name__ == "__main__":
    cli.run_app(server)
Count-based load is easier to reason about than CPU, but blind to CPU spikes. Pick one on purpose. Note that `load_fnc` and `load_threshold` can't be changed on LiveKit Cloud deployments.
If you'd rather not run either fleet, LiveKit Cloud hosts both. Its docs promise automatic scaling and load balancing "up to the limits of your plan." Our Pipecat Cloud vs LiveKit Cloud comparison goes through the managed options.
How Pipecat scales in practice
Self-hosted Pipecat needs admission control. Without it, a burst spawns more bots than your hosts can run. Here is a minimal warm-pool dispatcher sketch. It is simplified and illustrative, not a Pipecat API:
# Illustrative dispatcher for self-hosted Pipecat (simplified).
import asyncio, os, sys
from fastapi import FastAPI, HTTPException

MAX_SESSIONS = int(os.getenv("MAX_SESSIONS_PER_HOST", "12"))
app = FastAPI()
active: set[asyncio.subprocess.Process] = set()
draining = False

@app.post("/start")
async def start(req: dict):
    if draining or len(active) >= MAX_SESSIONS:
        # Tell the router to try another host, or play a hold message.
        raise HTTPException(status_code=429, detail="host at capacity")
    room_url, token = await create_room()  # or pop from a warm room pool
    proc = await asyncio.create_subprocess_exec(
        sys.executable, "bot.py", env={**os.environ,
        "ROOM_URL": room_url, "ROOM_TOKEN": token, "SESSION_ID": req["id"]})
    active.add(proc)
    asyncio.create_task(reap(proc, room_url))
    return {"room_url": room_url, "session_id": req["id"]}

async def reap(proc, room_url):
    await proc.wait()          # one conversation, then exit
    active.discard(proc)
    await delete_room(room_url)
Three things in that sketch do the real work. The session cap is your version of LiveKit's `load_threshold`. The 429 is your backpressure signal. The `draining` flag is what your `preStop` hook flips during deploys.
Pipecat Cloud's scaling model
Pipecat Cloud replaces that dispatcher. Its model is simple and strict:
- One session per instance. Concurrency equals running instances. A bigger profile gives one session more CPU. It doesn't fit two sessions.
- `min-agents` keeps instances warm. It defaults to 0. Warm instances bill even when idle.
- `max-agents` is a hard cap. Requests past it get HTTP 429.
- A free auto-scaling buffer. New idle instances become available in about 30 seconds.
- Default pool cap. As of September 2026, each deployment in a Daily-hosted region has a maximum pool size of 50. You can request an increase. Self-hosted regions are bounded by your own cluster.
# Pipecat Cloud: keep 30 warm, cap at 50, pin to a US region.
pipecat cloud deploy support-agent \
  --region us-east \
  --profile agent-1x \
  --min-agents 30 \
  --max-agents 50
As of September 2026, Daily-hosted regions include us-west, us-east, eu-central, and ap-south, per the regions guide. Your app chooses which regional agent to call.
Per-session resource footprint
How many calls fit on a node depends on what runs locally. Remote STT, LLM, and TTS cost almost nothing on your CPU. Local models are different.
| Component | Where it runs | Relative CPU cost | Notes |
|---|---|---|---|
| Media transport and audio frames | Local | Low | Constant per call; scales linearly |
| Silero VAD | Local | Low to moderate | Runs on every inbound audio frame |
| Turn-detection model | Local or hosted | Moderate | LiveKit notes its turn detector adds CPU and memory |
| Noise suppression | Local or hosted | Moderate to high | Enhanced noise cancellation raises per-call CPU |
| Remote STT, LLM, TTS | Provider | Near zero locally | Cost moves to network and provider limits |
| Recording and egress | Media fleet | Varies | Separate fleet on LiveKit; bolt-on in Pipecat |
Now the published numbers. LiveKit's self-hosted deployment guide recommends 4 cores and 8 GB per agent server as a starting point. It says that server handles 10 to 25 concurrent jobs, depending on components. In LiveKit's own test, 30 agents running Silero VAD on one 4-core, 8 GB machine peaked at about 3.8 cores and 2.8 GB. Those agents published a sine wave, not real TTS, so treat it as a floor.
Pipecat doesn't publish a per-host figure for self-hosting. Pipecat Cloud's default `agent-1x` profile is 0.5 vCPU and 1 GB, described as best for voice agents. That is a useful per-session sizing hint. By that yardstick, a 4-vCPU host fits about 8 sessions before headroom.
Measure your own footprint. A pipeline with local noise suppression and a turn model can use several times the CPU of a VAD-only test.
The real bottleneck is your providers, not the framework
Past a few hundred calls, frameworks rarely fail first. Your model providers do.
Every call holds open an STT stream and a TTS stream. Every turn fires one or more LLM requests. Tool calls and preemptive generations add more. LLM providers enforce requests per minute (RPM) and tokens per minute (TPM). OpenAI's rate limits guide is a good primer on how those tiers work. STT and TTS vendors typically cap concurrent streams.
LiveKit Inference is a concrete example. As of September 2026, its free Build plan allows 5 STT and 5 TTS connections, 100 LLM requests per minute, and 600,000 tokens per minute. Paid plans raise these. The quotas page lists them. Your own provider contracts will have similar ceilings.
Here is the failure pattern. The framework accepts the call. The LLM call gets throttled and retried. Time to first token climbs from 400 ms to two seconds. Nothing crashes. The caller hears dead air and talks over the agent. That is why latency budgets need to be tested at peak, not at idle.
Capacity-planning worksheet (illustrative)
Every number in this section is illustrative. Swap in your own traffic.
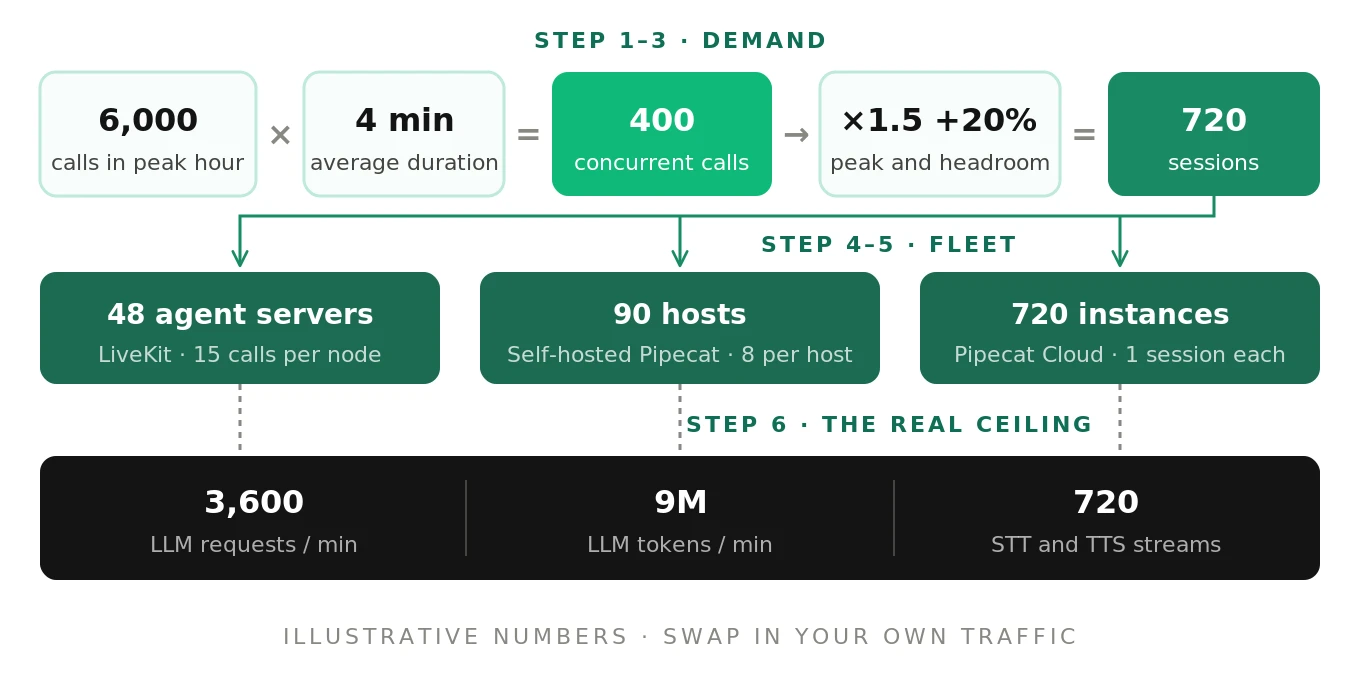
Step 1: average concurrency. Calls per hour times average duration in hours. Assume 6,000 calls in the peak hour at 4 minutes each. That is 6,000 × 4 ÷ 60 = 400 concurrent calls.
Step 2: peak factor. Calls cluster within the hour. A peak factor of 1.5 gives 600 concurrent calls at the top of the burst.
Step 3: headroom. Add 20% for retries, slow drains, and forecast error. Plan for 720 sessions.
Step 4: sessions per node. Say you measure 15 calls per 4-core agent server on LiveKit. You need 48 servers at peak. Scale up at 50% CPU when `load_threshold` is 0.7, as LiveKit's docs advise. For self-hosted Pipecat at 8 calls per 4-vCPU host, you need 90 hosts. On Pipecat Cloud, you need 720 instances. That is far past the default cap of 50, so request the increase early.
Step 5: warm capacity. Pipecat Cloud's capacity planning guide gives a formula: reserved = MAX(baseline sessions, calls per second × idle creation delay). At a burst of 3 calls per second and a 30-second delay, reserve at least 90. The same logic applies to any warm pool you build.
Step 6: provider throughput. At 720 calls and 5 LLM requests per call-minute, you need 3,600 RPM. At 2,500 tokens per request, that is 9 million TPM. You also need 720 concurrent STT streams and up to 720 TTS streams.
What breaks first changes with scale:
| Concurrency | What usually binds first | LiveKit focus | Pipecat focus |
|---|---|---|---|
| 10 | Cold starts, not capacity | Plan tier cold starts, prewarm | Scale-to-zero delay, image size |
| 100 | Default provider tiers | Agent server sizing | Single-host warm pool ceiling |
| 1,000 | LLM TPM, STT stream caps | Autoscaler thresholds, drain time | Router in front of many hosts |
| 10,000 | Multi-region, carrier channels | SFU placement, Redis, regions | Regional fleets, session routing |
Cold starts and pre-warming
A cold start is the gap between "call arrives" and "agent can listen." On a phone line, callers read that gap as a dropped call.
LiveKit. Each job runs in its own process. A `prewarm` function (`setup_fnc`) loads slow assets before a job arrives. In production, the default number of idle processes is `math.ceil(cpu_count)` in Python. On LiveKit Cloud's free Build plan, agents can scale to zero and cold-start in 10 to 20 seconds. As of September 2026, paid plans keep production agents warm. LiveKit Cloud allows 5 minutes for a new instance's health check to pass during deploys. Keep `prewarm` well under that.
Pipecat. Pipecat Cloud calls about 10 seconds a best case. Large images and heavy import-time code push it to 30 seconds or more. The fix is the same everywhere. Bake VAD and model weights into the image. Keep module-level imports light. Keep `min-agents` above zero in production. Idle instances stay warm for a 5-minute cooldown after a session ends.
For phone traffic, both vendors give the same advice. Design a hold message for the cold starts you can't avoid.
Regional placement and latency
Voice is unforgiving about distance. An agent far from the caller adds round-trip delay to every turn. The provider hop adds more.
LiveKit Cloud uses geographic affinity to match users with the nearest agent servers. Self-hosted LiveKit uses the region-aware node selector for media. Your agent fleet must live near the media nodes.
Pipecat Cloud makes region explicit. You deploy uniquely named agents per region, with region-specific secrets. Telephony WebSockets have regional endpoints, and the default is us-west. A US East caller routed to us-west pays for it on every turn.
The provider matters too. An agent in Virginia calling an LLM endpoint in Oregon undoes your careful placement. Third-party benchmarks put both frameworks at roughly 750 to 950 ms end to end. Placement often decides which end of that range you land on. Our latency comparison breaks it down by stage.
Deploys and graceful draining
A voice session is stateful and long. You can't kill it and retry like an HTTP request.
LiveKit. On `SIGTERM`, an agent server enters draining. It stops taking jobs and lets live ones finish. `drain_timeout` defaults to one hour. LiveKit's docs suggest a 10-minute-plus grace period for voice. LiveKit Cloud does rolling deploys, giving old instances up to an hour.
Pipecat. Pipecat's production guide warns that Kubernetes' default 30-second grace period will drop calls. Pair a longer grace period with a `preStop` hook that stops new sessions. On Pipecat Cloud, running instances finish on the old image. They are discarded when their sessions end.
Here is a simplified Kubernetes pattern for either agent fleet:
# Simplified. Works for LiveKit agent servers or a Pipecat dispatcher host.
apiVersion: apps/v1
kind: Deployment
metadata:
  name: voice-agents
spec:
  template:
    spec:
      terminationGracePeriodSeconds: 1800   # longest expected call + margin
      containers:
        - name: agent
          image: registry.example.com/voice-agent:2026-09-28
          resources:
            requests: { cpu: "4", memory: "8Gi" }
          lifecycle:
            preStop:   # Pipecat hosts: flip "draining" before SIGTERM
              httpGet: { path: /drain, port: 8081 }
---
apiVersion: autoscaling/v2
kind: HorizontalPodAutoscaler
metadata:
  name: voice-agents
spec:
  scaleTargetRef: { apiVersion: apps/v1, kind: Deployment, name: voice-agents }
  minReplicas: 6
  maxReplicas: 60
  metrics:
    - type: Resource
      resource:
        name: cpu
        target: { type: Utilization, averageUtilization: 50 }
  behavior:
    scaleUp:   { stabilizationWindowSeconds: 0 }
    scaleDown: { stabilizationWindowSeconds: 900 }
Fast scale-up and slow scale-down is deliberate. LiveKit's docs note that voice spikes are "less spikey" because calls last minutes. The Kubernetes HPA docs explain the stabilization settings. For Pipecat, scaling on an active-sessions metric with KEDA often tracks load better than CPU.
One consequence is easy to miss: a rolling deploy can take as long as your longest call.
Failure isolation and call continuity
At 10,000 calls, something is always failing. The question is how far the blast spreads.
LiveKit. Each job runs in its own process. A job crash doesn't affect other jobs on the same server. If the agent server itself crashes, all its child jobs end. If an agent drops from a live room, LiveKit detects it in about 15 seconds and dispatches a new agent to the room. The caller's media connection can survive. The new agent is a fresh instance, so plan to restore conversation context from your own store.
Pipecat. Process-per-session gives natural isolation. Warm-pool subprocesses share a host and kernel. VM per session is the strongest isolation. Crash handling is yours on self-hosted setups. You decide whether to retry, and whether to reuse or recreate the room or call.
Neither framework makes a call survive a crash with its state intact. Test that path deliberately. Kill a process mid-call and listen to what the caller hears.
Observability at scale
At scale you debug by session ID, not by log tailing.
Propagate one session ID through the dispatcher, the bot, and the transport. Track active sessions, time to "agent ready," session duration, and per-turn latency. Pipecat exposes pipeline metrics through `PipelineParams(enable_metrics=True, enable_usage_metrics=True)`. LiveKit Cloud's dashboard shows session counts and errors for deployed and self-hosted agents. Its log drains forward server-level crashes that happen outside any session.
Both options end at infrastructure health. They tell you a session ran. They don't tell you it went well. Our guides on OpenTelemetry for voice agents and production monitoring cover the rest of the stack.
Scaling concerns side by side
| Concern | LiveKit | Pipecat | What to test |
|---|---|---|---|
| Scaling unit | Agent server, one process per job | One pipeline process per session | Calls per node at target latency |
| Routing | Built-in dispatch, round-robin | Your dispatcher, or Pipecat Cloud | Start latency under burst |
| Admission control | `load_fnc` and `load_threshold` | Your cap, or `max-agents` with 429 | Behavior at 100% capacity |
| Warm capacity | `prewarm`, idle processes | Warm pool, or `min-agents` | Time to ready from idle |
| Deploys | Draining, 1-hour default timeout | Your `preStop` and grace period | Calls dropped per deploy |
| Crash recovery | Re-dispatch in about 15 s | Your retry logic | Caller experience after kill |
| Media scale | SFU fleet, Redis, room per node | Transport vendor (Daily, Twilio) | Media quality at peak |
| Regions | Geographic affinity, region selector | Per-region agents and endpoints | Latency from each caller region |
| Provider limits | Same for both | Same for both | Latency as RPM and TPM rise |
For telephony-specific scaling, like SIP trunk channel limits, see our telephony comparison. Many teams run both frameworks together, with Pipecat on LiveKit transport. That pattern is in our guide to using LiveKit and Pipecat together.
How to load-test either framework before a traffic spike
Load testing a voice agent is not the same as load testing an API. You need real audio, real turn-taking, and quality scoring. Here is the process we recommend.
1. Model the real call mix. Pull a week of production calls. Record duration, turns per call, tool calls per call, and silence ratios. Build scripted callers that match that mix, including interruptions and background noise.
2. Set a baseline at low load. Run 5 to 10 concurrent calls. Record time to first audio, per-turn latency at p50 and p95, and task success. This is your quality reference.
3. Ramp in steps, not a cliff. Step to 25%, 50%, 75%, 100%, and 125% of planned peak. Hold each step for 10 to 15 minutes. Long calls need long holds before the system reaches a steady state.
4. Add a burst test. Jump from baseline to peak arrival rate in under a minute. This exposes cold starts, warm-pool refill lag, and autoscaler delay.
5. Hit provider limits on purpose. Run against the same API keys and tiers as production. Note where 429s, retries, and queueing start. Confirm your fallbacks actually trigger.
6. Run a soak test. Hold 70% to 80% of peak for four to eight hours. Watch memory per process, file descriptors, and room cleanup. Slow leaks only show up here.
7. Deploy during load. Ship a new version at peak. Count dropped calls, stuck drains, and sessions that start on the old version.
8. Measure degradation, not just failures. Compare every step against the baseline. Track p95 latency, interruption errors, transcription accuracy, and task completion. A 0% error rate with p95 latency doubled is a failed test.
Our stress testing guide goes deeper on scripted callers. The framework-specific test setups are in our LiveKit testing guide and Pipecat testing guide.
A ramp profile might look like this. It is illustrative and tool-agnostic:
# Illustrative ramp profile for a 600-call peak.
baseline: { concurrent: 10, hold_min: 15 }
steps:
  - { concurrent: 150, hold_min: 15 }
  - { concurrent: 300, hold_min: 15 }
  - { concurrent: 450, hold_min: 15 }
  - { concurrent: 600, hold_min: 20 }
  - { concurrent: 750, hold_min: 10 }   # 125% of peak
burst: { from: 10, to: 600, ramp_sec: 45 }
soak: { concurrent: 450, hold_hours: 6 }
pass_criteria:
  p95_turn_latency_ms: "<= baseline * 1.25"
  task_success: ">= baseline - 2 points"
  dropped_calls_per_deploy: 0
Quality degrades before systems fail
This is the shared blind spot. Neither LiveKit nor Pipecat tells you when call quality slips under load.
Your dashboards show sessions accepted, CPU, and error rates. They stay green while turn latency creeps up. Endpointing fires late because the CPU is saturated. TTS streams arrive choppy. The LLM falls back to a smaller model after throttling. Callers repeat themselves and hang up. No alert fires, because no system failed.
That is why load needs an independent quality check. Evalgent runs framework-agnostic evaluation on real and simulated calls. It scores latency, interruptions, accuracy, and task success at each load step. It works the same on LiveKit, Pipecat, or both. You get a quality curve, not just an uptime curve. Read more about why independent evaluation matters.
Frequently asked questions
How does LiveKit vs Pipecat scaling differ?
LiveKit scales through agent servers that register with LiveKit server and accept dispatched jobs, one subprocess per call, with built-in load balancing. Pipecat scales by running one pipeline process per session behind a dispatcher you build, or behind Pipecat Cloud. LiveKit ships the router. Pipecat leaves routing, admission control, and fleet shape to you or its managed runtime.
How many concurrent calls can a LiveKit agent server handle?
LiveKit recommends 4 cores and 8 GB per agent server as a starting point. It says that server handles 10 to 25 concurrent jobs, depending on components. Local noise suppression and turn detection raise per-call CPU. The default `load_threshold` of 0.7 stops new jobs at 70% CPU. Measure your own pipeline before sizing a fleet.
Does Pipecat run one process per call?
Yes. A Pipecat bot is a Python process that runs one conversation and exits. In production, a dispatcher spawns it as a subprocess, a container, or a VM per session. On Pipecat Cloud, each instance runs exactly one active session. A larger compute profile gives that session more CPU and memory. It doesn't fit more sessions on one instance.
How does Pipecat Cloud scaling work?
Pipecat Cloud keeps a pool of instances, one session each. The `min-agents` setting keeps instances warm, and `max-agents` sets a hard cap that returns HTTP 429. A free buffer adds idle instances in about 30 seconds. As of September 2026, the default pool cap in Daily-hosted regions is 50 per deployment. Higher limits require a request.
What limits voice agent concurrent calls in production?
Voice agent concurrent calls are usually limited by provider rate limits, not the framework. LLMs enforce requests and tokens per minute. STT and TTS vendors cap concurrent streams. Carriers cap SIP channels. When these ceilings approach, latency climbs through retries and queueing before errors appear. Load-test against production keys and tiers to find the real ceiling.
How do you avoid cold starts in LiveKit and Pipecat?
Keep capacity warm and startup light. In LiveKit, use a `prewarm` function for slow assets and a paid Cloud plan, since free-plan agents can cold-start in 10 to 20 seconds. In Pipecat, bake model weights into the image, trim imports, and keep `min-agents` above zero. For phone calls, add a hold message for unavoidable cold starts.
How do you deploy voice agents without dropping live calls?
Drain instead of killing. LiveKit agent servers stop taking jobs on SIGTERM and wait up to `drain_timeout`, which defaults to one hour. For self-hosted Pipecat, add a `preStop` hook that stops new sessions and raise Kubernetes' 30-second default grace period. Set the grace period longer than your longest expected call.
How do you know if voice quality degrades under load?
Compare quality metrics at each load step against a low-load baseline. Track p95 turn latency, interruption errors, transcription accuracy, and task completion, not just error rates. Neither LiveKit nor Pipecat reports call quality under load. An independent evaluation layer like Evalgent scores calls during ramps and soaks so you can see degradation first.
The bottom line
LiveKit ships the job router and a media fleet, while Pipecat hands you a per-session process and lets you or Pipecat Cloud own the fleet. At real volume, both hit provider limits and quality decay first, so measure call quality under load before your peak hour does it for you.
Want to see how your agent sounds at 10x traffic, on any framework? Book a demo and let Evalgent test it independently.
Related Articles
Why AI voice agents fail in production: 9 failure layers, how to detect each, and how to prevent them
Voice agents fail in production across 9 layers, from 8 kHz audio to silent tool errors. Symptoms, root causes, alerts, and fixes in one master table.
Read more
Voice agent regression testing: why LLM updates break production
LLM updates improve benchmarks but break voice agents in 5 predictable ways. How to detect and prevent regressions after every model or prompt change.
Read more