Real-Time vs Batch Voice Agent Monitoring: What Each Catches
On this page
A voice agent can break at 2:40 p.m. and nobody notices until tomorrow. Or it can say something wrong on every fifth call while every dashboard stays green. Those are two different failures. They need two different clocks.
This post is for the team that built and runs its own agent inside a larger product. You have a few engineers and no QA function. It compares the two timing models and what each one can and cannot see. It does not repeat how to build the full stack. For that, see our production monitoring guide. For who gets paged and who gets a ticket, see voice agent alerting. For how to pick calls for review, see sampling live calls. For the wider map, see testing vs monitoring vs observability.
The angle here is timing. The question is not what to measure. It is how long you can afford to wait before a human knows.
All sources were checked on November 19, 2026. Worked examples are illustrative, not measurements.
What real-time and batch monitoring mean
Real time voice agent monitoring means signals reach your alerting within seconds or minutes of the event. Calls may still be in progress. Think of per-turn events, tool outcomes, telephony metrics and call setup results flowing into rolling windows.
Batch monitoring means you collect finished calls and process them on a schedule. It might run every hour or every night. It usually works on recordings and transcripts, so it is post-call analysis. It can run slower and deeper checks, such as a judge scoring each call against a rubric.
Three clarifications keep this honest.
Real time is not real-time intervention. Monitoring tells a human, or a rule, that something is wrong. It does not change what the agent says mid-call. Changing the call is a different job, done inside your own agent or by your kill switch.
Batch is not the same as sampling. Batch is about timing. Sampling is about how many calls you look at. You can batch-score every call. See score every call, not a sample.
Stream and batch also exist inside the telemetry pipe. OpenTelemetry's collector batches spans before export. Its batch processor says batching "helps better compress the data and reduce the number of outgoing connections." Its default timeout is 200 ms. That is plumbing. Streaming vs batch monitoring of calls is a separate question. A related split exists in speech recognition. See streaming vs batch STT.
Google's SRE book gives the base rule for the fast side. Your monitoring "should address two questions: what's broken, and why?" The fast lane answers the first. The slow lane is better at the second.
Detection delay: the number that separates them
The cleanest way to compare the two models is detection delay. It is the time from the first affected call to the first human notice.
Google's SRE Workbook lists it as one of four alert attributes. It defines detection time as "how long it takes to send notifications in various conditions." The other three are precision, recall and reset time. Real time voice agent monitoring wins on detection time. Batch wins on recall for quality failures, which we cover below.
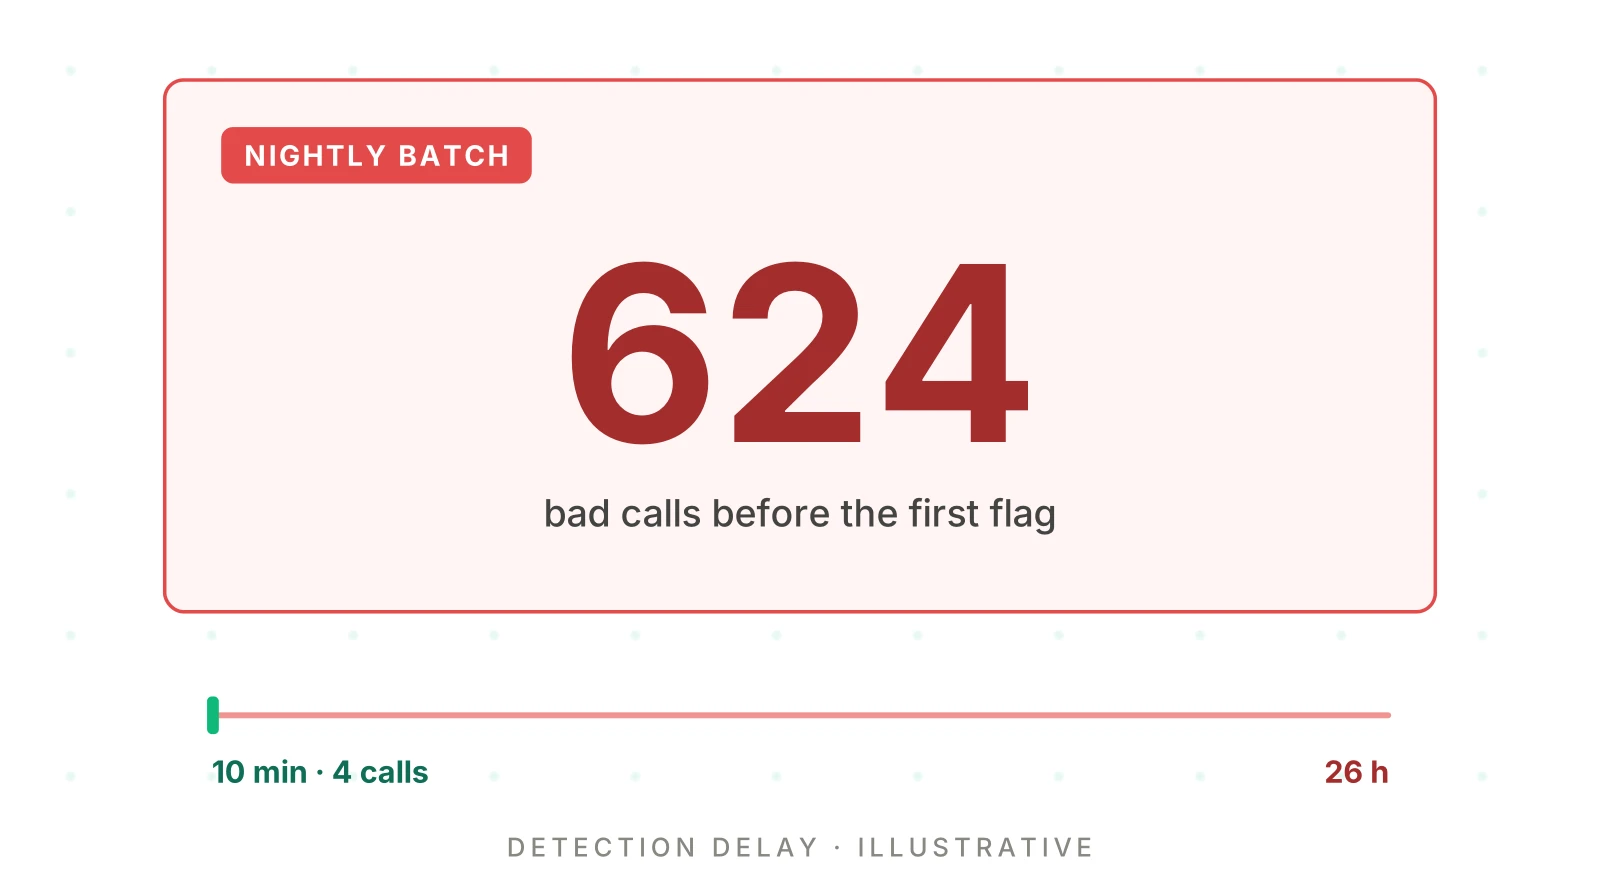
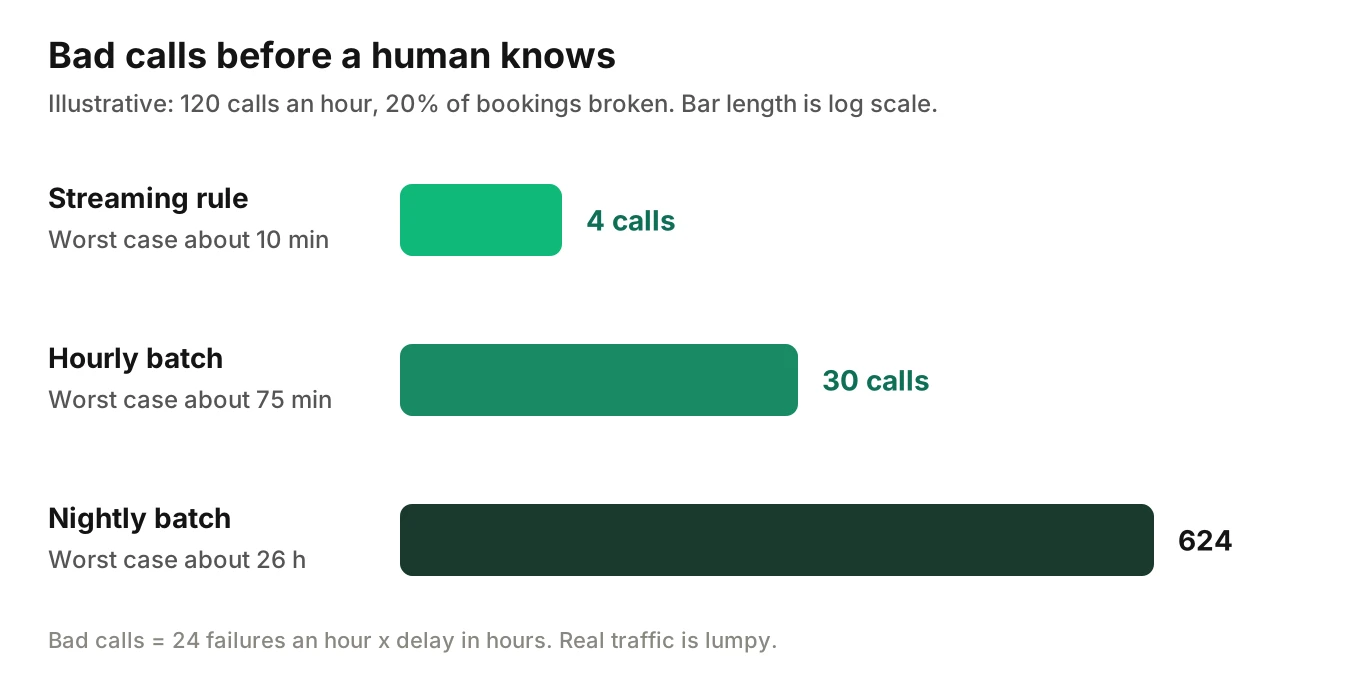
Here is an illustrative example. Assume a steady 120 calls an hour. A bad deploy breaks 20% of bookings. That is 24 failed bookings an hour. Compare three setups.
| Setup | How it detects | Worst-case delay | Bad calls before a human knows |
|---|---|---|---|
| Streaming rule | Pages after 4 failed bookings in a window | About 10 minutes | About 4 |
| Hourly batch | Judges the last hour, 15 minutes to process | About 75 minutes | About 30 |
| Nightly batch | Judges the last day, 2 hours to process | About 26 hours | About 624 |
The math: 24 failures an hour, times the delay in hours. The 10-minute row is simply how long 24 failures an hour takes to produce 4 failures. Real traffic is lumpy, so treat these as shape, not forecast.
Two lessons follow. First, a minimum-count guard sets part of your delay. Fewer required failures means faster paging and more false alarms. Second, the cost of a slow lane grows with traffic and with how bad the fault is. At low volume, a nightly batch may cost you little. At high volume, it can cost you hundreds of callers.
What real-time monitoring catches
The fast lane sees symptoms callers feel, as they happen. The SRE book describes black-box monitoring as "testing externally visible behavior as a user would see it." Prometheus's alerting guide says "if it is possible to alert on symptoms rather than causes, this helps to reduce noise." Both fit a streaming rule well.
These are the failures that belong on the fast lane.
- Call setup failures and traffic collapse. If callers cannot connect, no later check will see them. Write this as an absolute rule: answered calls far below the same hour last week.
- Provider outages. A speech-to-text, LLM or text-to-speech outage shows up as error codes and rising turn time within minutes. See provider outages and failover.
- Tool-failure spikes. Hard errors and timeouts in tool calls are countable per event. A burn-rate rule pages on them quickly. Silent failures need an extra check inside the handler; see detecting silent tool failures.
- Latency tails. The time from caller finishing to the agent starting can be tracked per turn. Page on the tail, with a minimum turn count.
- Dead air. A long unanswered gap can be found from turn timestamps and call data. Count calls with that gap and compare against baseline.
- Bad deploys. A fault that starts right after a release is visible within minutes if alerts carry the agent version.
The SRE Workbook's recommended page rule shows how this works in practice. A burn rate of 14.4 over a one-hour window, paired with a five-minute short window, "fires only once you've consumed 2% of the budget." That is 2% of the error budget. The short window helps reset time. The alert stops "five minutes later, rather than one hour later." For the math, see voice agent SLOs.
The fast lane also covers quiet hours if you add scheduled probes. Our post on synthetic monitoring explains how.
What real-time monitoring misses
The fast lane is blind to anything that needs reading the whole call. It sees counters and timestamps. It rarely sees meaning.
- Wrong answers that sound fine. The agent states a policy that does not exist. Latency is normal. The tool call succeeds. No counter moves.
- Policy failures. A required disclosure skipped, or a refund promised outside policy, needs a judge reading the transcript against a rule.
- Wrong records written. The tool returned success, but with the wrong date or the wrong customer. The event stream says "ok."
- Slow drift. A two-point fall in task success over three weeks never trips a page.
- Rare failures. A 1% failure at low volume may not reach your minimum count before the weekend ends.
- Anything needing a baseline of meaning. Whether the caller's problem was solved is a judgment, not a counter.
Stream rules also depend on what you thought to instrument. Charity Majors draws the line this way in her observability manifesto: monitoring is about "known-unknowns and actionable alerts." A streaming rule watches the known unknowns. Quality failures are often unknown ones.
There is a latency point worth keeping straight. The ITU-T G.114 recommendation frames a 150 ms total one-way budget for the whole chain. Below it, most applications are not significantly affected, and 400 ms is the planning limit. That budget is measured in milliseconds, per turn. No monitoring system works at that speed. Monitoring, fast or slow, tells you afterward that turns ran long. It does not shave them mid-call.
What batch monitoring catches
The slow lane reads finished calls. It can afford deeper checks because nobody is waiting on the result.
- Task success and wrong answers. A judge scores each call against a rubric, with evidence from the transcript.
- Policy and compliance failures. Skipped disclosures, forbidden promises and scripts not followed.
- PII leakage. Sensitive data repeated where it should not be.
- Tool-call failures that logged as success. A transcript that claims a booking, with no matching tool outcome.
- Slow drift and regressions. Rates by day and by agent version, compared against baseline. See metric drift and prompt regression monitoring.
- Rare failures. Scoring every call finds a 0.2% failure that no human sample would reach. See the production monitoring guide for the sampling math.
- Clusters and causes. With every call judged, you can group failures by scenario, tenant or version.
Batch is also where the evidence lives. A page tells you the rate is up. A judged call tells you which calls, which turn and what went wrong.
Precision and recall, in the SRE Workbook's terms, favor this lane for quality. Precision is "the proportion of events detected that were significant." Recall is "the proportion of significant events detected." A counter rule has high precision on outages and zero recall on wrong answers. A judge has the reverse profile on quality.
What batch monitoring misses
Batch is slow by design. Three costs follow.
- Detection delay. As the table above shows, a nightly job can leave a fault live for a day.
- Pipeline lag you do not see. Transcription, judging and queueing each add time. A batch lane can fall hours behind and still look healthy.
- Judge error. A judged flag is a finding, not a verdict. Judges miss things and flag clean calls. Audit them with a small human sample, as our sampling post explains.
Prometheus's alerting guide offers a useful rule for the pipeline itself. For batch jobs, it says a staleness threshold "should generally be at least enough time for 2 full runs of the batch job." Its example: "For a job that runs every 4 hours and takes an hour, 10 hours would be a reasonable threshold." Alert when your batch output is older than that, or a stuck job will quietly turn into a monitoring blind spot. Prometheus also says to have "a blackbox test" that proves alerts reach a human.
Real time vs batch voice agent monitoring side by side
Real-time vs batch monitoring comes down to one table. Use it to place each failure. The marks are guidance, not law. Your stack may differ.
| Failure | Real-time stream | Batch review | Route it to |
|---|---|---|---|
| Call setup failure, traffic collapse | Best | Too late | Page |
| Provider outage | Best | Late, explains cause | Page |
| Tool-failure spike | Best for hard errors | Finds silent failures | Page, then ticket |
| Latency tail | Best | Confirms by segment | Page the tail, ticket the rest |
| Dead air | Good, from timestamps | Good, with call context | Page on rate rise |
| Wrong answer, hallucination | Blind | Best | Ticket |
| Policy or disclosure miss | Blind | Best | Ticket, page on repeats |
| PII leakage | Blind | Best | Ticket, page on repeats |
| Slow drift | Weak | Best | Ticket |
| One odd call | Skip | Searchable | Log |
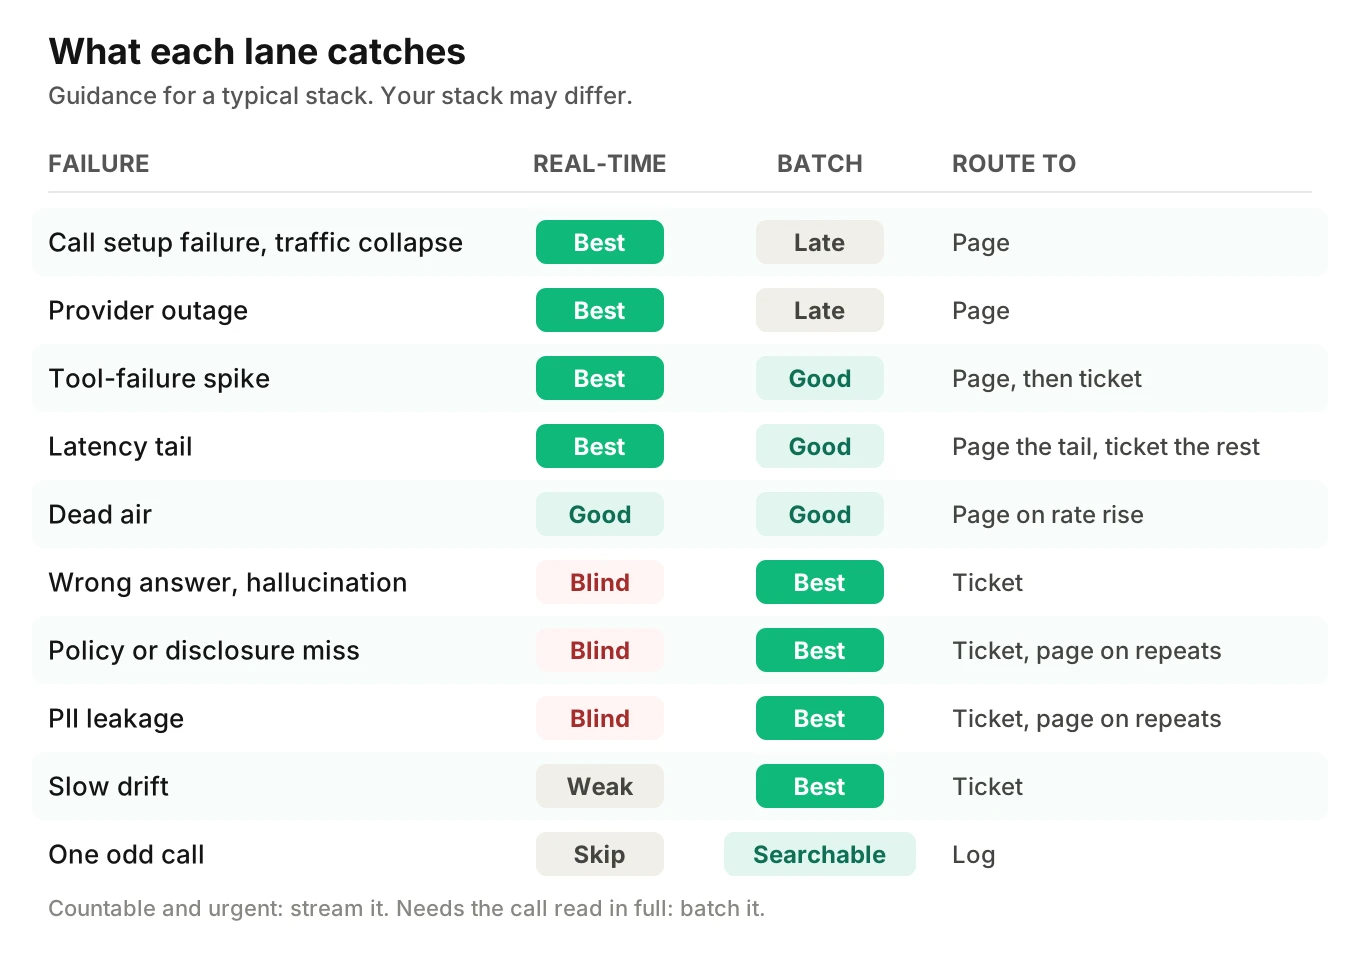
The pattern is simple. Anything countable and urgent goes to the fast lane. Anything that needs reading goes to the slow lane. Anything that is both urgent and needs reading is where teams get stuck, and we cover it below.
One call, three clocks
A single call produces signals on several clocks. Twilio's Voice Insights documentation shows this clearly for the telephony layer. We use it as one example, not a requirement.
Its event streams offer "real-time webhooks for call summaries, metrics, and quality events." Gateway metrics are generated every ten seconds. Call events are typically emitted within 90 seconds. A partial call summary arrives within ten minutes of the call ending. A completed call summary "may take up to thirty minutes to generate." The call summary page says the same from the other side: summaries are typically available within a few minutes, though "it may take up to 30 minutes for all the details to be aggregated."
So even the telephony layer is not instant. And it is not final for half an hour. Then your own judging job runs on top. The three clocks are: seconds for metrics, minutes for call events and summaries, and your batch schedule for judged findings.
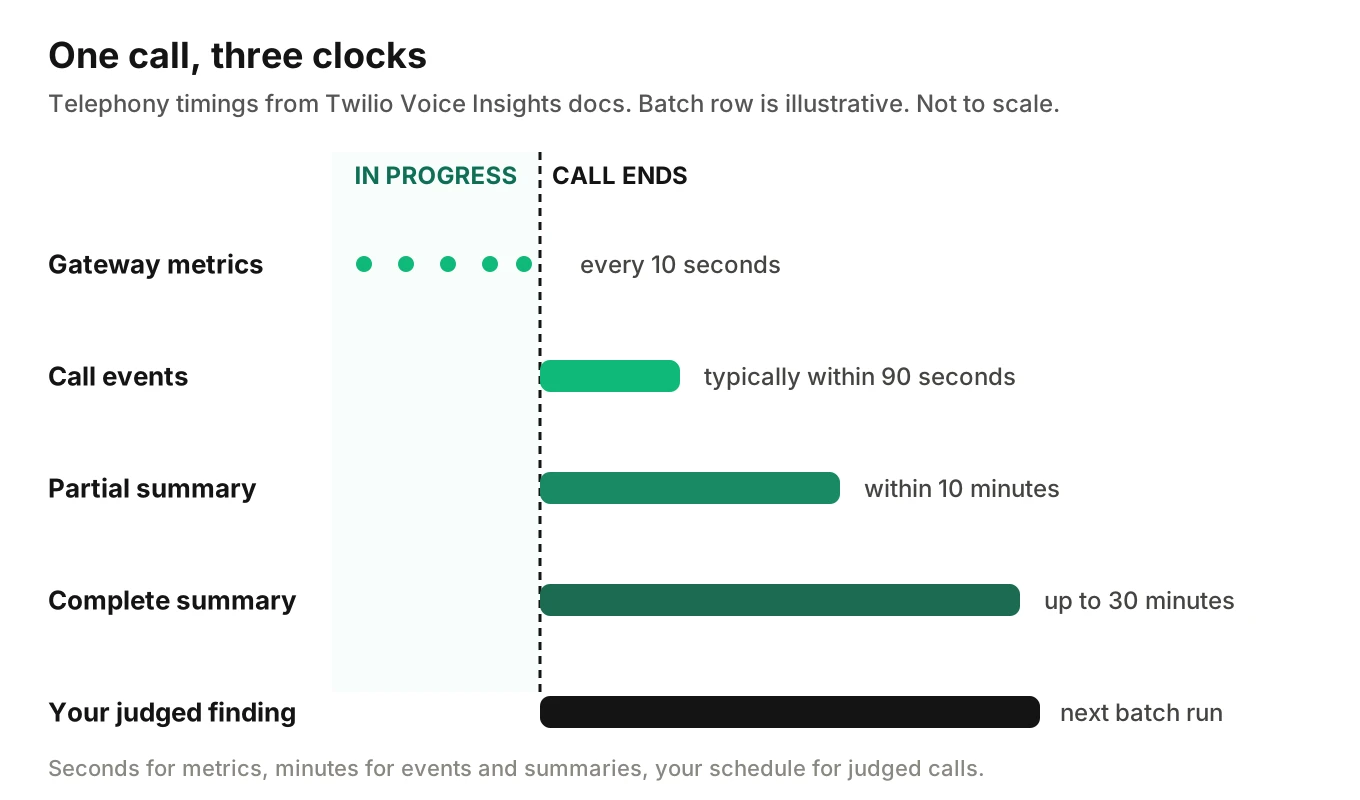
Two practical rules come out of this. Join all clocks on one call ID, so a page can link to the judged call later. And log what you need at call time. See what to log on every call.
Where Evalgent fits
Evalgent's production call monitoring sits on the batch side. Customers push call recordings. The calls are transcribed, mapped to scenarios and judged. It flags PII leakage, tool-call failures, latency spikes and policy failures, with fix recommendations. That covers the failures in the "Best" column of the batch lane above.
It is not a pager and it is not a live-call tool. It never sits in the media path, so nothing it does touches a call or slows one down. Keep your own streaming rules for outages, setup failures and tool-failure spikes. Use its findings as inputs to your ticket and page tiers. A flagged policy failure becomes a ticket, and a repeating one can promote to a page under your own rules.
Evalgent also generates test scenarios and places simulated calls before release, which is a way to prove that a fault would trip your stream rules. If you want to see how the batch lane would run on your calls, you can book a demo.
How to split your signals between real time and batch
Use these steps to assign each signal to a lane. The order matters. Do the cost of delay first.
1. List your signals - Write down every metric and finding you want. Include counters, such as tool errors, and judged checks, such as policy adherence.
2. Price the delay - For each signal, estimate bad calls per hour times the delay you would tolerate. Use your own call volume. Anything where an hour of delay is costly goes on the fast lane.
3. Test for countability - Ask whether a rule can detect it from events and timestamps alone. If yes, stream it. If it needs the transcript read against a rubric, batch it.
4. Set stream rules with guards - Add a minimum count and two agreeing windows. Take the numbers from two normal weeks of your own data, not from this post.
5. Schedule batch by risk - Run judged scoring hourly for high-risk flows and daily for the rest. Match the cadence to your delay cost from step 2.
6. Monitor the batch lane itself - Alert when judged output is older than two full runs. Test the page path on a schedule so you know it works.
Hybrid monitoring patterns that work
Most teams end up with both lanes. A few patterns tie them together.
Stream pages, batch explains. The page fires on a counter. The batch job later adds the judged calls from that window, with evidence. The on-call engineer reads the page, then the calls.
Batch promotes to stream. A judged finding that keeps repeating becomes a new streaming rule. If you find that a wrong date format causes bad bookings, add a handler check that emits an event. Next time, the fast lane sees it.
Fast batch for risky flows. A payment, a consent or a medical flow may justify hourly judging. Smaller windows narrow the delay without building a full stream.
Probes for quiet hours. Scheduled test calls give the fast lane signal when real traffic is thin. See synthetic monitoring.
None of this is legal advice. If a regulator or contract sets a notification clock for incidents, it may limit how slow your lane can be. Read the rule that applies to you.
Common mistakes
- Treating one lane as the whole system. Streaming alone misses wrong answers. Batch alone leaves outages running overnight.
- Paging on judged flags one at a time. A single flag is evidence to check. Page on a repeat pattern.
- Letting the batch job fail silently. A dead job looks like a quiet day.
- Setting minimum counts by feel. The count sets your detection delay. Price it.
- Calling a lagging telephony summary "real time." Even Twilio's complete summaries may take up to thirty minutes.
- No call ID join. Without it, a page cannot link to the judged call.
Frequently asked questions
What is real time voice agent monitoring?
Real time voice agent monitoring means call signals, such as tool outcomes, turn timing and call setup results, reach your alerting within seconds or minutes. A rule then pages a human when a symptom crosses a limit. It detects fast but cannot judge whether an answer was right. It does not change a call in progress.
What is batch voice agent monitoring?
Batch voice agent monitoring processes finished calls on a schedule, such as hourly or nightly. It usually works from recordings and transcripts. A judge can score task success, policy adherence and PII exposure against a rubric. It is slower than streaming, but it finds quality failures that counters cannot see.
Which failures does real-time monitoring catch that batch misses?
Real-time monitoring catches failures where delay is costly: call setup failures, traffic collapse, provider outages, tool-failure spikes, latency tails and rising dead air. A nightly batch can find the same faults, but only after a day of affected callers. A streaming rule can page in minutes.
Which failures does batch monitoring catch that real-time misses?
Batch monitoring catches failures that need the call read in full: wrong answers, skipped disclosures, policy failures, PII leakage, tool calls that logged success but did the wrong thing, and slow drift. Counters show none of these. A judge scoring finished calls with evidence can.
Do I need both real-time and batch monitoring?
Most production voice agents do. Streaming rules shorten detection delay for outages and tool failures. Batch judging gives recall on quality failures. The split follows the cost of delay and whether a rule can detect the failure from events alone. A very low-volume agent may start with batch and add a few stream rules.
How fast is real time for voice agent monitoring?
Seconds to minutes, not milliseconds. Twilio's docs say gateway metrics are generated every ten seconds and call events typically arrive within 90 seconds. A page rule also waits for a window and a minimum count. Your effective delay is that window plus any pipeline lag. Measure it from your own data.
Can monitoring fix a call while it is in progress?
No. Monitoring tells a human or a rule that something is wrong. It does not rewrite the call. Changes during a call belong inside your own agent or in a kill switch you control. Evalgent's monitoring works on pushed recordings and never sits in the media path, so it cannot touch a live call.
How do I monitor the batch pipeline itself?
Alert on freshness. Prometheus suggests a staleness threshold of at least two full runs of the batch job. If judged output is older than that, page or ticket. Also count calls ingested against calls received, and test that alerts reach a person. A silent batch failure looks like a quiet day.
The bottom line
Real time voice agent monitoring shortens the time to notice outages and tool failures, while batch monitoring finds the wrong answers and policy failures that counters never see. Price each signal by the cost of delay, stream what a rule can detect, batch what needs reading, and alert on the batch lane's own freshness.
Related Articles

How to automate voice agent testing: synthetic callers vs manual QA
Learn how ai test automation replaces manual QA for voice agents. Compare synthetic callers vs human testers, with a 5-step framework to scale without hiring.
Read more
AI Agent Testing vs Voice Agent Testing: What General Tools Miss for Voice
AI agent testing measures text outputs. Voice agent testing measures behaviour through an acoustic pipeline. Five failure categories general tools miss.
Read more