Test your voice agent
Detecting Metric Drift in Voice Agents
# Detecting metric drift in voice agents
> Quick answer: Voice agent metric drift is the slow decline in a voice agent's quality when models, prompts, caller mix, or seasonality shift underneath a fixed baseline. You detect it by tracking task success, containment, latency, and word error rate against control limits, then alerting when a rolling window breaks the expected range.
A voice agent rarely fails all at once. It slips. The number you signed off on last quarter still sits in a report, but the agent your callers reach today behaves differently. Nobody shipped a worse agent on purpose. The quality drifted while everyone looked elsewhere.
This is the hard part of running voice agents in production. A benchmark tells you how the agent looked on one day. It says nothing about tomorrow. To catch decline early, you need to watch the right metrics and treat their movement as a signal, not noise.
This piece explains what metric drift is, what causes it, which metrics move first, and how to detect it with simple statistics. If you are still deciding whether to measure at all, start with our overview of voice agent evaluation, then come back for the detection mechanics.
What voice agent metric drift is
Drift is change you did not plan and did not notice. The agent keeps answering calls. The dashboards keep updating. Yet the relationship between what callers ask and what the agent does has moved.
> Voice agent metric drift: a gradual, unplanned change in a voice agent's measured quality, caused by shifts in its models, prompts, caller population, or timing. The code may be untouched, yet the numbers move.
The academic name for the root cause is concept drift. The mapping from inputs to correct outputs changes over time, so a system that scored well on old data degrades on new data. Your callers ask new questions. Products change. The agent did not get worse in code. It got worse in the field.
Drift matters because it is invisible by default. A crash pages someone. A slow, three-point drop in task success over six weeks pages no one. It hides inside normal variation until a caller complaint or a churn spike makes it loud. By then the gap is wide.
What causes voice agent metric drift
Drift has sources. Naming them helps you look in the right place when a metric moves. A production voice agent has several layers, and each one shifts on its own schedule.
Model and speech updates. The provider behind your language model or speech recognition ships an update. Accuracy on your specific accents, names, or jargon can change overnight. You did not touch anything, but the inputs now map to different outputs. We cover this failure mode in depth in LLM updates and regression in voice agents.
Prompt and flow edits. Someone fixes one edge case in a prompt. The fix quietly breaks three other paths. A new branch in the call flow changes how the agent handles a common intent. These are changes you can see in a diff, yet teams rarely re-test the whole agent after each one.
Changing caller mix. A new marketing campaign brings a different caller population. A product launch adds questions the agent has never heard. The agent did not change, but the distribution of calls did. Metrics that held for the old mix sag for the new one.
Seasonality. Call patterns swing with the calendar. Holidays, billing cycles, and weekday-versus-weekend traffic all reshape volume and intent mix. This seasonality is predictable, but if you ignore it, normal weekly swings look like drift and real drift hides inside them.
Infrastructure and load. Concurrency spikes at peak hours. Latency climbs. A caller who waits too long hangs up or interrupts, and downstream metrics suffer even though the agent's logic is fine.
Each cause leaves a different fingerprint. That is what makes detection tractable. You do not chase every number at once. You match the metric that moved to the cause most likely behind it.
Which voice agent metrics drift first
You cannot watch everything. Pick a small set of metrics that move early and mean something. Four earn their place on almost every voice agent.
Task success rate. The share of calls where the agent completed the caller's actual goal. This is the outcome metric. It drifts when the model changes, when the caller mix shifts, or when a prompt edit breaks a path. It is the number executives care about, so it belongs at the top of the board.
Containment rate. The share of calls the agent handled without escalating to a human. Containment is easy to misread, which is why we separate it from containment versus deflection. A rising containment rate can look like a win while task success falls, meaning the agent is trapping callers rather than helping them. Watch the two together.
Latency. The time between a caller finishing a turn and the agent responding. Track a high percentile, such as p95, not the average. Averages hide the slow tail that frustrates callers. Latency drifts with load, model changes, and added flow complexity.
Word error rate. The share of words the speech recognition got wrong, usually written as WER. It drifts when the speech model updates, when the caller mix brings new accents, or when call audio quality changes. WER is a leading indicator. It moves before task success does, because bad transcription poisons everything downstream.
Together these four cover the outcome, the routing, the experience, and the input quality. For a fuller board that ties metrics to owners and thresholds, see the voice agent metrics scorecard.
Drift cause, metric signal, and how to detect it
Detection gets easier when you map causes to signals. The table below pairs the most common drift causes with the metric that moves first and the method that surfaces it.
| Drift cause | Metric signal | How to detect it |
|---|---|---|
| Model or speech update | Sudden step in WER or task success | Compare pre-update and post-update windows against control limits |
| Prompt or flow edit | Containment dips on the affected intents | Segment metrics by intent and by version tag |
| Changing caller mix | Task success falls for new caller segments | Slice metrics by segment and watch each cohort trend |
| Seasonality | Predictable weekly or holiday swings | Model the pattern with a moving average baseline |
| Infrastructure and load | p95 latency climbs at peak hours | Track latency on a time-of-day control chart |
The pattern is consistent. A step change points to a deployment or an update. A slope points to a shifting caller mix or slow degradation. A repeating wave points to seasonality. Read the shape of the change, then look for the cause that produces that shape.
Statistical detection: baselines, control limits, and windows
Watching a raw metric wiggle does not tell you much. Every metric moves a little every day. Detection means separating meaningful change from ordinary noise. Borrow the tools that manufacturing has used for a century.
Set a baseline
A baseline is the metric's normal behavior, measured over a stable period. Compute its mean and its variation. This is your reference. Everything after gets judged against it. Rebuild the baseline only when you make a deliberate, tested change, not every time a number wobbles.
Use control limits
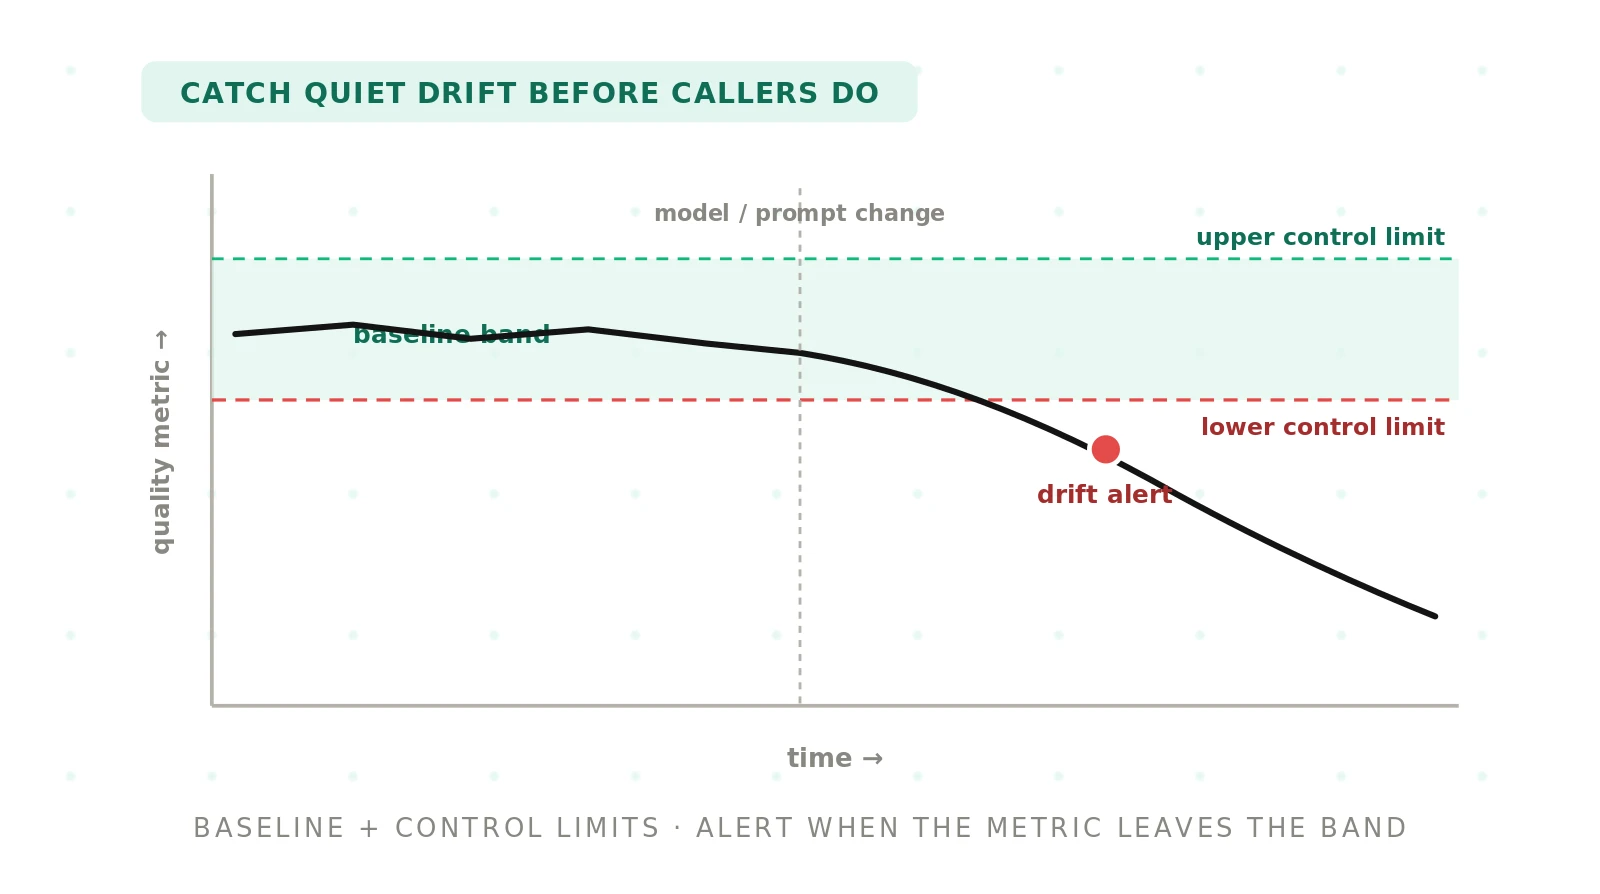
Statistical process control treats a metric like a process with expected variation. A control chart plots the metric over time with an upper and lower control limit, usually set three standard deviations from the mean. A point inside the limits is noise. A point outside, or a run of points trending one way, is a signal worth investigating.
> Control limits: the boundaries of a metric's expected variation, set from its baseline. A value inside the limits is normal noise. A value outside signals a change in the underlying process.
Smooth with a rolling window
Single days are jumpy. A moving average over a rolling window, say seven or fourteen days, smooths the jitter and exposes the trend. The window trades speed for stability. A short window reacts fast but cries wolf. A long window is calm but slow. Match the window to how fast the metric matters.
Account for seasonality
If your calls swing by day of week, compare like with like. Measure this Monday against a baseline of Mondays, not against the weekend. Otherwise the weekly rhythm triggers false alarms and buries the real signal. Modeling the season is what lets a threshold stay tight without firing every Friday.
Treat outliers as anomalies
Some drift shows up as a sudden break rather than a slow slope. Anomaly detection flags points that fall far outside the expected pattern. Pair it with control charts. The chart catches slow trends. The anomaly check catches abrupt steps, like the morning after a model update.
These methods are simple on purpose. You do not need a research team. You need a baseline, control limits, a rolling window, and a rule for what counts as an alert.
Telling real drift from noise
The hardest judgment in drift detection is not spotting a moved number. It is deciding whether the move is real. Three habits keep you honest.
Require persistence. One bad day is noise. A metric outside its control limits for several consecutive windows is drift. Set your alert to fire on a run, not a single point. This alone removes most false alarms.
Check the sample size. A containment rate computed from forty calls swings wildly by chance. The same rate from four thousand calls is stable. Small segments look like they drift constantly. Weight your confidence by volume, and widen the limits for thin segments.
Correlate with events. Keep a log of deployments, prompt edits, and provider updates. When a metric breaks its limits, check the log first. A signal that lines up with a known change is easy to explain. A signal with no matching event is the one that needs a real investigation.
Real drift is persistent, statistically clear, and often traceable to an event. Noise is transient, small, and random. When you are unsure, the honest move is to gather one more window before you act.
How to set up voice agent drift detection
Standing up drift detection is a short project, not a platform. Follow these steps in order.
1. Choose your metrics. Start with task success, containment, latency at p95, and word error rate. Add domain-specific outcomes only after the core four are stable.
2. Build a baseline. Measure each metric over a stable period with no deployments. Record its mean and standard deviation. This is your reference for every future comparison.
3. Segment the data. Split metrics by intent, caller segment, and agent version. Aggregate numbers hide drift that hits one slice hard while the whole holds steady.
4. Set control limits. Draw upper and lower limits from the baseline, typically three standard deviations out. Adjust for seasonality so weekday and weekend get judged separately.
5. Pick a rolling window. Choose a seven or fourteen day moving average for trends. Use a shorter window for latency, which needs faster reaction than accuracy metrics.
6. Define alert thresholds. Fire an alert when a metric stays outside its limits for a set run of windows. Require persistence so single-day noise does not page anyone.
7. Route and triage alerts. Send each alert to an owner with the deployment log attached. The first triage question is always whether a known change explains the move.
8. Review and reset baselines. After a deliberate, tested change improves a metric, rebuild that metric's baseline. Never reset a baseline just to silence an uncomfortable trend.
Treating drift as a measured, managed risk aligns with the NIST AI Risk Management Framework, which expects ongoing measurement rather than a single sign-off. This gives you a working detector. Detection is the trigger, not the whole answer. Once alerts fire reliably, feed them into a repeatable program, which we cover in continuous voice agent auditing and in monitoring AI voice agents in production.
Where an independent evaluator fits
Drift detection built on your own dashboards has a blind spot. The team that ships changes is the team that judges whether they caused harm. That is a hard place to stay objective. An independent evaluator like Evalgent runs the detection on a separate track, using your real calls and a fixed method, so the baseline and the thresholds are not quietly moved to make a bad week look normal. To see how independent testing scores against your own data, read benchmarking voice agents on your own data.
Independence also helps with the persistence question. An outside audit runs on a schedule you do not control, so it catches slow drift that an internal team, busy with the next feature, would postpone investigating. The value is not distrust of your team. It is a second set of numbers computed the same way every time.
Frequently asked questions
How do I detect metric drift in a voice agent?
Track a small set of metrics against a baseline. Set control limits from that baseline, smooth each metric with a rolling window, and alert when a metric stays outside its limits for several consecutive windows. Require persistence so single-day noise does not trigger a false alarm, and check the deployment log first when a signal fires.
What causes voice agent metric drift?
Voice agent metric drift comes from four main sources. Model or speech updates change accuracy underneath you. Prompt and flow edits break paths you did not re-test. A changing caller mix brings questions the agent has not handled. Seasonality reshapes call volume and intent. Infrastructure load pushes latency up at peak hours.
Which voice agent metrics drift first?
Word error rate usually moves first, because bad transcription poisons everything downstream. Latency shifts quickly with load and model changes. Task success and containment drift more slowly, since they reflect outcomes that accumulate over many calls. Watching all four together gives early warning without drowning you in signals that rarely mean anything.
How do I set drift alert thresholds?
Base thresholds on the metric's own baseline variation, not a round number. Set control limits about three standard deviations from the mean, then require the metric to stay outside those limits for a run of several windows before alerting. This combination of statistical limits and persistence removes most false alarms while still catching genuine, sustained decline.
How can I tell real drift from noise?
Real drift is persistent, statistically clear, and often traceable to an event. Noise is transient, small, and random. Require a metric to break its limits across several windows before acting. Check the sample size, since small segments swing by chance. Correlate the signal with your deployment log. If nothing explains it, investigate.
How often should I check voice agent metrics?
Compute metrics daily but judge them on a rolling window of seven to fourteen days. Latency deserves faster review, since it reacts within hours to load. Accuracy and outcome metrics move slowly, so daily paging on them wastes attention. The right cadence is continuous collection with alerting tuned to how fast each metric actually matters.
Does seasonality count as metric drift?
Seasonality is predictable variation, not drift, but it is easy to confuse. Weekly rhythms and holiday swings repeat, so model them into the baseline and compare like with like. Judge a Monday against past Mondays. If you ignore seasonality, normal cycles trigger false alarms and real drift hides inside the expected wave, which is the worst of both outcomes.
Can drift detection replace one-time benchmarking?
Drift detection and benchmarking answer different questions. A benchmark scores the agent on a fixed set on one day, which is useful for a launch decision. Drift detection watches the live agent over time and catches decline the benchmark cannot see. Use a benchmark to set the baseline, then use drift detection to defend it.
The bottom line
Voice agents drift quietly, and a one-time score cannot catch it. Pick a few metrics, set control limits from a baseline, and alert only on persistent moves.
Ready to see drift before your callers do? Book a demo to have Evalgent run independent drift detection on your own calls.
Related Articles
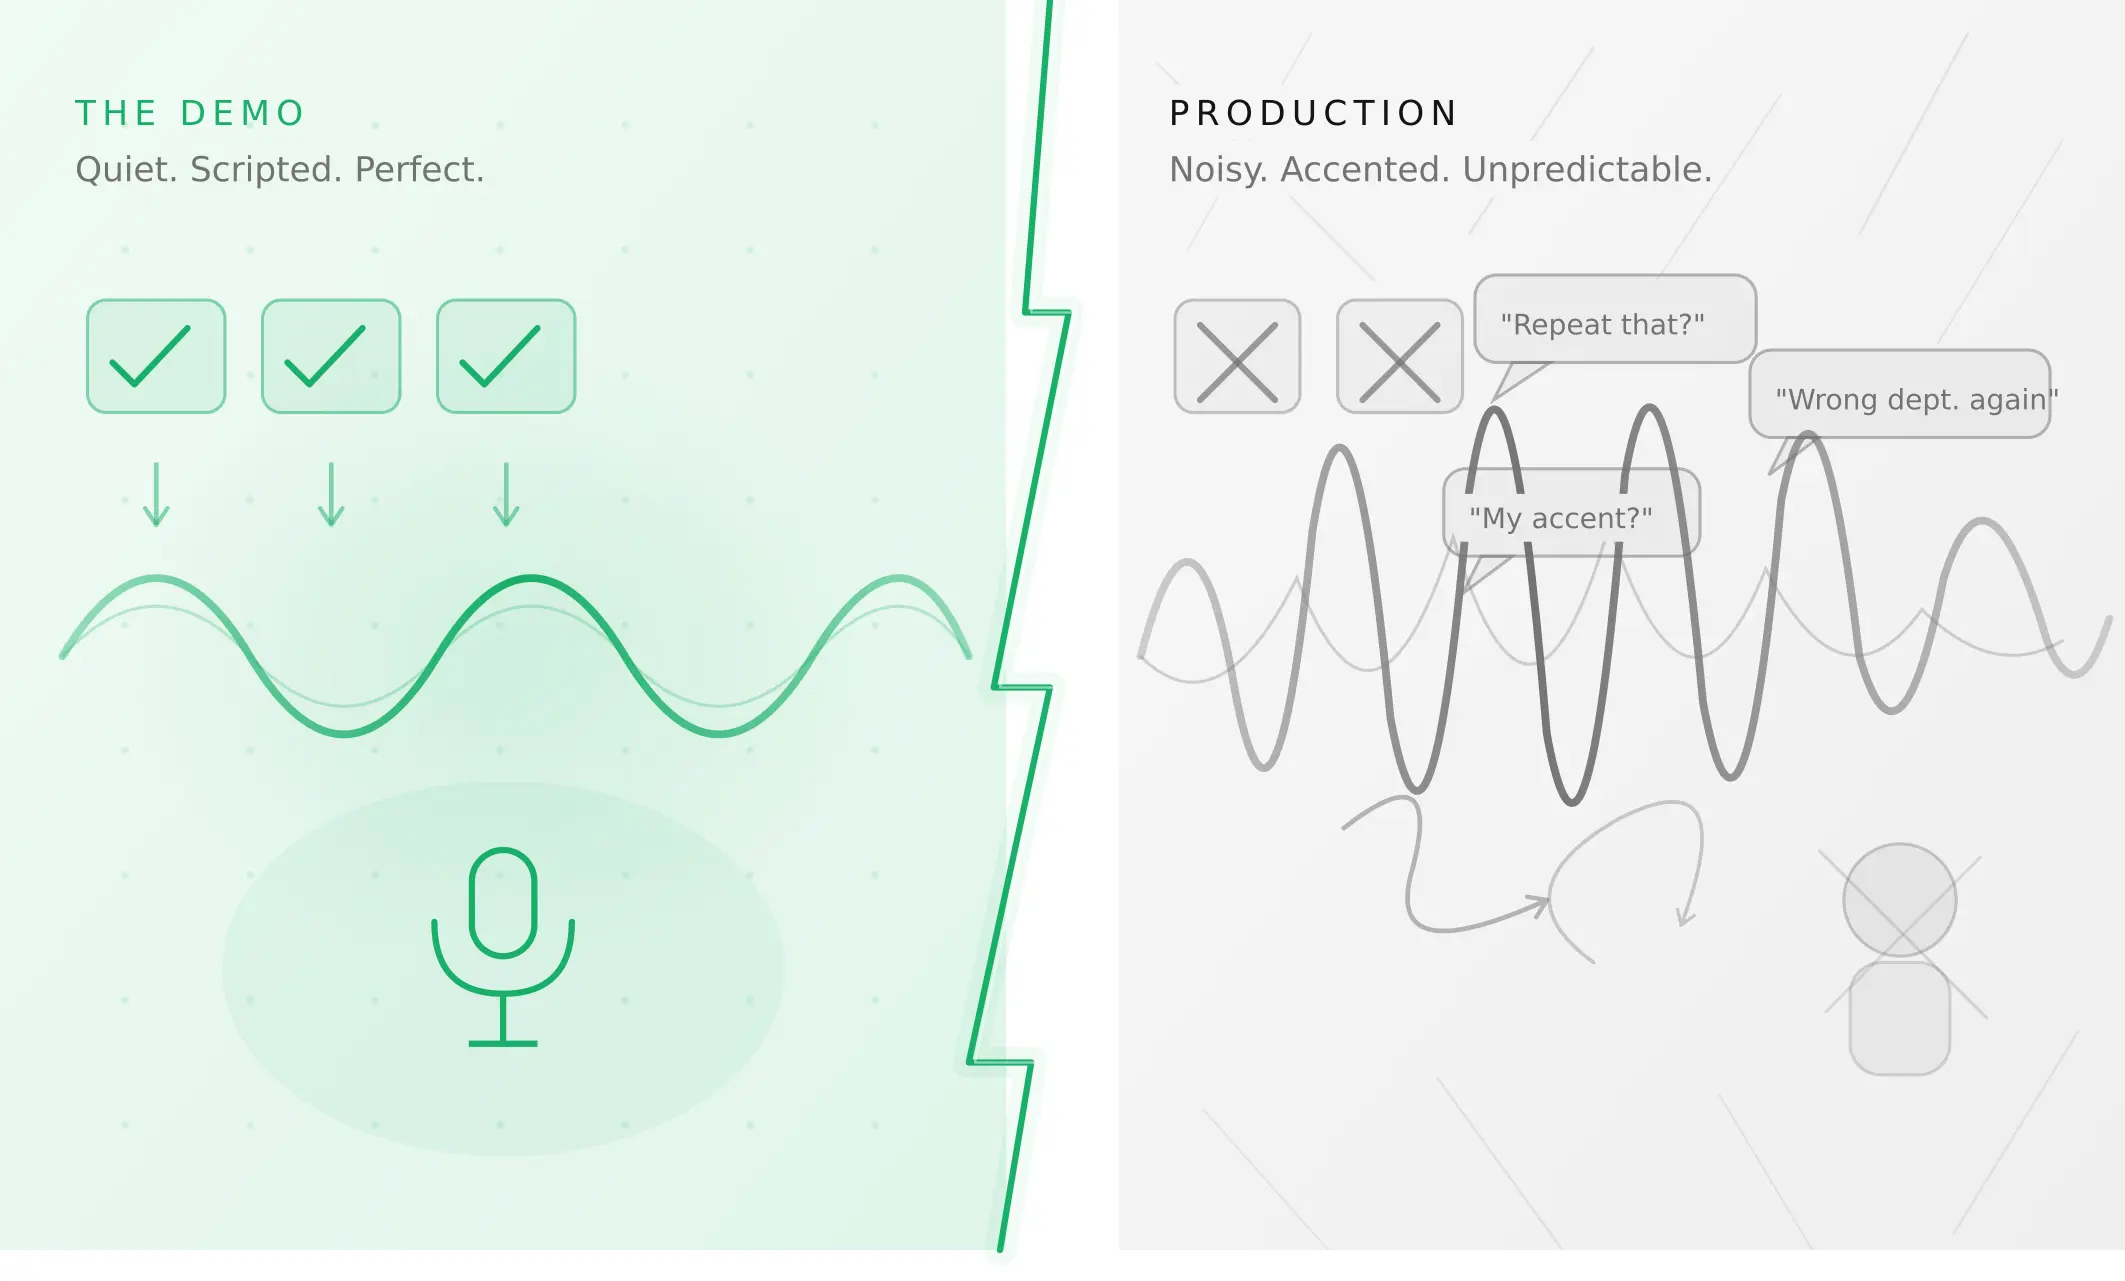
Why AI voice agents fail in production (and how to prevent it)
AI voice agents that ace demos still break in production. Learn the 5 root causes, how to test for each, and what production readiness actually means.
Read more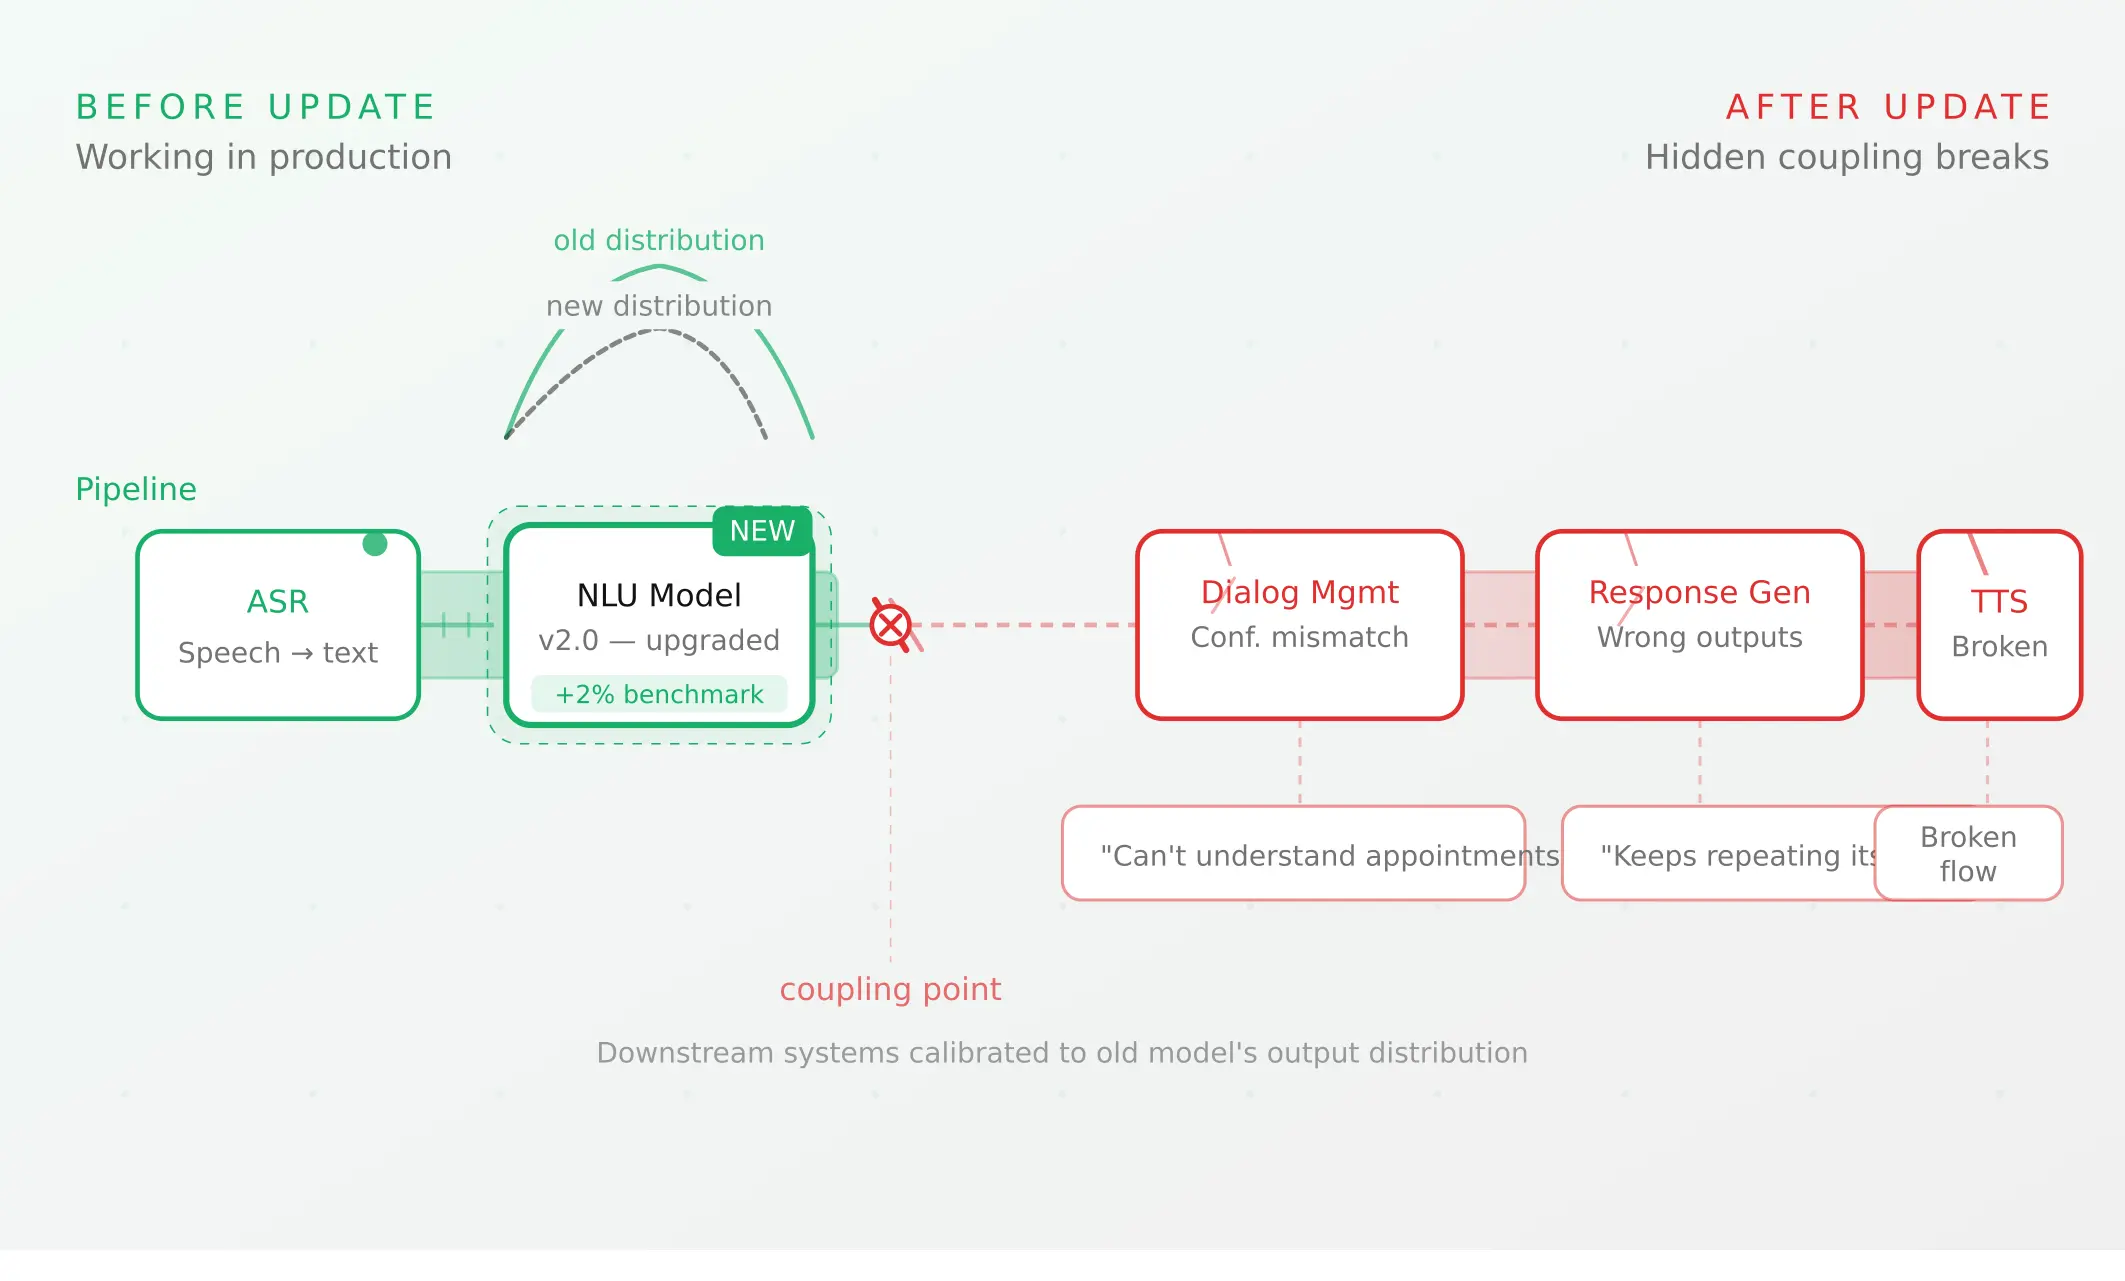
Voice agent regression testing: why LLM updates break production
LLM updates improve benchmarks but break voice agents in 5 predictable ways. How to detect and prevent regressions after every model or prompt change.
Read more