Anomaly Detection for Voice Agent Metrics: Baselines, Seasonality and False Alarms
On this page
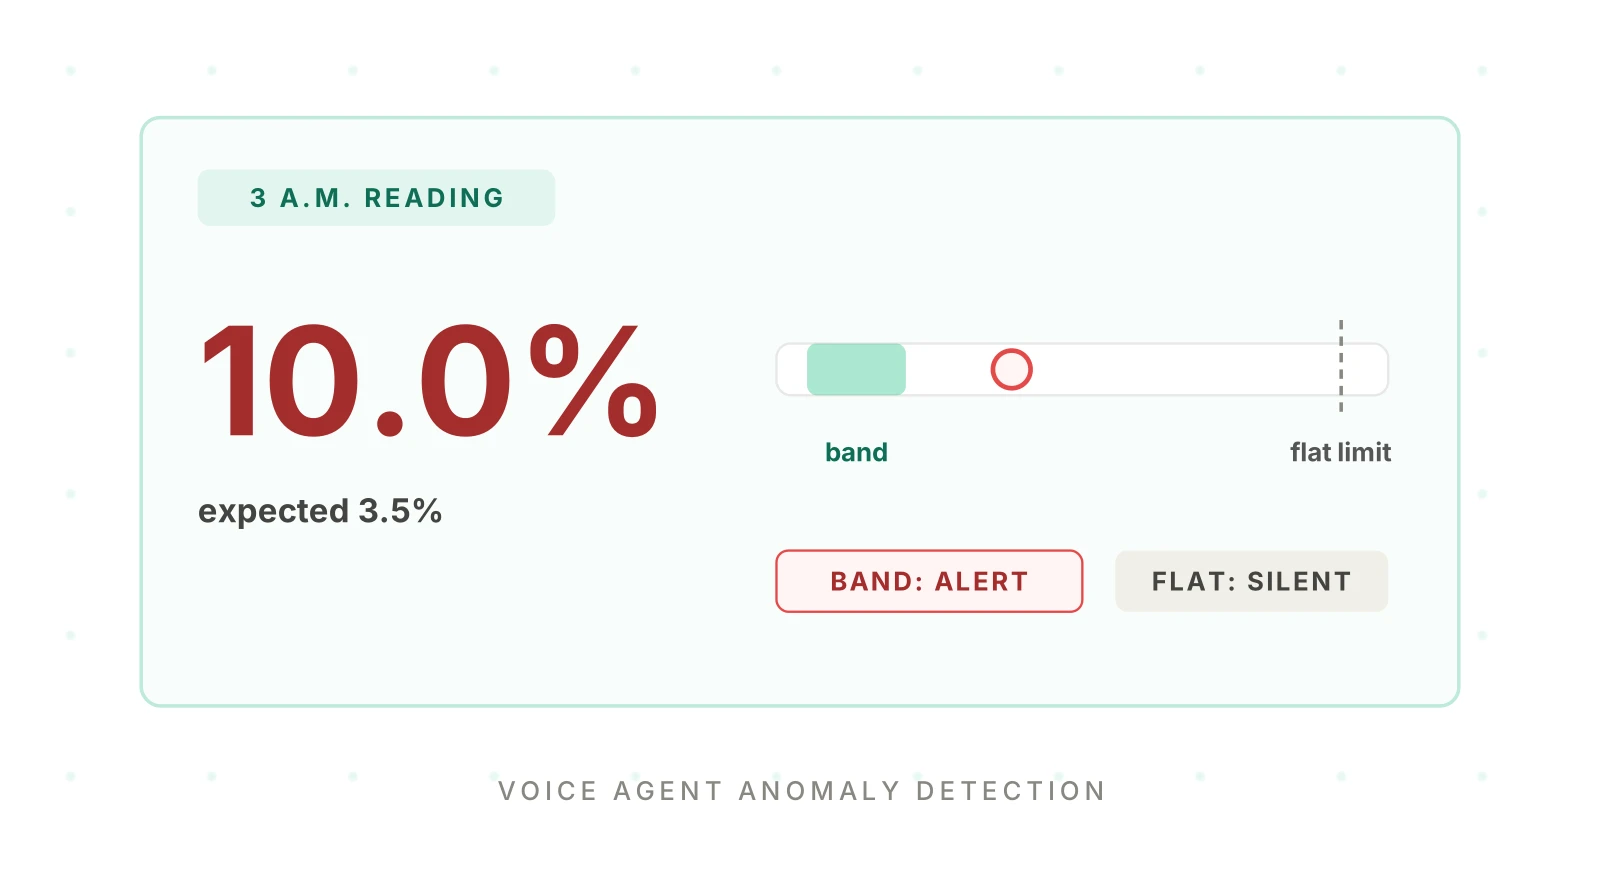
Your dashboard shows escalation rate at 10%. Is that a problem? At 3 a.m. it probably is. At 10 a.m. on a Monday it is below normal. A single static threshold cannot tell the difference, so it either fires every morning or sleeps through the night.
This post is for the team that built and runs its own voice agent inside a larger product. You have a few engineers, one on-call rotation and no QA function. Everything here is method, and every number in a worked example is illustrative. You set your own from your own call history. Facts about third-party tools were checked on November 19, 2026.
This post covers anomaly detection for voice agent metrics, and its angle is narrow on purpose. Four neighbouring posts cover the rest:
- Metric drift covers slow decay of a metric over weeks.
- Metric thresholds covers where to draw static and dynamic limits.
- Prompt regression monitoring covers one release at a time.
- Voice agent alerting covers who gets paged and when.
Voice agent anomaly detection is the step in between. It decides that a single window or short run of windows is unusual for its context, and how to keep the detector honest.
What anomaly detection adds to drift, thresholds and alerting
Voice agent monitoring has four jobs, each with its own tool.
A threshold answers "is this number past a line I chose?" Drift detection answers "has the normal level moved?" Alerting answers "who needs to know, and how loudly?" Anomaly detection answers a different question: "is this window surprising, given when it happened and how many calls it holds?"
That last clause is what makes voice traffic hard. Call volume is not flat. Callers phone in working hours. Human transfer targets exist only when staff are on shift. Outbound campaigns arrive in waves. Billing cycles bring month-end spikes. All of these move your metrics without anything breaking.
So the detector needs two inputs a plain threshold lacks. It needs the expected value for this slot. It also needs the number of calls behind the observation.
The Google SRE Workbook gives four attributes for judging any alerting strategy: precision, recall, detection time and reset time. It defines them as the proportion of detected events that were significant, the proportion of significant events detected, how long notification takes, and how long alerts keep firing after a fix. Use those four as your scorecard for anomaly detection too. Every design choice below trades one against another.
Choose the series before the detector
Detectors are cheap. Bad inputs are expensive, and voice agent anomaly detection fails on inputs first. Spend your first hour on the series, not the algorithm.
Prefer rates with a visible denominator. An escalation rate of 12% means little without "of 80 calls." Store the numerator and the call count together. You will need both.
Split volume anomalies from rate anomalies. A traffic collapse is a different failure from a rise in tool errors. Track call volume as its own series. A rate can look perfect while only a tenth of normal callers get through. The alerting post treats call setup failures and traffic collapse as page-worthy for this reason.
Pick one slice at a time. Intent, tenant, language and prompt version each hide failures in the average. The prompt regression post shows how a release can look fine overall and fail in one intent. Start with the slices that carry revenue or compliance risk. Skip the rest until the first set is quiet.
Use series you can already compute. Good starters are the ones in your metrics scorecard:
- Call volume and answered-call share.
- Latency percentiles, not means.
- Escalation, abandonment and silence rate.
- Tool-call failure rate.
- Judged-call flag rate, such as policy or PII flags.
Evalgent can measure uptime and latency percentiles. Evalgent Monitor also flags tool-call failures, latency spikes, PII leakage and policy failures on production calls, with fix recommendations. Each of those flag counts is a series you can baseline with the method below. The detector itself is yours to own.
Build the baseline: hour of week, not a flat average
A flat baseline averages Monday at 10 a.m. with Sunday at 3 a.m. The result describes neither. Its band is wide enough to hide a real overnight spike and still jumpy enough to fire on ordinary peaks.
The fix is a seasonal baseline. Compare each window to the same slot in past weeks. That means Monday 09:00 against earlier Monday 09:00 windows.
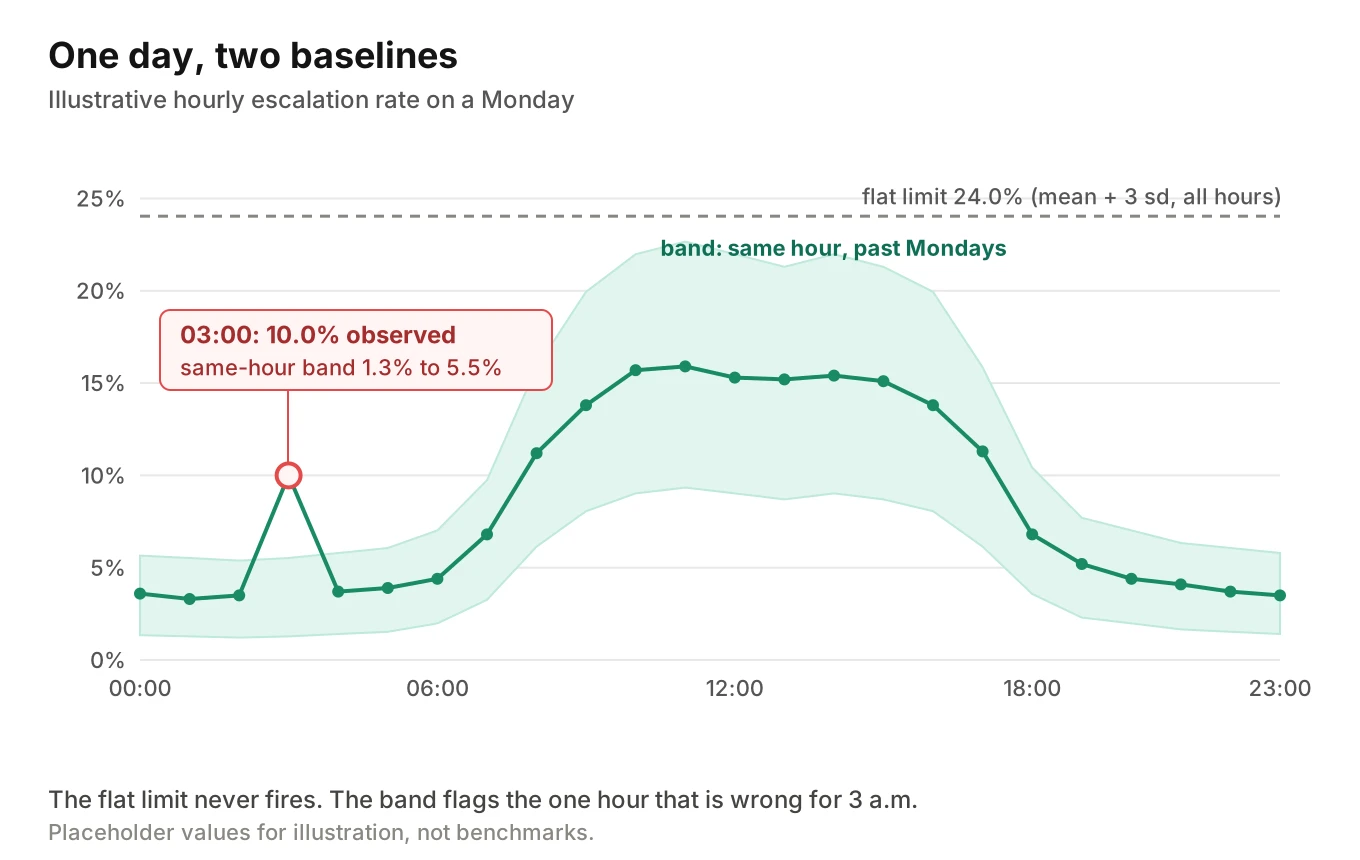
The chart uses placeholder numbers. Over a Monday, escalation climbs in staffed hours and falls at night. A flat limit built from all 24 hours lands at 24.0%, so a 10% reading at 03:00 passes. The same-hour band for 03:00 runs from 1.3% to 5.5%, so the same reading stands out at once.
Real tools build this for you. Their docs show what they assume:
- Amazon CloudWatch's anomaly detection trains on up to two weeks of data and models "hourly, daily, and weekly patterns." It lets you exclude time periods, such as deployments, from training.
- Datadog's anomaly monitors offer a basic algorithm with no seasonality and two seasonal ones. Its docs ask for at least three times the seasonality period as history, so three weeks for a weekly pattern.
- Prophet's documentation says it fits weekly and yearly seasonality by default when the series is more than two cycles long. It takes holidays as a table of dates you supply.
- Hyndman and Athanasopoulos describe STL decomposition, which splits a series into trend, seasonal and remainder parts. The seasonal part may change over time, and the method can be made robust to outliers.
You do not need a vendor for any of this. A table of expected value and spread per hour of week, refreshed nightly, is a real baseline.
Four rules keep it clean:
Plan for a cold start. Until you have about three weekly cycles, the band is thin evidence. Widen it or keep alerts as tickets.
Exclude known events from training. A bad deploy day or an outage teaches the model that bad is normal. Mark those windows and leave them out, as CloudWatch's exclusion option allows.
Keep a calendar of known events. Campaign launches, holidays and tenant onboarding all shift volume. Prophet's holiday table is a useful pattern: list the dates and let the baseline learn them.
Baseline per tenant when you run many. A fleet average hides a customer whose normal is different. The multi-tenant testing post explains why shared aggregates mislead.
Pick a detector by failure shape
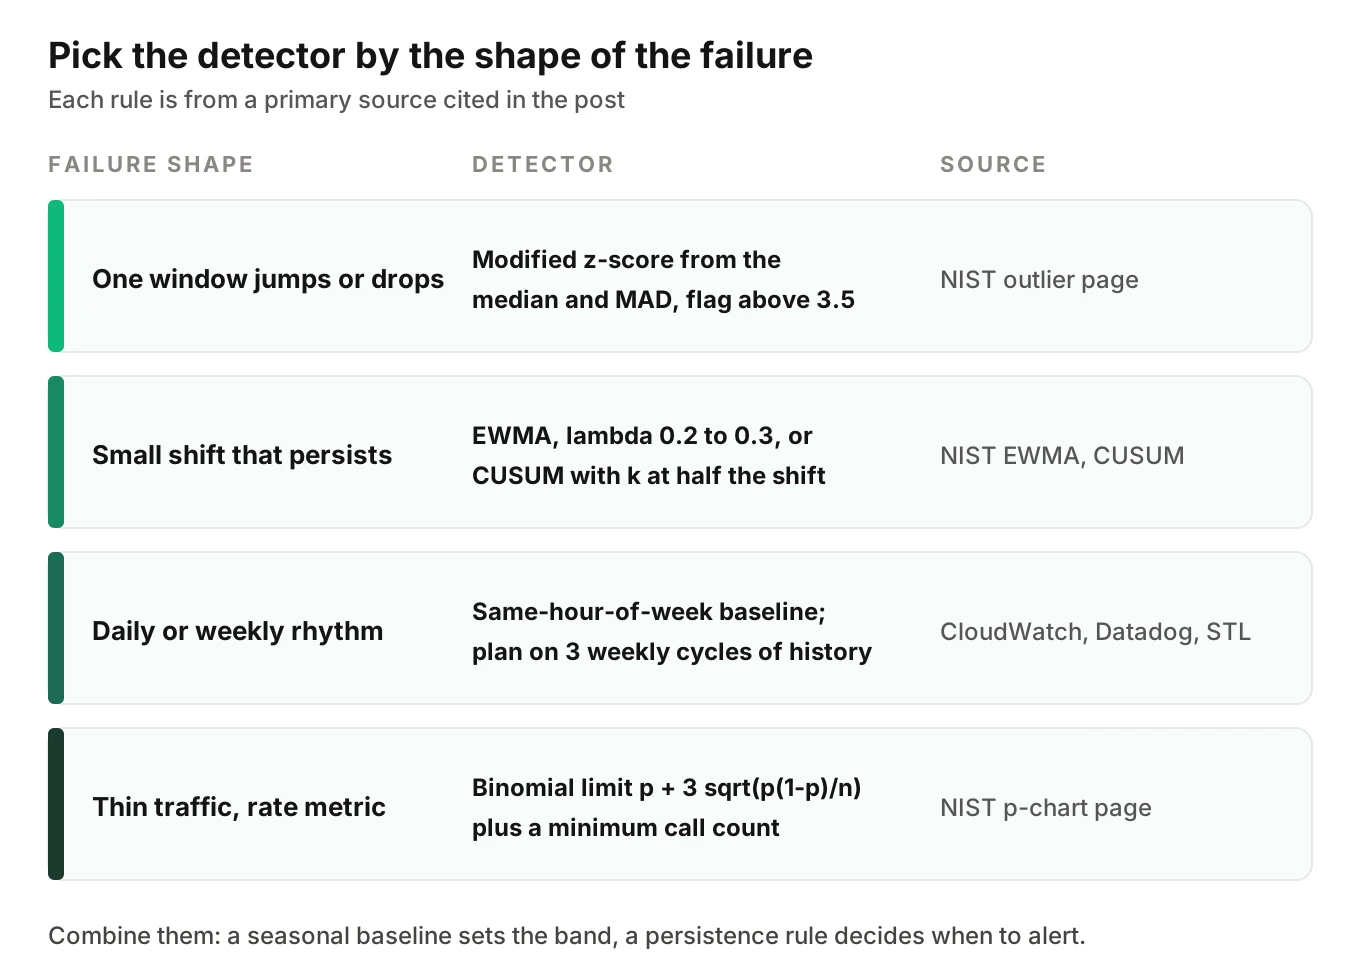
Different failures look different. Match the detector to the shape, not to the tool you already own.
Single-window spikes: the modified z-score
The ordinary z-score uses the mean and standard deviation. A few extreme points inflate both, which can hide the very outliers you want. The NIST handbook's outlier page gives a median-based alternative. The modified z-score is 0.6745 times the distance from the median, divided by the median absolute deviation (MAD). NIST says Iglewicz and Hoaglin recommend labelling scores above 3.5 as potential outliers.
Apply it to the residuals after you remove the seasonal pattern. Good targets are a sudden jump in tool errors or a sharp dip in answered calls. This detector is quick and stateless.
Small shifts that persist: EWMA and CUSUM
A rate that creeps from 4% to 5% will never cross a 3-sigma line in one window. It is still costing you calls. Two charts handle this.
NIST's EWMA chart averages observations with more weight on recent ones. Its formula is the weight lambda times the new value plus one minus lambda times the previous average. NIST says lambda is usually set between 0.2 and 0.3, and calls that choice "somewhat arbitrary." At lambda equal to 1 you are back to a plain single-point chart.
NIST's CUSUM page describes a running sum of deviations from the in-control mean. It is more efficient at detecting small shifts, around two sigma or less. A rule of thumb is to set the reference value k at half the shift you want to catch, and the decision interval h around 4 or 5.
Use these on residuals as well. They are the right tool for slow, real regressions after a model update. They are the wrong tool for a one-hour outage.
Rates on thin traffic: binomial limits
Forty calls at 3 a.m. cannot support a tight limit. The NIST p-chart page gives the upper limit for a proportion as the average rate plus three times the square root of p times one minus p, divided by n. The limit tightens as n grows. That is why one rate can be normal at low volume and alarming at high volume.
Pair this with a hard minimum on call count. Below it, record the window and do not judge it.
Why false alarms pile up
One 3-sigma check is quiet. A fleet of them is not, and voice agent false alarms scale with the number of checks. The count of checks, not the quality of any single check, drives your alert volume.
NIST's control chart page says 3-sigma control limits for a normal distribution are roughly equivalent to 0.001 probability limits. That is about one in a thousand per side when only chance is at work. It also notes that for skewed distributions the risk shifts. For a Poisson count with a mean of 0.8, the upper-limit false-alarm risk rises from 0.001 to 0.009.
Now do the arithmetic with illustrative numbers. Say you watch 12 metrics across 6 intents in hourly windows:
- Checks per day: 12 x 6 x 24 = 1,728.
- One-sided at 0.001: about 1.7 false alarms a day.
- Two-sided at 0.002: about 3.5 a day.
- Skewed rare-event counts at 0.009: about 15.6 a day.
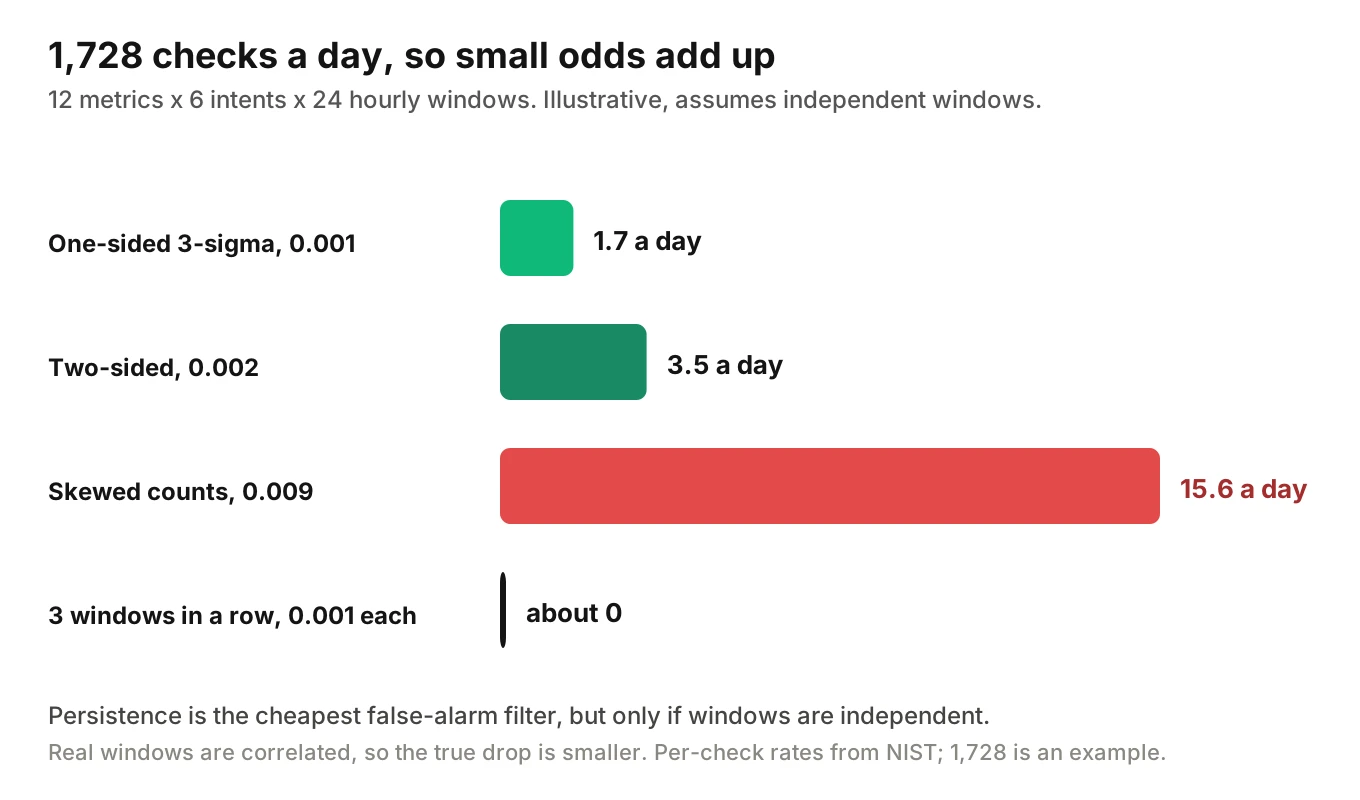
Rare-event series, such as PII flags or tool failures, are the skewed case. They produce the most noise. This is why a team can install a seemingly strict detector and drown within a week.
Cut false alarms without going blind
False positives add to alert fatigue, so voice agent anomaly detection needs filters. Three do most of the work. Each one costs you some detection time, so tune them against the four SRE attributes above.
Persistence. Require several consecutive windows outside the band. Prometheus's alerting rules show the pattern. A for clause keeps an alert pending until the condition holds for the full duration. The same page offers keep_firing_for to stop flapping. If three independent windows must all breach at 0.001, the chance drops to 0.001 cubed. Real windows are correlated, so the true gain is smaller. It is still large.
Minimum calls and minimum bad events. Do not alert on a window with 12 calls. Do not alert on one bad call in a quiet hour. A single bad call belongs in a log. The alerting post covers the low-volume and night cases.
Two windows that must agree. A short window gives speed and a long window gives confidence. Alert when both are outside. The SRE Workbook pairs a long and a short window for the same reason, and notes the short one makes alerts reset sooner.
Add a fourth for known events. Suppress or re-baseline around deploys and campaigns, and label the suppression so you can audit it later.
How to build voice agent anomaly detection in 7 steps
1. Pick three series - Start with call volume, tool-call failure rate and escalation rate. Store the numerator and call count for each.
2. Tag every call - Record prompt version, intent, tenant and time slot. You cannot slice what you did not tag. See call ID correlation for joining records.
3. Build an hour-of-week baseline - Compute the expected value and spread per slot from at least three weekly cycles. Exclude outage and deploy windows.
4. Compute residuals - Subtract the expected value from each window. Run detectors on the residual, not the raw rate.
5. Attach one detector per failure shape - Use a modified z-score for spikes, EWMA or CUSUM for small shifts, and a binomial limit for rates on thin traffic.
6. Add the filters - Set a minimum call count, a persistence rule of several windows and a two-window agreement. Route the result to the right tier from your alert design.
7. Review monthly - Count alerts, count the ones a human acted on, and note any incident the detector missed. Tighten or loosen one setting at a time.
Start in shadow mode for two weeks. Log what would have fired and compare it with real incidents. Only then connect pages.
A worked example with illustrative numbers
Assume a rate that normally sits at 3% for a given slot. Compare two slots, with the same observed rate of 10%.
| Slot | Calls (n) | Baseline rate | Upper limit | Observed | Verdict |
|---|---|---|---|---|---|
| Sunday 02:00 | 40 | 3% | about 11.1% | 4 of 40 = 10% | Inside the limit |
| Sunday 02:00, busier week | 400 | 3% | about 5.6% | 40 of 400 = 10% | Outside the limit |
The limit is p plus 3 times the square root of p(1-p)/n, from the NIST p-chart. At n = 40 it is 0.03 + 3 x 0.027, or about 11.1%. At n = 400 it is 0.03 + 3 x 0.0085, or about 5.6%. The same 10% reads as chance in one case and as a clear signal in the other.
The normal approximation is rough at counts this small. That is a second reason for a minimum call rule. It is also why the first table row should wait for another window instead of paging.
Voice agent anomaly detection also needs persistence. Suppose the 40-call slot repeats at 10% for three nights in a row. Even with limits that wide, a run of three is worth a ticket. Persistence turns a doubtful single window into usable evidence.
Triage: what to check when the band breaks
When voice agent anomaly detection fires, it says the window is unusual. It does not say why. Check in this order, and stop at the first hit.
- Did anything change? Look at deploys, prompt edits and provider updates in your change log.
- Did the mix change? A new campaign or tenant shifts intents and caller types.
- Did a provider fail? Compare speech-to-text, LLM and text-to-speech error series. The provider outage post covers failover.
- Is it one slice? Split by intent, tenant and prompt version before you call it global.
- Is it real? Open a handful of flagged calls and read the trace, transcript and tool payloads.
When you suspect the agent and not the callers, hold the callers constant. Re-run the same scenario set under fixed Evalgent Profiles. A Profile sets interruption level, speech pace, language, response delay, behaviour, accent and background noise. If the agent fails the same scenarios it passed last week, the change is on your side. Evalgent Reviews replay test calls with audio and transcript together and show exact tool payloads, which helps you read why.
Where Evalgent fits
Evalgent is a testing, evaluation and monitoring platform for voice agents. Monitor is live. It works on production calls and flags tool-call failures, latency spikes, PII leakage and policy failures with fix recommendations. Those flags make good input series for the voice agent anomaly detection in this post.
The baseline, the band and the paging rules stay in your stack. Evalgent works with teams to set up evals and monitoring for their first agent. It is not self-serve. If you want to talk through your own series, book a short call.
What can go wrong
The baseline learns the bug. If a regression lasts weeks, a rolling window baseline absorbs it. Freeze a reference period, or compare against the pre-release window as well.
Seasonality changes. A new campaign, a new region or a staffing change alters the weekly shape. Refresh the baseline on a schedule and after known events.
Too many slices. Each new slice adds checks and false alarms. Add slices only when you have the volume and a person to act on them.
Judged flags are not truth. A flag rate from an automated judge has its own error. Treat a spike as a reason to look, and keep a human in the loop on the verdict.
No ground truth for misses. You only know the detector missed something when an incident is found another way. Keep a short log of misses and use it in the monthly review.
For wider monitoring context, see monitoring AI voice agents in production, service level objectives and sampling live calls.
Frequently asked questions
What is voice agent anomaly detection?
It is the practice of flagging a metric window that is unusual for its time slot and call volume. It compares each window to a seasonal baseline, then applies a detector, a minimum call count and a persistence rule. The goal is to catch real regressions while keeping false alarms low enough that the team trusts the pager.
How is anomaly detection different from threshold alerts?
A threshold is a fixed line you pick. Anomaly detection derives the expected range from history, per hour of week, and widens or narrows it with call volume. Thresholds still have a place for hard limits such as zero answered calls. Use anomaly detection where normal changes through the day and week.
How much history do I need for a seasonal baseline?
Plan on about three weekly cycles. Datadog's documentation asks for at least three times the seasonality period, and Prophet fits weekly seasonality when a series is more than two cycles long. Before that, widen the band or route alerts to a ticket instead of a page.
Which detector should I start with?
Start with a seasonal baseline and a modified z-score on the residuals, because it is simple and handles spikes. Add EWMA or CUSUM when you need to catch small persistent shifts. Add binomial limits for rate metrics on thin traffic. Do not add all of them on day one.
How do I avoid false alarms from daily and weekly patterns?
Compare each window to the same hour of week in past weeks. Exclude outages and deploys from training. Keep a calendar of campaigns and holidays. Then require persistence, so one odd window does not page anyone. Review which alerts a human acted on each month.
How many calls do I need before a rate alert is trusted?
There is no universal number. A rate from forty calls swings widely by chance, and the binomial limit widens to reflect that. Set a minimum call count from your own volume, record windows below it without judging them, and test the rule in shadow mode first.
Should an anomaly alert page someone?
Only when callers are being hurt now and a person can act. Most anomalies belong in a ticket or on a dashboard. Page on symptoms such as call setup failures, a provider outage or repeated policy violations. Use your alert tiers to decide, and keep single odd windows in a log.
Can I use Datadog or CloudWatch for this?
Yes, if they already hold your metrics. Both offer anomaly monitors with seasonal models, as their docs describe. You still choose the series, the slices, the minimum call rule and the persistence window. The tool computes a band. You decide what deserves attention.
The bottom line
Voice agent anomaly detection works when each window is judged against its own hour of the week, its own call count and a persistence rule. Start with three series and a seasonal baseline, run it in shadow mode for two weeks, and only then let it page a human.
Related Articles

How to automate voice agent testing: synthetic callers vs manual QA
Learn how ai test automation replaces manual QA for voice agents. Compare synthetic callers vs human testers, with a 5-step framework to scale without hiring.
Read more
AI Agent Testing vs Voice Agent Testing: What General Tools Miss for Voice
AI agent testing measures text outputs. Voice agent testing measures behaviour through an acoustic pipeline. Five failure categories general tools miss.
Read more