Test your voice agent
Voice agent metrics that matter: a scorecard
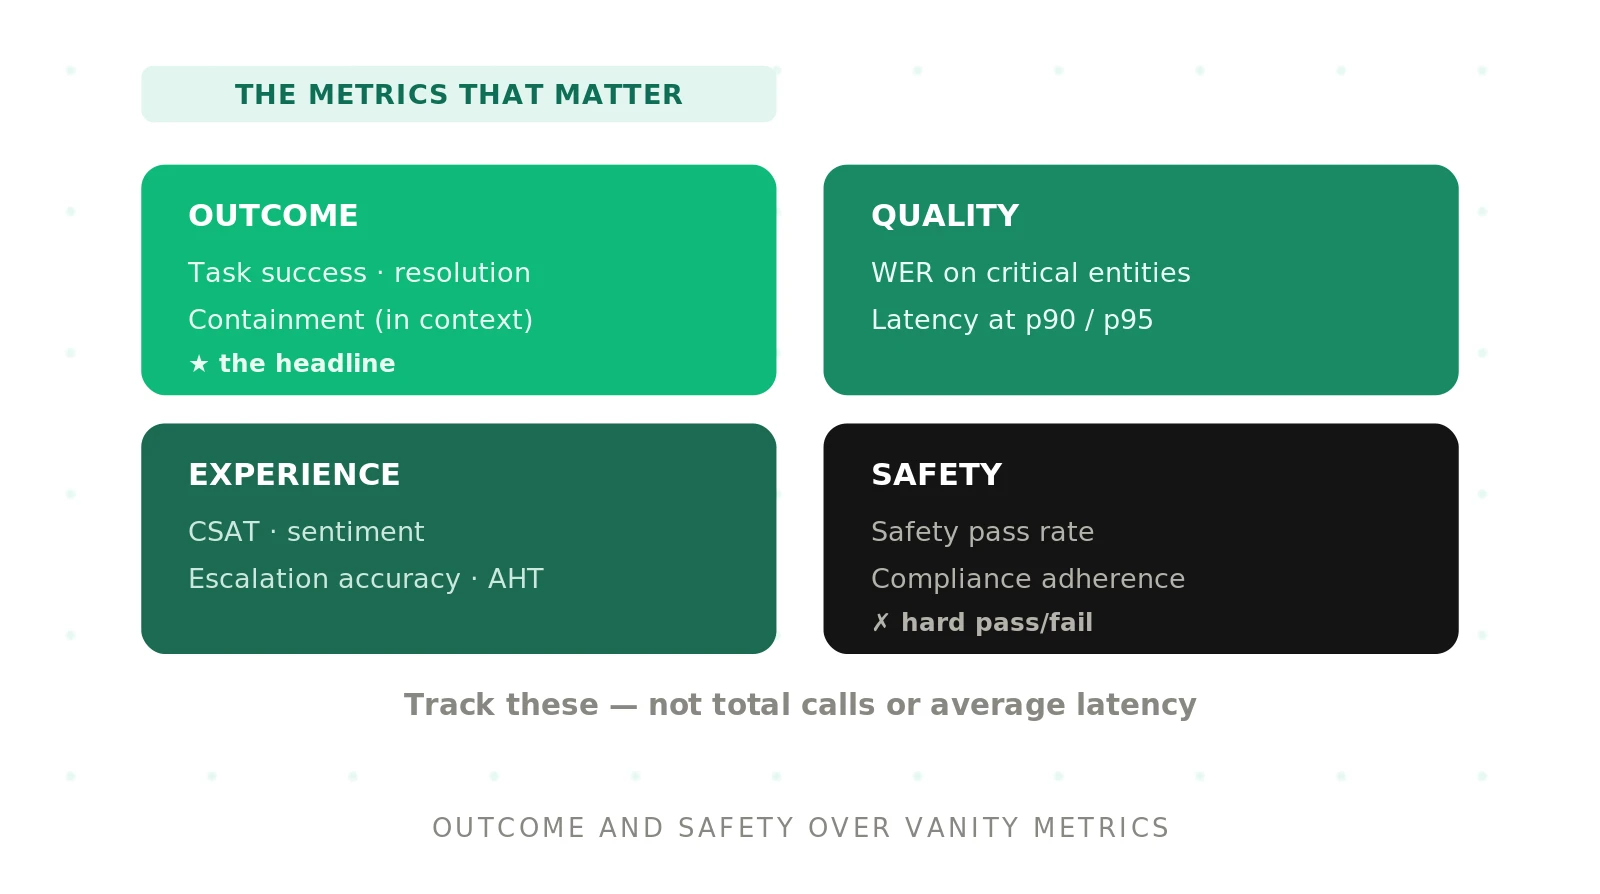
> Quick Answer: A voice agent metrics scorecard tracks four buckets: outcome (task success, resolution, containment), quality (word error rate on critical entities, tail latency), experience (sentiment, escalation accuracy, handle time), and safety (safety pass rate, compliance). Together they show whether the agent actually helps callers.
Most teams measure the wrong things about their voice agents. They count total calls, average latency, and raw containment, then declare success. Those numbers rise even as callers hang up frustrated. A real scorecard connects every metric to whether a caller got helped, safely, in a way they would repeat.
This is the hub guide to the metrics themselves. It defines the universal set that matters for any voice agent, in any industry, and shows why the popular numbers mislead. The goal is a compact scorecard you can defend to a skeptical executive and a nervous compliance officer at the same time.
Why vanity metrics mislead
A vanity metric moves in the right direction while the underlying reality gets worse. It looks like progress because it is easy to count and flattering to report. Three examples dominate voice agent dashboards.
Total call volume is the first. A rising count tells you the phone rang more, not that the agent worked. Volume conflates demand, marketing, and outages with agent quality. A broken agent that traps callers in loops can post record volume.
Average latency is the second. Averages hide the tail. If ninety percent of turns respond in half a second and ten percent stall for eight seconds, the mean looks fine while one caller in ten abandons. The key performance indicator that matters is the slow tail, not the comfortable middle.
Raw containment is the third and most dangerous. Containment counts calls the agent handled without a human. But a call is "contained" whether the caller got a refund or gave up in despair. Optimizing raw containment rewards agents that make escalation hard. We separate helpful containment from trapped callers in our containment versus deflection guide.
The pattern is the same each time. The metric is real, but it answers the wrong question. A scorecard fixes this by pairing each easy number with the outcome it is supposed to represent.
The four buckets of a voice agent scorecard
Every metric worth tracking falls into one of four buckets. Each answers a different stakeholder's question. Outcome answers the business. Quality answers engineering. Experience answers the customer. Safety answers legal and risk.
Balance across all four is the point. An agent can ace one bucket and fail the product. High containment with low safety is a lawsuit. Fast latency with poor task success is a fast way to disappoint people. The scorecard forces you to look at all four together.
Outcome metrics
Outcome metrics measure whether the caller's job got done. This is the bucket that justifies the agent's existence, so it comes first.
Task success rate is the anchor. Define the caller's goal for each scenario, then measure the fraction of calls that reached it. Booking made, balance given, appointment moved. Task success is unforgiving because it ignores effort and counts only the result.
Resolution rate, often called first-call resolution, measures whether the issue was solved without a repeat contact. A caller who calls back the next day was not resolved, regardless of what the first call's transcript claimed. Resolution catches false successes that task success can miss.
Containment belongs here too, but only in its honest form. Track containment alongside post-call satisfaction and callback rate. Containment that comes with high satisfaction is genuine. Containment paired with rising callbacks is a trap dressed as a win.
Quality metrics
Quality metrics measure whether the machinery worked. These are the engineering vitals of the pipeline: did the agent hear correctly and respond in time.
Word error rate measures transcription accuracy, but the average is not what matters. What matters is word error rate on critical entities: names, account numbers, dollar amounts, dates, and medication names. An agent can post a low overall word error rate and still mangle the one account number that routes the whole call.
Latency is the other quality vital, and again the tail is the story. Report the ninety-fifth and ninety-ninth percentile response times, not the mean. Long silences break the illusion of conversation and trigger callers to talk over the agent. The ITU-T G.114 recommendation on one-way delay is a useful anchor for how much lag a human notices in a voice channel.
Instrumenting latency well means tracing each turn end to end, from speech capture through model response to audio playback. Distributed tracing gives you the spans to find where the tail comes from, rather than a single blended number.
Experience metrics
Experience metrics measure how the call felt. A caller can get the right answer and still leave angry if the path there was painful.
Customer satisfaction and turn-level sentiment capture the emotional arc. Sentiment analysis over the transcript shows where frustration spiked, which is often more useful than a single end-of-call score. Watch for calls where sentiment drops and never recovers.
Escalation accuracy is the experience metric teams forget. It measures whether the agent handed off to a human at the right moment, not too early and not too late. A good handoff is worth more than a forced containment. We cover the mechanics in our escalation design guide.
Average handle time rounds out the bucket, but read it carefully. Shorter is not always better. A handle time that drops because callers abandon is a failure. Pair handle time with task success so speed never gets rewarded at the cost of the result.
Safety metrics
Safety metrics measure whether the agent stayed inside the lines. In regulated industries this bucket can outrank every other, because one violation costs more than a thousand happy calls.
Safety pass rate is the headline. Define the behaviors the agent must never exhibit: giving unauthorized advice, disclosing another caller's data, making promises it cannot keep. Then measure the fraction of calls that stayed clean. A structured risk framework helps you enumerate what to test before a caller finds it first.
Compliance rate tracks required behaviors: disclosures, consent capture, identity verification before sensitive actions. This is a positive obligation, not just an absence of harm. Adversarial testing belongs in this bucket too, so you find the jailbreak before a caller does. Loyalty signals such as Net Promoter Score can also flag when safety friction is quietly eroding trust.
Metric scorecard reference table
The table below maps each core metric to what it measures, why it matters, and the vanity trap it replaces.
| Metric | What it measures | Why it matters | Vanity trap it replaces |
|---|---|---|---|
| Task success rate | Fraction of calls that reached the caller's goal | Ties the agent directly to business value | Total call volume |
| Resolution rate | Issues solved without a repeat contact | Catches false successes and hidden callbacks | Raw containment |
| Honest containment | Automated calls paired with satisfaction | Rewards helping, not trapping | Raw containment |
| Critical-entity word error rate | Accuracy on names, numbers, and amounts | One wrong entity breaks the whole call | Average word error rate |
| Tail latency (p95, p99) | Slowest response times callers feel | Slow tails drive abandonment | Average latency |
| Sentiment and CSAT | Emotional arc of the conversation | Right answer, wrong feeling still loses | Thumbs-up counts |
| Escalation accuracy | Handoffs made at the right moment | Prevents forced or premature containment | Escalation volume |
| Safety pass rate | Calls free of prohibited behaviors | One violation outweighs many good calls | Untracked risk |
How to build your voice agent metrics scorecard
Follow these steps to turn the four buckets into a scorecard your team can run every week.
1. List the caller goals. Write down the top jobs callers actually call to accomplish. Each goal becomes a scenario with a clear, binary definition of success. Without this, task success rate has nothing to measure against.
2. Pick one anchor metric per bucket. Choose task success for outcome, critical-entity word error rate for quality, escalation accuracy for experience, and safety pass rate for safety. Four anchors keep the scorecard readable. Add secondary metrics only after the anchors are stable.
3. Replace every average with a distribution. For latency and any timing metric, report the ninety-fifth and ninety-ninth percentiles instead of the mean. The tail is where callers leave, so the scorecard must show it directly.
4. Pair each vanity number with its check. Never show containment without satisfaction next to it. Never show handle time without task success. The pairing makes gaming the metric visible on the same row.
5. Set thresholds before you measure. Decide the passing bar for each anchor in advance, so results cannot be rationalized after the fact. Our production readiness bar offers defensible starting numbers.
6. Segment by scenario and caller profile. A single blended score hides the segments that fail. Break every metric down by scenario type and by caller profile, such as accent, background noise, and channel.
7. Rerun the scorecard on every change. Treat the scorecard as a regression suite, not a launch report. Run it on every model swap, prompt change, and integration update, so you catch drift before callers do.
Reading the scorecard together
The scorecard earns its value in how you read it. A single row never tells the truth. You read the buckets against each other and look for the trade a number is hiding.
Start with outcome. If task success is low, nothing else matters yet. Then check whether quality explains it. A low task success with high critical-entity word error rate points at transcription, not reasoning. Fix the ears before blaming the brain.
Next, read experience against outcome. High task success with low satisfaction means the agent wins arguments and loses customers. That usually shows up as poor escalation accuracy: the agent should have handed off and instead pushed through.
Finally, treat safety as a gate, not a gradient. A safety pass rate below your threshold blocks release regardless of how good the other three buckets look. There is no amount of task success that buys back a compliance violation.
This reading discipline is what separates a scorecard from a dashboard. A dashboard shows numbers. A scorecard tells you what to do next, and in what order. For a deeper walk through the underlying discipline, see our guide to voice agent evaluation.
Applying the buckets to your domain
The four buckets are universal, but the specific metrics within them shift by use case. Customer support weights resolution and sentiment heavily, since the caller arrives already frustrated. Our breakdown of support-specific voice metrics shows how the anchors change.
Collections and outbound work carry a heavier safety and compliance load, because the regulatory surface is larger and the stakes of a wrong statement are higher. The collections voice metrics guide covers the additions that domain needs.
When you evaluate vendors, the same buckets become your comparison frame. Ask each vendor to report task success, tail latency, and safety pass rate under your scenarios, not their averages. Our guide to evaluating voice agent vendors turns the scorecard into a purchasing checklist.
The lesson across domains is constant. The buckets do not change. The thresholds and the weighting do. Set them from your own caller goals, not from a vendor's marketing deck.
Building your scorecard with Evalgent
Evalgent is an independent platform for testing and evaluating voice agents against the metrics that actually matter. It maps directly onto the four buckets through five primitives.
- Scenarios define the caller goals, so task success and resolution have a clear target.
- Profiles simulate real callers with different accents, noise, and channels, so every metric segments properly.
- Metrics capture the anchors across all four buckets, including tail latency and critical-entity word error rate.
- Evaluations run the scorecard as a regression suite on every change, before callers see it.
- Reviews let your team inspect the calls behind the numbers, so a low score points to a real transcript.
Because Evalgent is independent, its scores are not tuned to make any one vendor look good. To see the scorecard run against your own agent, book a demo with our team.
The bottom line
The metrics that matter are not the ones that are easy to count. They are the ones that tie every call to whether a real caller got helped, safely.
Group your metrics into outcome, quality, experience, and safety. Pick one anchor per bucket, replace averages with tail distributions, and pair every vanity number with the outcome it is supposed to represent. Then run the scorecard on every change. That is how you know your agent is getting better, not just busier.
Frequently asked questions
What are the most important voice agent metrics to track?
Track one anchor per bucket: task success rate for outcome, critical-entity word error rate for quality, escalation accuracy for experience, and safety pass rate for safety. These four connect directly to whether callers get helped, safely. Add secondary metrics only after the anchors are stable and trusted by your team.
Why is average latency a misleading voice agent metric?
Averages hide the tail. If most turns respond quickly but one in ten stalls for several seconds, the mean looks healthy while those callers abandon. Report the ninety-fifth and ninety-ninth percentile response times instead. Long silences break the conversation and drive callers to talk over the agent.
What is wrong with using raw containment as a success metric?
Raw containment counts any call handled without a human, whether the caller got a refund or gave up in frustration. It rewards agents that make escalation hard. Track containment alongside post-call satisfaction and callback rate, so genuine self-service is distinguished from callers trapped in loops.
How is task success rate different from resolution rate?
Task success measures whether the caller's goal was reached during the call. Resolution rate measures whether the issue stayed solved without a repeat contact. A caller who calls back the next day was not resolved, even if the first call looked successful. Resolution catches false wins that task success alone can miss.
Why measure word error rate on critical entities instead of overall?
An agent can post a low overall word error rate and still mangle the one account number, name, or dollar amount that routes the entire call. Overall accuracy averages away the errors that break outcomes. Measuring accuracy specifically on names, numbers, dates, and amounts targets the failures that actually matter.
What is escalation accuracy and why does it matter?
Escalation accuracy measures whether the agent handed off to a human at the right moment, neither too early nor too late. A good handoff is worth more than a forced containment. Poor escalation accuracy shows up as high task success with low satisfaction, because the agent pushed through when it should have transferred.
How do safety metrics fit into a voice agent scorecard?
Safety is a gate, not a gradient. Track safety pass rate, the fraction of calls free of prohibited behaviors, and compliance rate for required disclosures and consent. A safety score below threshold blocks release regardless of the other buckets. One violation can outweigh a thousand otherwise successful calls.
How often should I run my voice agent metrics scorecard?
Treat the scorecard as a regression suite, not a launch report. Run it on every model swap, prompt change, and integration update, so you catch drift before callers do. Segment results by scenario and caller profile each run, because a blended average hides the specific segments that are failing.
Related Articles
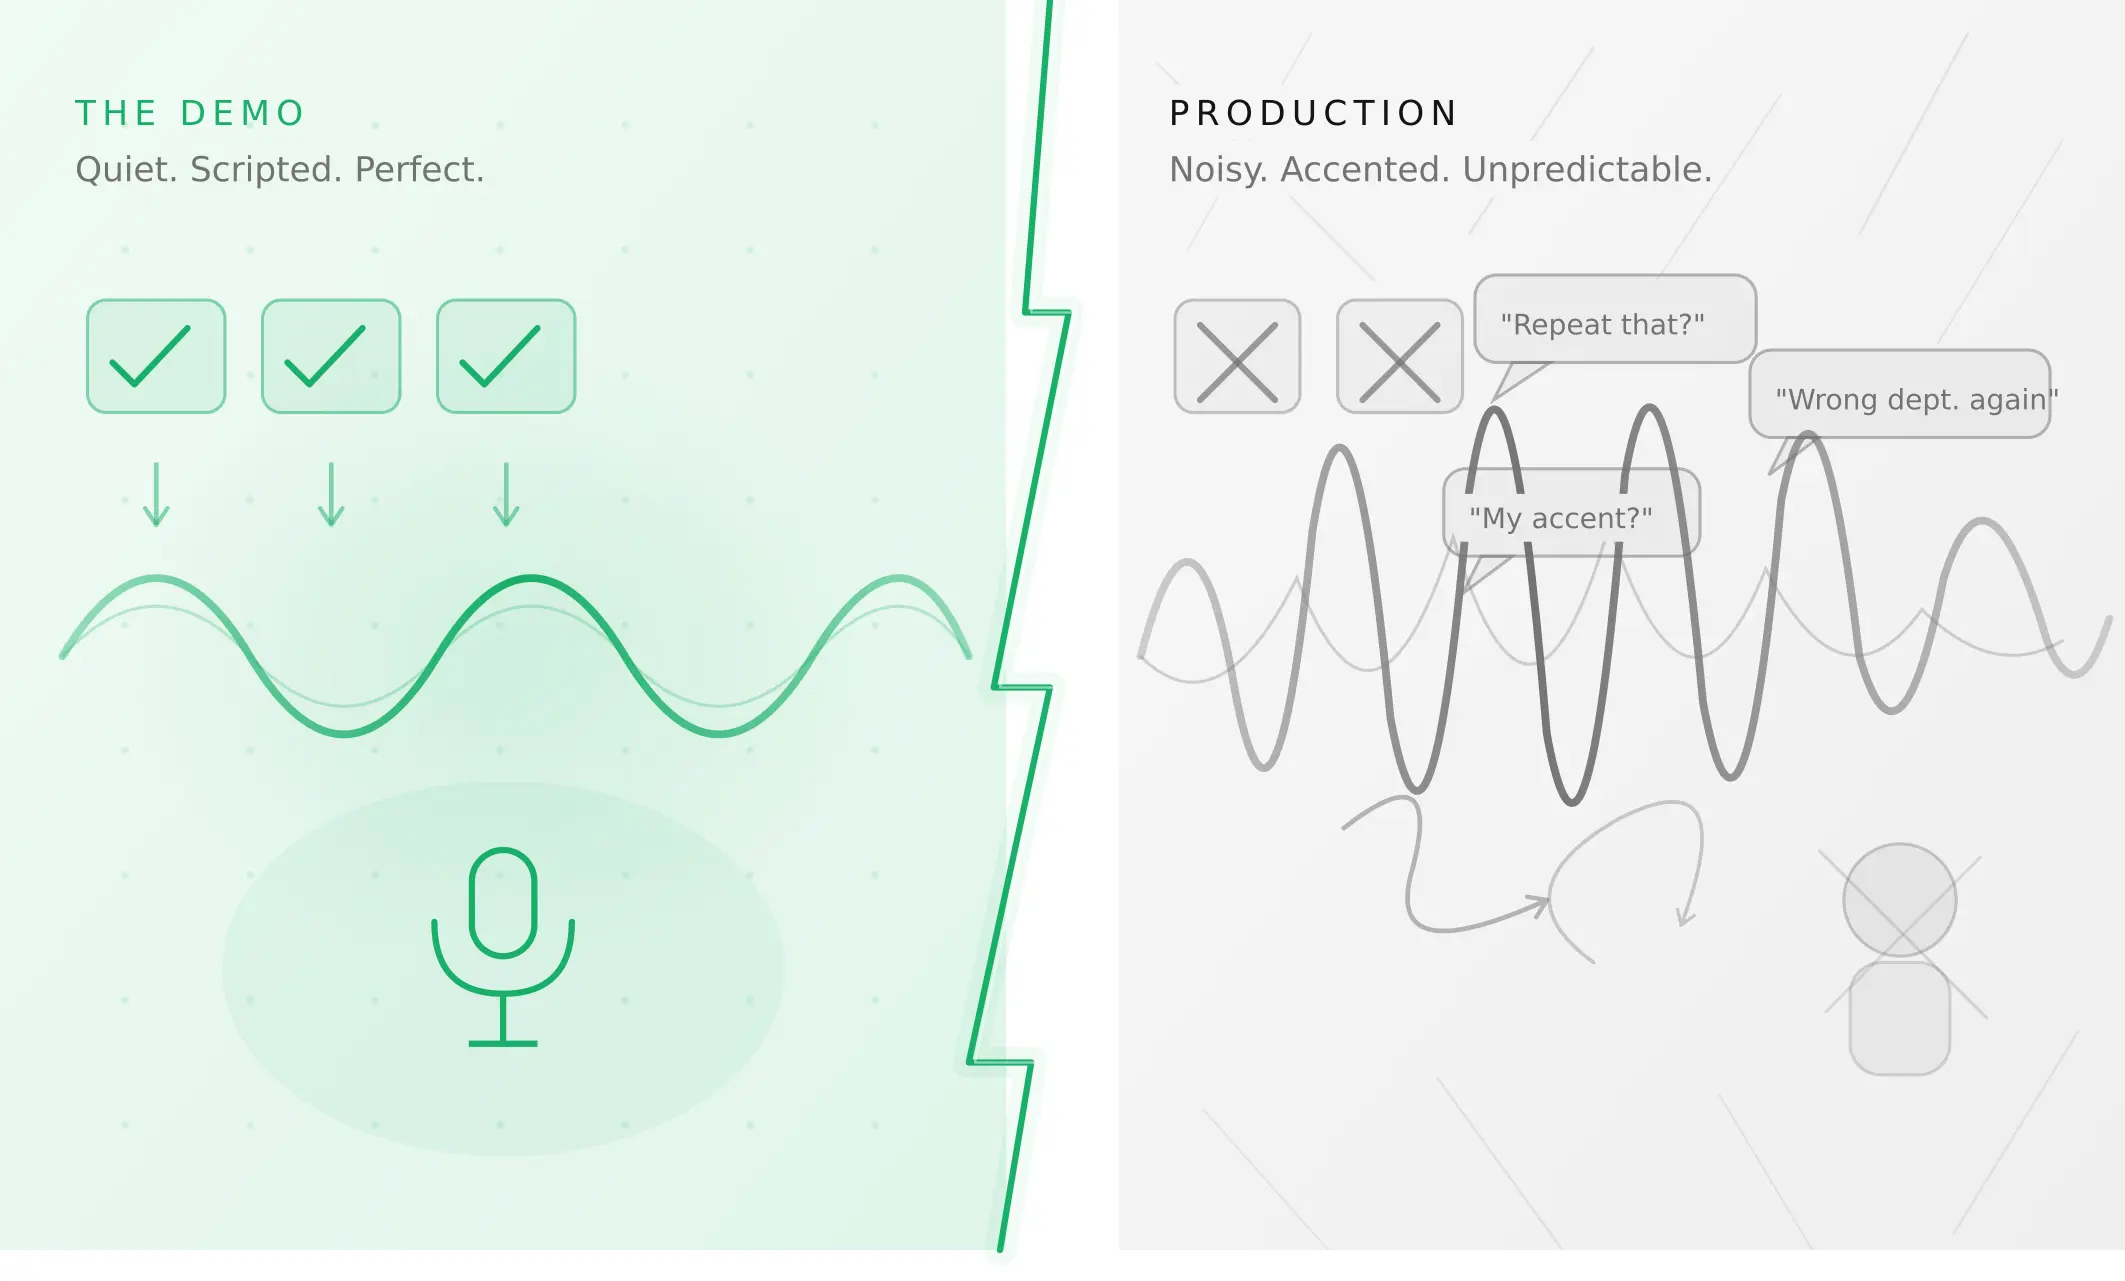
Why AI voice agents fail in production (and how to prevent it)
AI voice agents that ace demos still break in production. Learn the 5 root causes, how to test for each, and what production readiness actually means.
Read more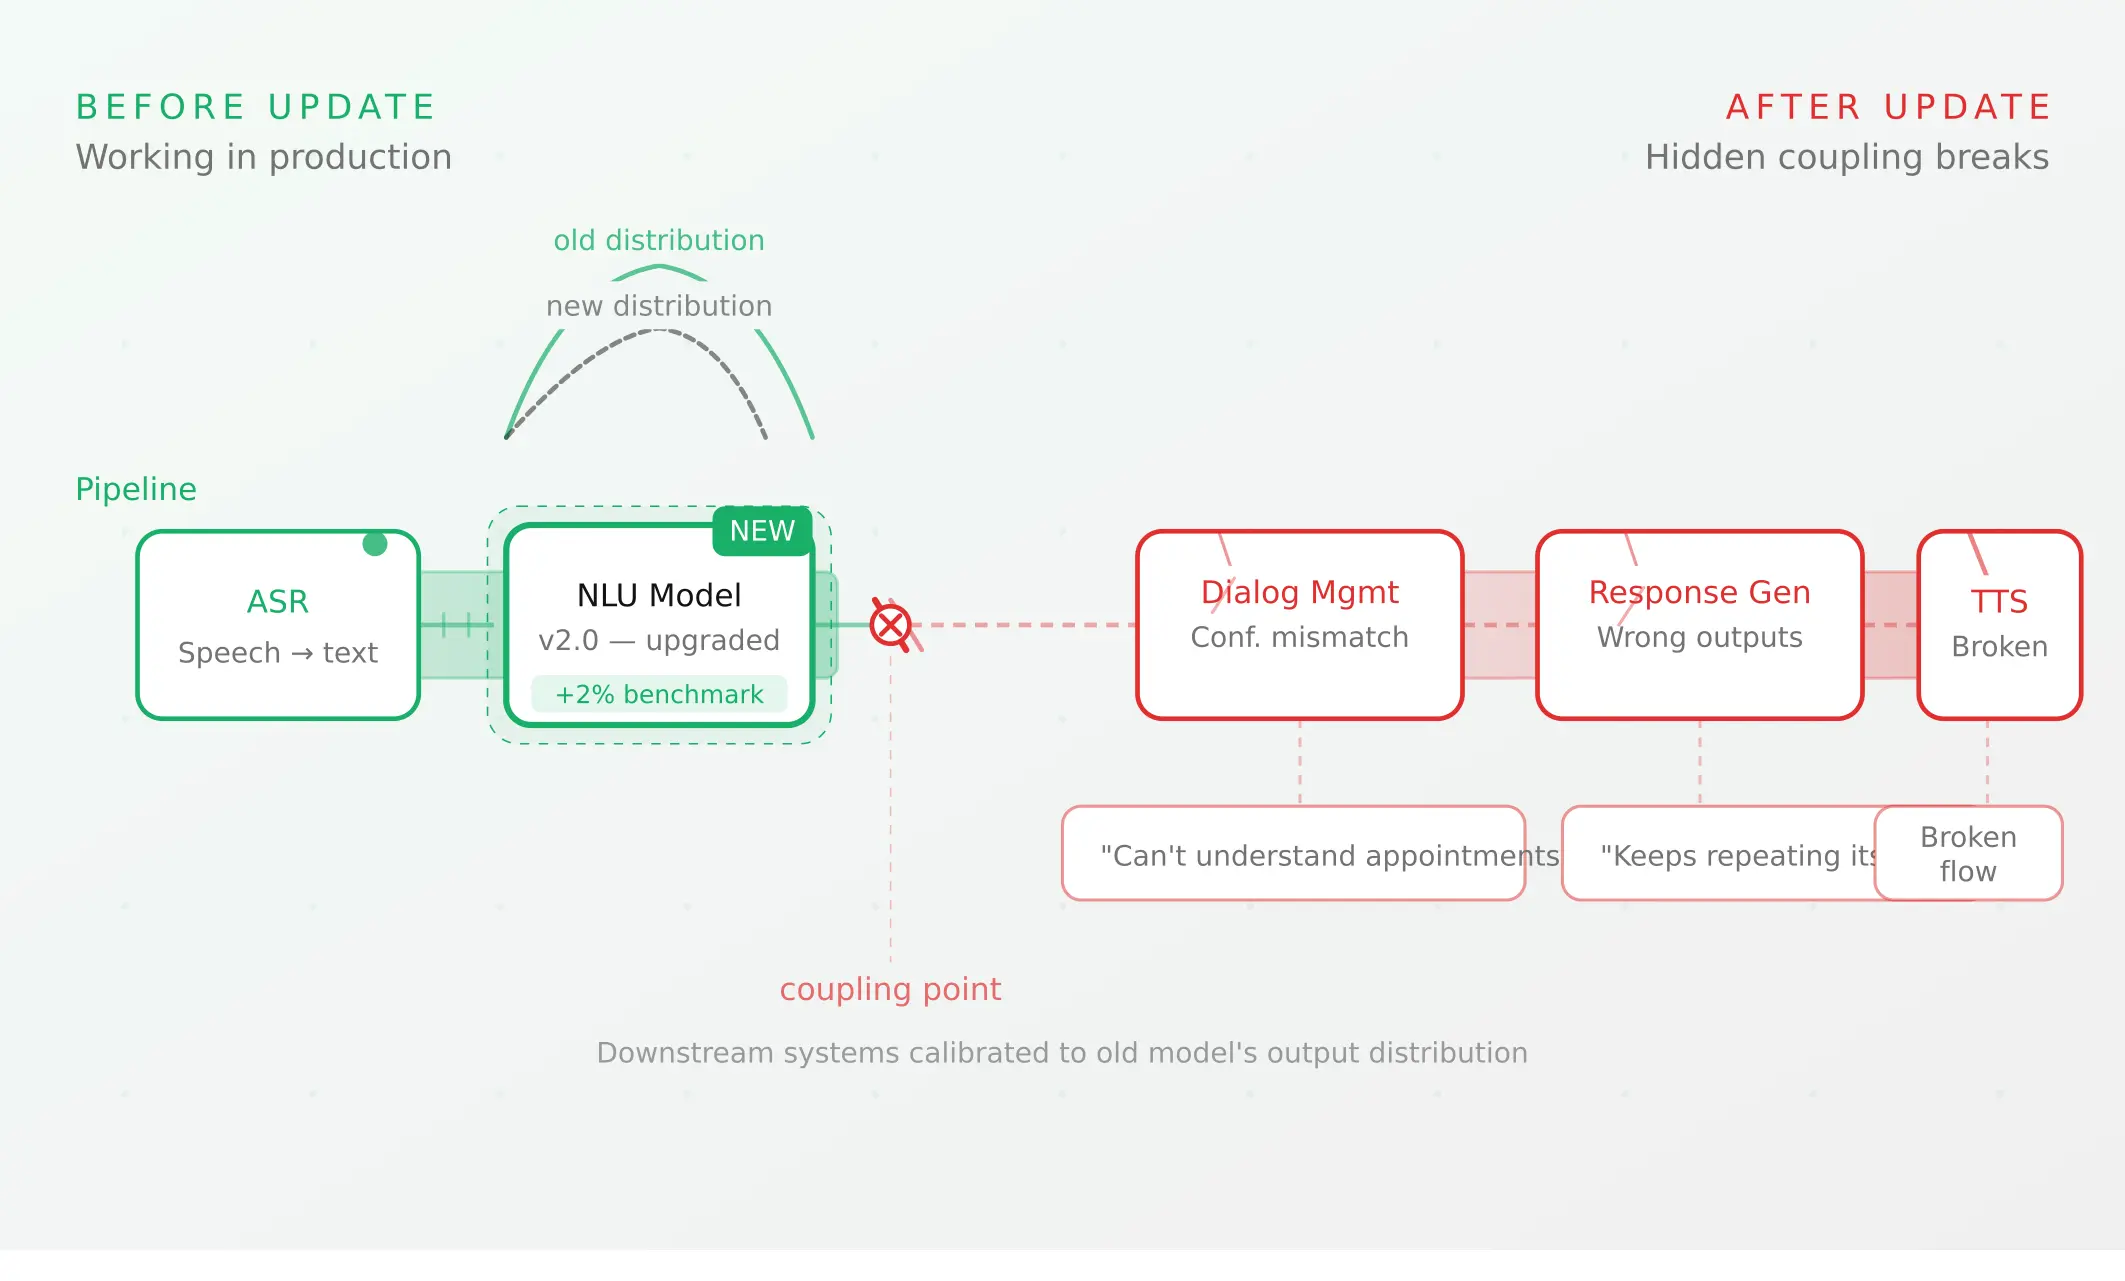
Voice agent regression testing: why LLM updates break production
LLM updates improve benchmarks but break voice agents in 5 predictable ways. How to detect and prevent regressions after every model or prompt change.
Read more