Vapi Observability: Call Logs, Webhooks and What You Can't See
On this page
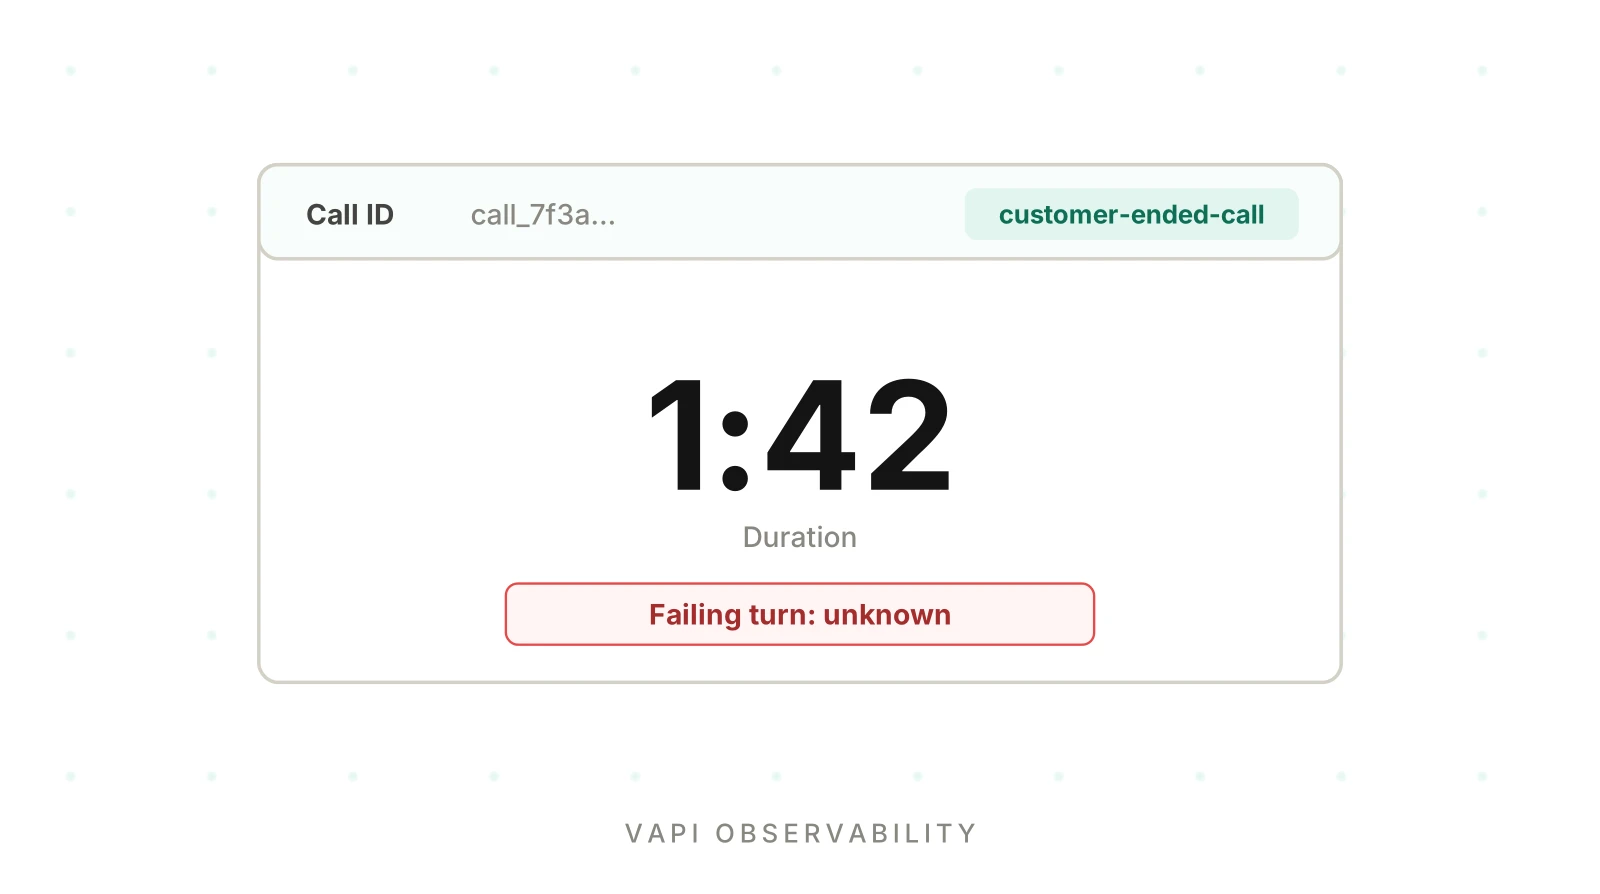
A caller says the assistant "kept talking over me and then hung up." You open the dashboard. The call is there, with a transcript, a duration and an ended reason. You still do not know which turn went wrong, or whether ten other callers hit the same fault.
Vapi observability is the set of views and data feeds Vapi gives you for that job. Good Vapi observability also means a copy of that data you control. This guide covers what the docs say each one shows. It then covers how to copy that data into a store you control, and what the platform view does not show by itself.
As of November 19, 2026, we read the Vapi docs pages linked below, on docs.vapi.ai, on that day. We ran none of this. Where a page did not state a fact, we say so and leave the fact out. No pricing appears here.
This post does not re-teach tracing basics. For those, read what voice agent observability is and the OpenTelemetry trace and span model. For testing a Vapi assistant before launch, see the Vapi testing guide.
What Vapi observability gives you out of the box
This section maps every documented surface. Vapi observability here means the whole set, not one dashboard.
Vapi splits its tooling across several surfaces. Each answers a different question.
| Surface | Where | What the docs say it holds |
|---|---|---|
| Call logs | Dashboard, Logs, Calls | Transcripts, messages, recordings, analysis, latency and cost when available |
| Webhook logs | Dashboard, Logs, Webhooks | Each server-message delivery to your server, with final HTTP code |
| API logs | Dashboard, Logs, API | Requests made to the Vapi API |
| Server messages | Your server URL | Events such as status updates, transcripts, tool calls, end-of-call report |
| Call analysis and structured outputs | Call record | Summary, extracted data, success evaluation |
| Monitoring | Observe, Monitoring | Monitors, triggers, issues and alerts on call data |
| Boards | Observe, Boards | Custom dashboards of call metrics |
| Evals and Simulations | Observe | Pre-deployment tests, not production tracing |
| Langfuse integration | Integrations | Traces sent to a Langfuse project |
Sources: the logs overview, the monitoring quickstart and the Boards quickstart.
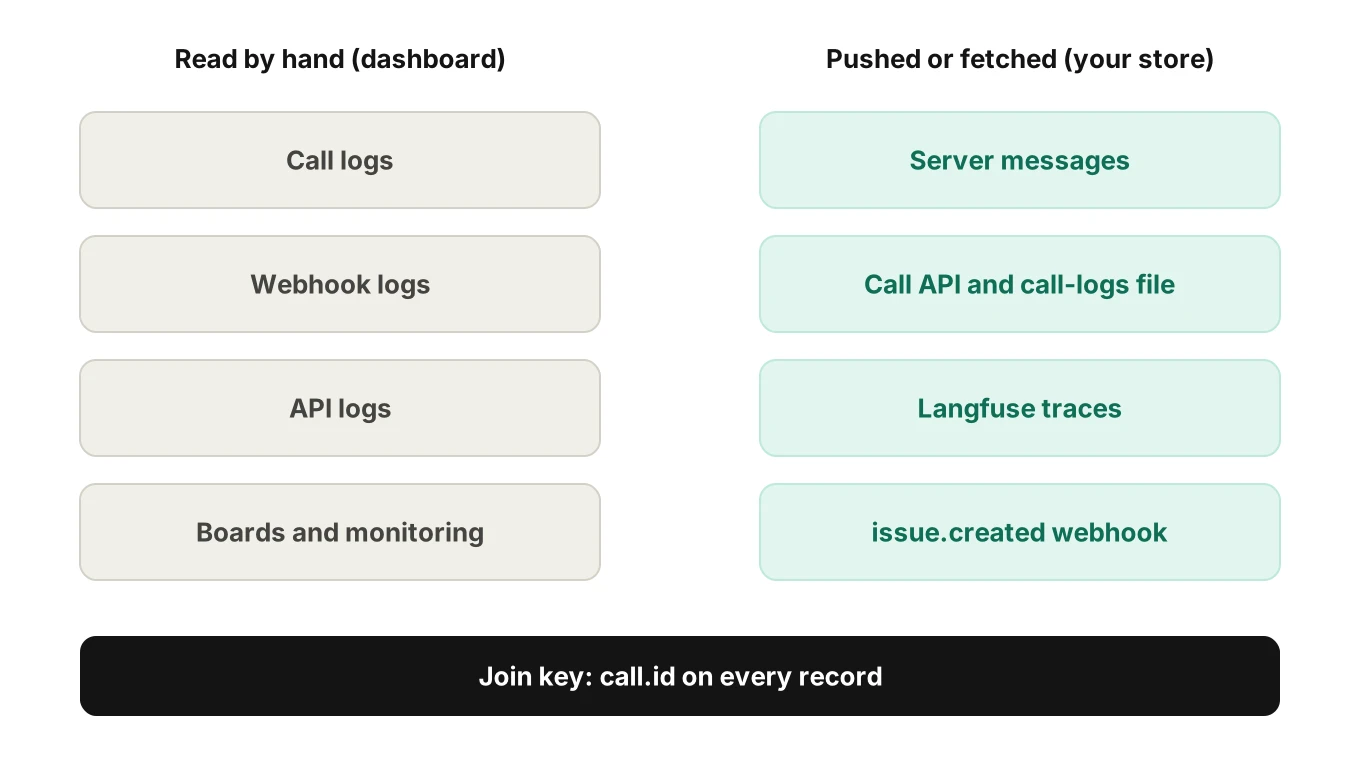
The surfaces differ in one key way. Some you read by hand in the dashboard. Others push data to you. A pipeline needs the second kind, so most of this post follows the push side.
Vapi call logs and the call object
Vapi call logs live under Logs, then Calls, in the dashboard. The call logs page lists these columns: call ID, assistant or squad, version, assistant and customer phone numbers, type, ended reason, start time, duration and cost when available.
Open one call and the Logs tab shows entries with a time, a level, a category and a message. The documented categories are Transcriber, Model, Voice, Endpointing, Tool, Transport, Knowledge Base, Transfer, Webhook, System, Latency, Hook and Chat. The page says the detail depends on the assistant's logging setting.
That category list is useful. Endpointing, Tool and Latency each map to a failure class you will chase. The page does not publish the entry schema beyond four fields, so treat the text of each message as free text.
The Vapi call logs API
Three endpoints matter for a pipeline. They come from the same page and the call artifacts page.
| Endpoint | Returns |
|---|---|
GET /call | A list of calls |
GET /call/{id} | One call object |
GET /call/{id}/call-logs | Pipeline logs as gzipped JSON Lines, after a 302 redirect |
The artifact endpoints answer with a redirect to a short-lived signed URL. The docs say to request a fresh URL each time and not to cache it. They also say to keep the private key on the backend.
The Get Call reference lists the call object fields. These matter most for observability:
id,startedAt,endedAt,endedReasonandendedMessagephoneCallTransport(siporpstn) andtransportcostand acostBreakdownwith transport, STT, LLM, TTS and Vapi partsmessages,analysis,monitorandartifactartifact.transcript,artifact.recording,artifact.logUrlandartifact.performanceMetricsartifact.structuredOutputsandartifact.scorecards
The reference describes artifact.performanceMetrics as turn latency broken down by component. We could not read its schema in the text we fetched. So we do not list its sub-fields, and you should confirm them against a real call before you depend on them.
What endedReason tells you
The endedReason field is the fastest triage key. The ended reason page groups values by cause: error prefixes such as pipeline-error-*, call start errors, assistant actions, customer actions, timeouts, transfer errors, transport errors and call hooks. Example values include customer-ended-call, assistant-ended-call and silence-timed-out.
A reason tells you how the call ended. It does not tell you which turn went wrong. Use it to bucket calls, then read the call logs for the bucket.
Vapi server messages and the end-of-call report
Vapi webhooks are called server messages. Vapi sends them, usually as POST requests, to a server URL you set. The server events page lists the types. These are the ones a trace pipeline cares about.
message.type | What it carries, per the docs |
|---|---|
status-update | call and status: scheduled, queued, ringing, in-progress, forwarding, ended |
transcript | role, transcriptType, transcript |
conversation-update | messages and messagesOpenAIFormatted |
speech-update | status (started or stopped), role, turn |
user-interrupted | Optional turnId, matching turnId on model-output |
model-output | Model output, tagged with a turn ID |
tool-calls | toolCallList with id, function.name, function.arguments |
end-of-call-report | endedReason, call, and artifact with recording, transcript, messages |
hang | Listed on the page; its fields are not detailed there |
transfer-update | Listed on the page; not sent by default |
Every message also carries common metadata: phoneNumber, timestamp, artifact, assistant, customer, call and chat.
Two details change how you build. First, only four types expect a reply: assistant-request, tool-calls, transfer-destination-request and knowledge-base-request. The rest are one-way notifications. Second, the page says assistant-request must be answered within 7.5 seconds end to end, and that the limit is fixed. Do not put slow database writes in that path.
The page states status-update is in the default set and transfer-update is not. It does not list the full default set. So choose your events on purpose in the serverMessages setting and test which ones arrive.
The end-of-call report is a summary, not a trace
The Vapi end of call report arrives once, after the call. It is the best single record to store. It is not a timeline. The page lists endedReason, the call object and an artifact with the recording, transcript and messages. It does not list analysis, a summary or a cost field in that message. Fetch those from the call object when you need them.
For a per-turn view, you need the in-call events too. Pair speech-update, user-interrupted, model-output and tool-calls by turn. Then build your own timeline from the timestamp field. That timeline is derived data. Label it so in your store.
Where the Vapi server URL webhook is set, and who gets the event
The setting server URLs page names four levels: function tool, assistant, phone number and organization. In that order, the highest level set wins. Events go to one server URL in that stack.
That matters for webhooks monitoring. If a tool has its own server URL, tool traffic skips your assistant-level collector. Check each level when events seem to go missing.
Vapi webhook authentication and delivery logs
Auth is where many pipelines leak. The server authentication page describes custom credentials, set under Integrations, then Server Configuration. Four types exist:
- Bearer token, sent in
Authorizationby default - Legacy
X-Vapi-Secret, a bearer credential with that header name and no prefix - OAuth 2.0 with the client credentials flow
- HMAC, with a configurable algorithm, signature header, optional timestamp header and payload format
One rule deserves a flag. When the server URL comes from the API request itself, such as a transient assistant in POST /call, the credentials are not attached. The page says your endpoint must then authenticate the request itself. It states this applies to organizations created on or after September 23, 2026 (UTC), with a phased rollout. Check which rule your organization is under.
Vapi webhooks monitoring starts in the dashboard. Once events flow, the Webhooks tab in Logs shows each delivery. The webhook logs page lists the timestamp, webhook type, method, final response code and request duration. It describes what the platform view does not show:
- It does not list a retry count or per-attempt results.
- It has no separate response-time field. Request duration may include retries.
- Webhook and API logs have no Logs endpoint in the public API.
So a long duration hints at retries but does not prove them. If you need delivery history in your own store, log every receipt on your side.
Vapi call analysis, structured outputs and scorecards
Vapi call analysis runs after the call ends. The call analysis page documents three outputs in call.analysis: summary, structuredData and successEvaluation. You tune them in the assistant's analysisPlan with prompts, a schema and a rubric. The page recommends structured outputs for new setups and says analysisPlan stays supported.
The structured outputs page says they run after each call, not in real time. Results land in call.artifact.structuredOutputs, keyed by output ID, with a name and a result. A null result means extraction failed. You link an output to an assistant through artifactPlan.structuredOutputIds.
Two cautions follow from the docs. Analysis is a model's reading of the call, so it can be wrong. And it arrives after the call, so it cannot page anyone mid-call. Store the result next to the raw transcript so you can audit it later.
Monitoring, Boards and Evals
Vapi monitoring is documented separately. Per the monitoring quickstart, a monitor holds triggers. Each trigger runs an insight query on an interval or schedule and compares it to a threshold. A breach creates an issue. Issue states are created, acknowledged and resolved. Notifiers can be email, Slack or webhook. When an issue is created, Vapi sends one issue.created webhook. The page adds that Zero Data Retention organizations do not receive monitor evaluations.
The page also lists an endpoint to run root cause analysis on a single issue. Plan your own alerting on top of it; our voice agent alerting guide covers what to page on.
Boards are custom dashboards. The Boards quickstart lists text, bar, line and pie insights, with filters, group-by and formula metrics.
Evals are different. The Evals quickstart describes scripted mock conversations that check an assistant's next decision. Per the docs they do not run on production calls. They are a pre-release tool. Do not count Vapi Evals on production calls as vapi monitoring, because they do not run there.
Vapi tracing and the Langfuse integration
The Vapi docs document one trace export: Langfuse. A Vapi Langfuse setup is the closest thing to Vapi tracing that the docs describe. The Langfuse integration page says Vapi sends traces for each conversation once you save a secret key, a public key and a host URL. By default, each trace carries call.metadata, assistant.metadata, assistantOverrides.metadata and assistantOverrides.variableValues. You can add custom metadata and tags through assistant.observabilityPlan.
In Langfuse you then see a trace per conversation, the system prompt, the messages and a list of chat-completion generations. The page does not document the full payload beyond that.
We found no OpenTelemetry page in the Vapi docs index we read on November 19, 2026. So for Vapi tracing in an OpenTelemetry backend, plan to build spans yourself from the events and API data above. That is what the five steps below do. For the span shape, see our span attributes guide.
What the platform view does not show by itself
None of this is a defect. These are questions the pages we read do not answer on their own. Each row is a gap you fill with your own data.
| Question | What the platform view shows | What to add |
|---|---|---|
| Which turn was slow? | Latency category in call logs; performanceMetrics is described as turn latency by component | Verify its fields on a real call, then store per-turn timings in your own spans |
| Is this a one-off or a pattern? | Monitors on thresholds; issues; per-issue analysis | Group failures across calls by cause; see clustering voice agent failures |
| Did the last prompt change cause it? | A Version column in the calls list | Stamp prompt and release tags on every call; we found no version-comparison view in the pages read |
| What happened on the phone leg? | phoneCallTransport, transport and transport-related ended reasons | Carrier records and your SIP provider's logs; see tracing a call end to end |
| Did the webhook reach us, and how often did it retry? | Final code and total duration | Your own receipt log with timestamps |
| Where do the logs go after retention ends? | Retention by plan and add-ons; ZDR stops storage | Your own store, with masking; see PII redaction in logs |
| Did the tool really work? | Tool category and tool-calls events | Tool outcome spans, checked against the downstream system |
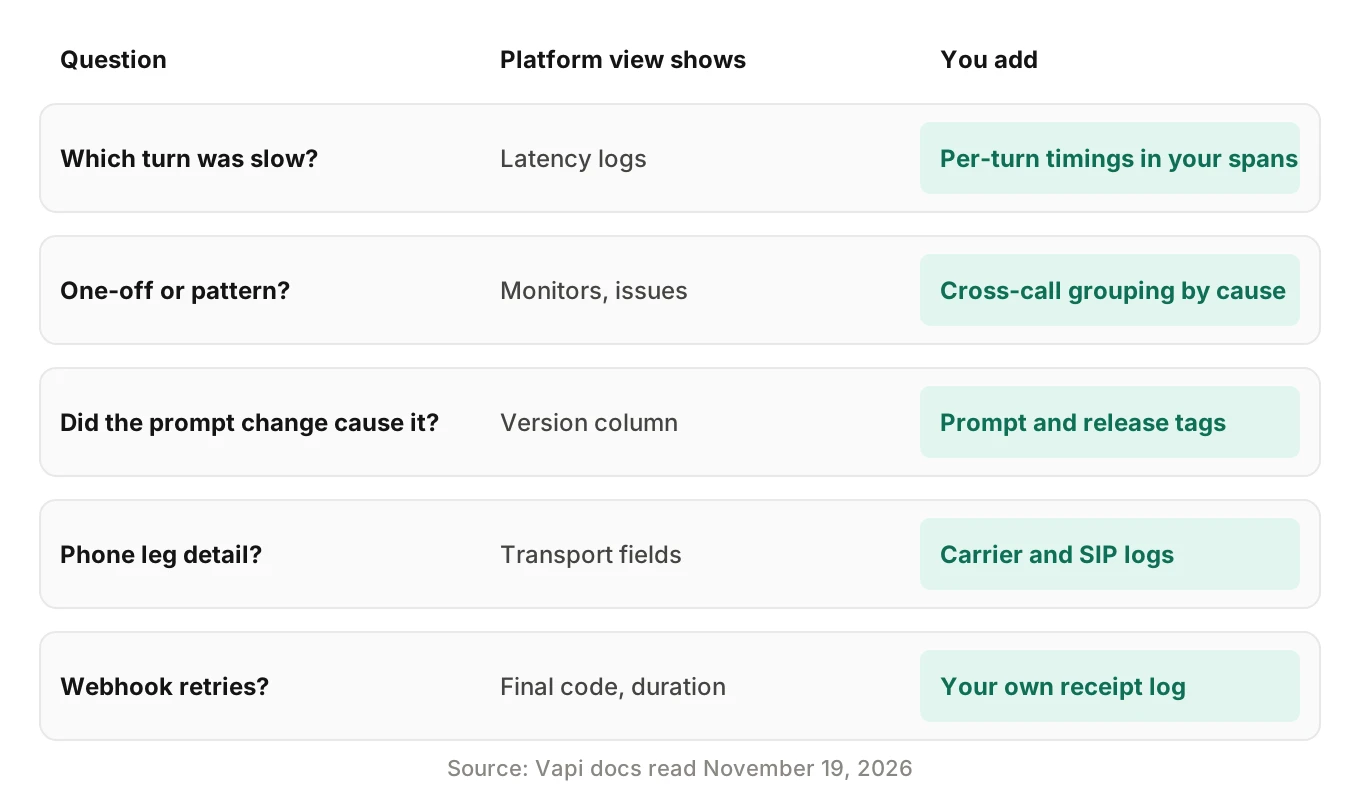
A Vapi latency breakdown by turn is the clearest example. The platform names the data, and you confirm it and keep it. The pattern is simple. The platform shows you each call. A trace store lets you ask questions across calls. That is the case for piping the data out.
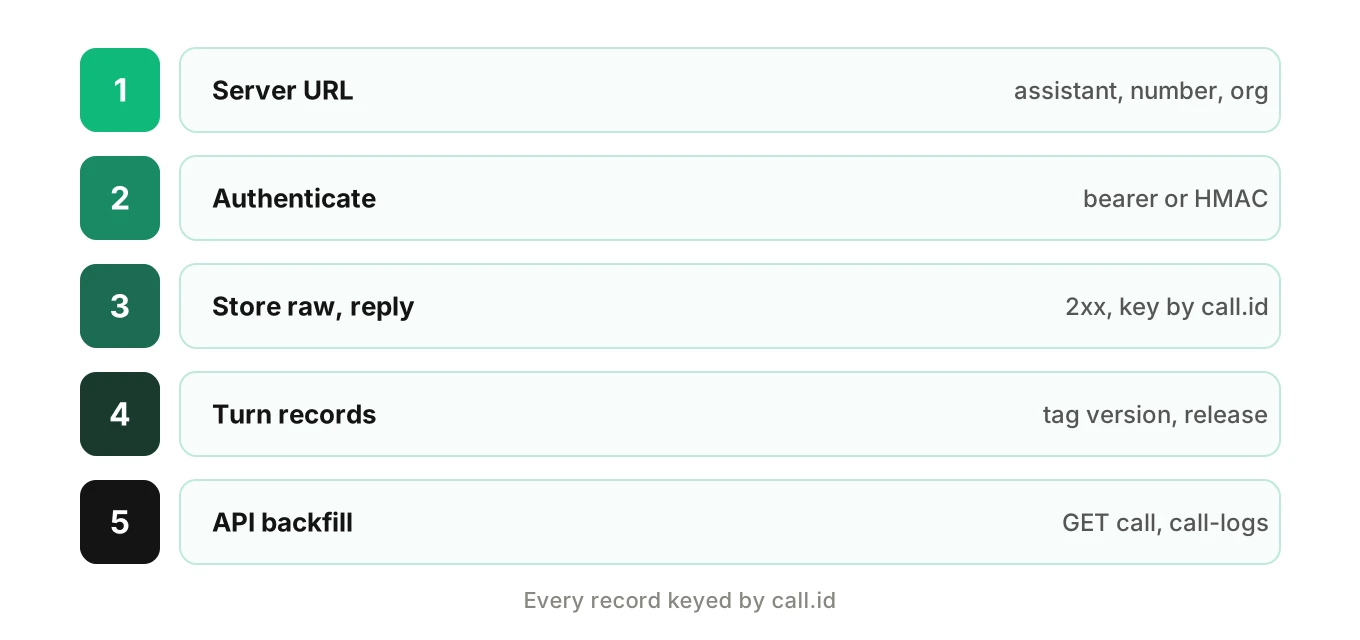
How to build a Vapi observability pipeline in 5 steps
This pipeline copies Vapi data into a store you control. It uses only the events and endpoints documented above. The code is illustrative and untested.
1. Point a server URL at your collector — set it on the assistant, the phone number or the org, and check the function tool level too. Choose the message types on purpose through serverMessages.
2. Authenticate every request — create a custom credential in Server Configuration. Prefer HMAC or a bearer token. Reject anything that fails the check.
3. Store the raw event first, then reply fast — write the body unchanged, keyed by call.id, and return a 2xx. Only tool-calls and the three other reply types need an answer body.
4. Normalize into turn records — group speech-update, user-interrupted, model-output and tool-calls by turn. Attach your own call ID, prompt version and release tag.
5. Backfill from the API after the call ends — on end-of-call-report, fetch GET /call/{id} and GET /call/{id}/call-logs, and store both with the report.
The payload below shows the shape only. Field names come from the events page. Values are placeholders.
{
  "message": {
    "type": "end-of-call-report",
    "endedReason": "customer-ended-call",
    "timestamp": "<as sent by Vapi>",
    "call": { "id": "<call id>" },
    "artifact": {
      "recording": "<as documented>",
      "transcript": "<full text>",
      "messages": ["<message objects>"]
    }
  }
}
A minimal receiver, simplified and illustrative:
# illustrative: header names depend on the credential you configured
import hmac, hashlib, json
from fastapi import FastAPI, Request, HTTPException

app = FastAPI()
SECRET = b"<from your secret store>"

def verify(raw: bytes, sig_hex: str, ts: str) -> bool:
    # payload format "{timestamp}.{body}" is one option Vapi lists for HMAC
    signed = ts.encode() + b"." + raw
    expected = hmac.new(SECRET, signed, hashlib.sha256).hexdigest()
    return hmac.compare_digest(expected, sig_hex)

@app.post("/vapi/events")
async def receive(req: Request):
    raw = await req.body()
    if not verify(raw, req.headers.get("x-signature", ""),
                  req.headers.get("x-timestamp", "")):
        raise HTTPException(status_code=401)
    msg = json.loads(raw)["message"]
    call_id = msg["call"]["id"]
    # idempotency key is our choice; the docs list no event ID
    key = (call_id, msg["type"], msg.get("timestamp"))
    save_raw(key, raw)           # your storage
    if msg["type"] == "end-of-call-report":
        enqueue_backfill(call_id)  # GET /call/{id} and /call-logs, off the hot path
    return {}                    # only the four reply types need a body
Three habits keep this honest. Make writes idempotent, because the docs do not state a retry count. Treat the timestamp field as the event time, and your receipt time as something else. And keep the raw body, since you can re-normalize later when your schema changes. The call ID correlation guide covers joining these records with carrier and LLM logs. Our what to log guide lists the fields worth keeping.
Reading a bad call with this data
Take the opening complaint: the assistant talked over the caller and then hung up. With the pipeline above, you can work in this order.
1. Look up the call by ID and read endedReason. Was it customer-ended-call or something else?
2. Find the user-interrupted events. Check which turnId they point to.
3. Compare the model-output timestamps for that turn with the interruption.
4. Read the Endpointing and Latency entries in the call logs for the same window.
5. Check tool-calls in the turns just before. A slow tool can look like a talkative agent.
This gives you evidence at the level the data supports. It cannot tell you what the caller heard on the phone. For a longer method, see our guide to debugging a bad voice agent call.
Where Evalgent fits
Vapi gives you each call. Someone still has to decide which failures share a cause. That is what Evalgent Observe, which is launching, is for. It traces each failure to the step or handoff that caused it. It clusters failures into root causes, so a team fixes causes, not single calls. Where the data cannot support a verdict, the finding is marked undetermined and the coverage gap is shown.
For Vapi, this works today through OpenTelemetry and the upload path; native connectors are planned. So the normalized records from step 4 are the input, not a Vapi button. Evalgent never sits in the media path, so nothing touches live calls. Our root cause analysis post explains the thinking.
Evalgent's production call monitoring is live. Customers push call recordings, and calls are transcribed, mapped to scenarios and judged. It flags PII leakage, tool-call failures, latency spikes and policy failures, with fix recommendations. If you are choosing a platform, see Vapi vs Retell and LiveKit vs Vapi.
Frequently asked questions
What is Vapi observability?
It is the set of views and data feeds Vapi documents for understanding calls. These include dashboard call logs, webhook logs, server messages, call analysis, monitoring, Boards and a Langfuse integration. Evals and Simulations are pre-release testing tools, not production tracing.
Where do I find Vapi call logs?
In the dashboard under Logs, then Calls. The list shows call ID, ended reason, start time, duration and cost when available. Opening a call shows log entries by category, such as Endpointing, Tool and Latency. The API has GET /call and GET /call/{id}, plus a call-logs endpoint for pipeline logs.
What does the Vapi end-of-call report contain?
The events page lists endedReason, the call object and an artifact with the recording, transcript and messages. It does not list analysis or a summary in that message. Fetch those from the call object after the report arrives, and store both together.
How do I authenticate Vapi webhooks?
Create a custom credential under Server Configuration. Types are bearer token, legacy X-Vapi-Secret, OAuth 2.0 and HMAC. If the server URL comes from the API request itself, credentials are not attached for newer organizations, so your endpoint must authenticate the request itself.
Does Vapi support OpenTelemetry or Langfuse?
Langfuse, yes: Vapi sends traces for each conversation once you save keys and a host URL. We found no OpenTelemetry page in the docs index we read on November 19, 2026. For an OpenTelemetry backend, build spans yourself from webhooks and API data.
Can Vapi Evals monitor production calls?
No. The docs describe Evals as scripted mock conversations that check an assistant's next decision. They suit pre-deployment and regression checks. For live traffic, use call logs, monitoring, analysis and your own pipeline. Our Vapi testing guide covers the pre-release side.
Does Vapi show per-turn latency?
The call logs have a Latency category, and the Get Call reference describes artifact.performanceMetrics as turn latency by component. We could not read its schema, so confirm the fields on a real call. The debugging guidance does not describe a dedicated latency view.
How do I log Vapi calls to your own database?
Receive server messages, verify them, store the raw body keyed by call ID and return a 2xx quickly. After the end-of-call report, fetch the call object and the call-logs file from the API. Normalize into turn records later, so you can change the schema without losing data.
The bottom line
Vapi observability gives you solid per-call views and push feeds, but they stop at the single call. Copy the webhooks and API data into your own store, key it by call ID, and add the release tags and cross-call grouping the platform view leaves to you.
Related Articles

How to automate voice agent testing: synthetic callers vs manual QA
Learn how ai test automation replaces manual QA for voice agents. Compare synthetic callers vs human testers, with a 5-step framework to scale without hiring.
Read more
AI Agent Testing vs Voice Agent Testing: What General Tools Miss for Voice
AI agent testing measures text outputs. Voice agent testing measures behaviour through an acoustic pipeline. Five failure categories general tools miss.
Read more