TTS Observability: Time to First Byte, Chunk Gaps and Underruns
On this page
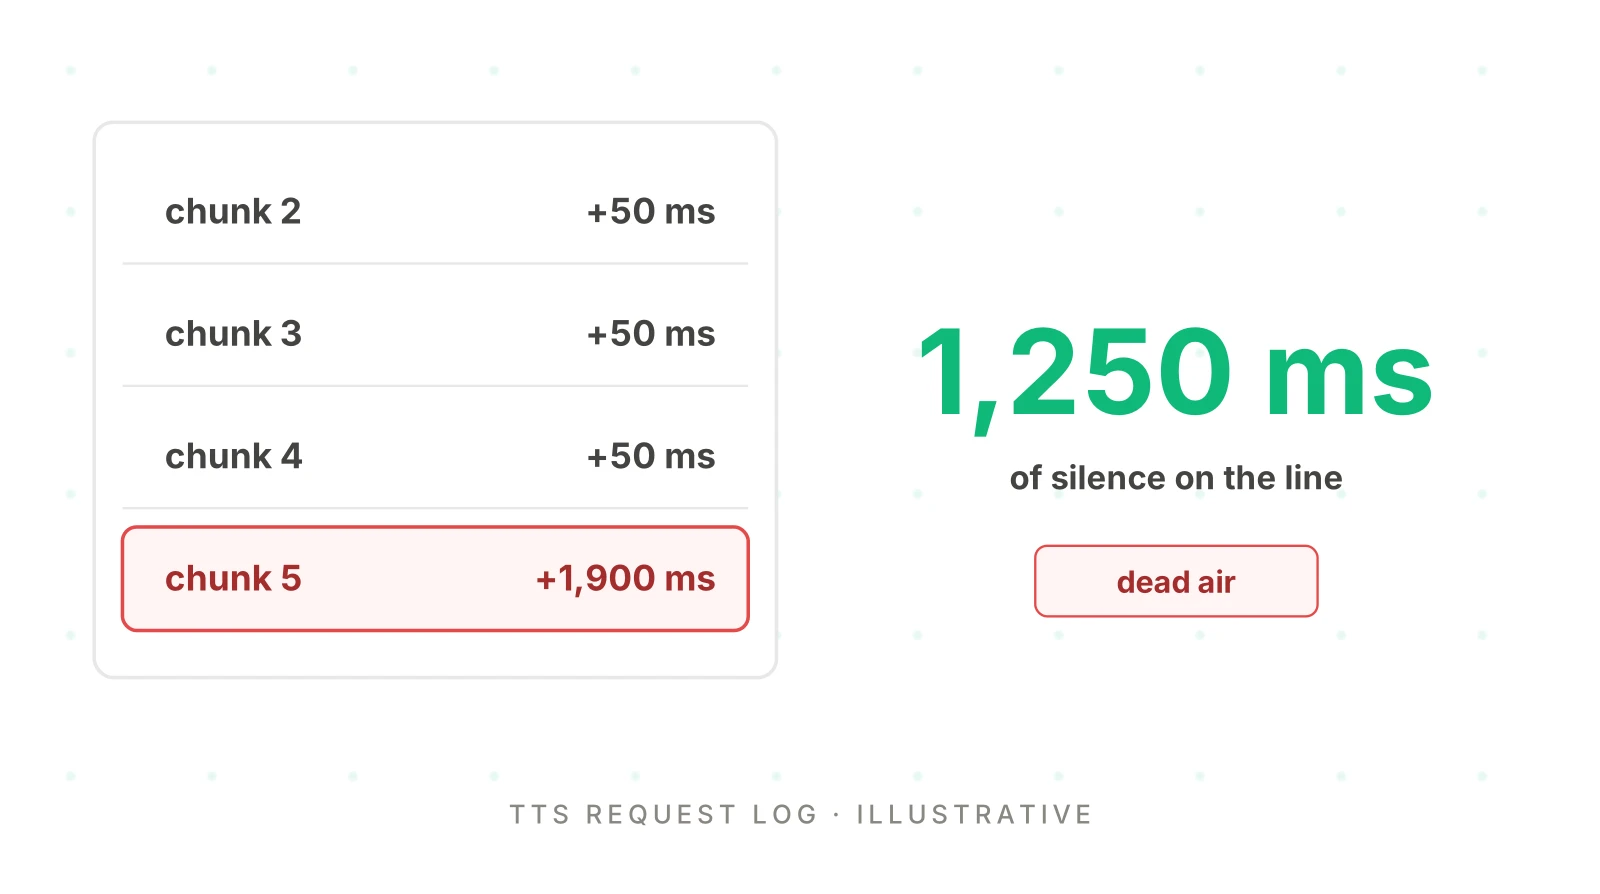
A caller says the agent "pauses in the middle of its answer." You open the trace. The LLM span looks fine. The TTS span has a healthy time to first byte. Nothing marks the pause.
That is the usual blind spot. A TTS span with one start and one end hides everything between. Chunks can stall for two seconds and resume, and the span still closes green. TTS observability is recording the pieces in between. This is the observability view of the TTS layer, as of November 21, 2026. It names providers only where I opened their docs.
What TTS observability covers
This post is about what a live system should write down per synthesis request. It is not about picking a voice or scoring one.
Neighbouring posts cover other ground. Time to first audio defines the caller-side clock. TTS evaluation scores voices on audio you collect on purpose. The TTS buyer's guide is about choosing, and multilingual TTS about per-language quality.
This post asks a different question. What does your trace hold after a bad call, so you can say where the silence came from? Where it cannot say, the label is "undetermined."
Ten things to capture for every synthesis request
A synthesis request is one stretch of text sent to the TTS engine, plus the audio that comes back. Capture these ten items for each. The OpenTelemetry traces docs say to use span events when a timestamp is meaningful, and attributes when it is not.
| # | Capture | Type | What it tells you |
|---|---|---|---|
| 1 | Request sent time | Event | Your clock start for this request |
| 2 | First audio byte arrival | Event | Time to first byte at your client |
| 3 | Each chunk: arrival time and byte count | Event | Cadence, bursts and gaps |
| 4 | Audio duration received | Derived | Bytes divided by bytes per second |
| 5 | Stream end (done or final message) | Event | When generation finished |
| 6 | Exact text sent | Attribute | What the agent was meant to say |
| 7 | Characters sent | Attribute | Usage and rate-limit pressure |
| 8 | Voice, model and settings | Attribute | Comparing across releases |
| 9 | Errors, warnings, rate limits, closes | Event | Failures with their codes |
| 10 | Flush, cancel, clear and playback marks | Event | When text was released and what was stopped |
Most traces lack items 2 and 3, the audio chunks. A span with only a duration cannot tell a steady stream from a stall.
Name your time to first byte
"Time to first byte" varies by tool. ElevenLabs defines it as "the time it takes for the first byte of audio to be sent to the client." LiveKit's ttfb is the time "for the TTS model to generate the first byte of its audio output." Pipecat lists "Time To First Byte in seconds."
For TTS observability, define your own. Client-side TTS time to first byte is item 2 minus item 1, and it includes network time. It is not the caller-side time to first audio, which also includes endpointing, STT and the LLM.
What providers list
Field names are provider-specific. The moments are not. This table uses only docs I read on November 21, 2026.
| Source | What the docs list | What you still add |
|---|---|---|
| ElevenLabs WebSocket guide and API reference | Base64 audio in JSON messages, optional alignment, flush, chunk_length_schedule, inactivity_timeout (default 20 s, maximum 180) | Arrival stamps. The pages list no error payloads |
| Cartesia WebSocket reference | context_id, chunk messages with data, done, status_code, step_time; flush_done with flush_id; error with title, message, optional error_code and request_id; cancel | Arrival stamps. step_time is not defined on the page |
| Deepgram streaming TTS | Speak, Flush, Close; Flushed with sequence_id; a warning past the flush limit; Metadata (fields not documented) | Arrival stamps and warning capture |
| OpenAI Realtime guide | response.output_audio.delta chunks; done events carry no audio; response.done with a cancelled status | Playback position over WebSockets |
| LiveKit Agents data hooks | TTSMetrics: ttfb, duration, audio_duration, characters_count, streamed, speech_id | Chunk-level cadence, which the metric does not carry |
| Pipecat tracing | TTS span attributes: gen_ai.provider.name, gen_ai.request.model, voice_id, text, metrics.character_count, metrics.ttfb | Chunk-level cadence |
One gotcha. ElevenLabs sample code stops reading when isFinal is true, the API reference shows is_final, and neither page defines it. Test it before using it as your stream-end event.
One request, worked through (illustrative)
This request is invented to show the arithmetic. It is not a measurement. Assume linear16 audio at 24,000 Hz, mono: 48,000 bytes per second. The chunks, timing and stall are made up.
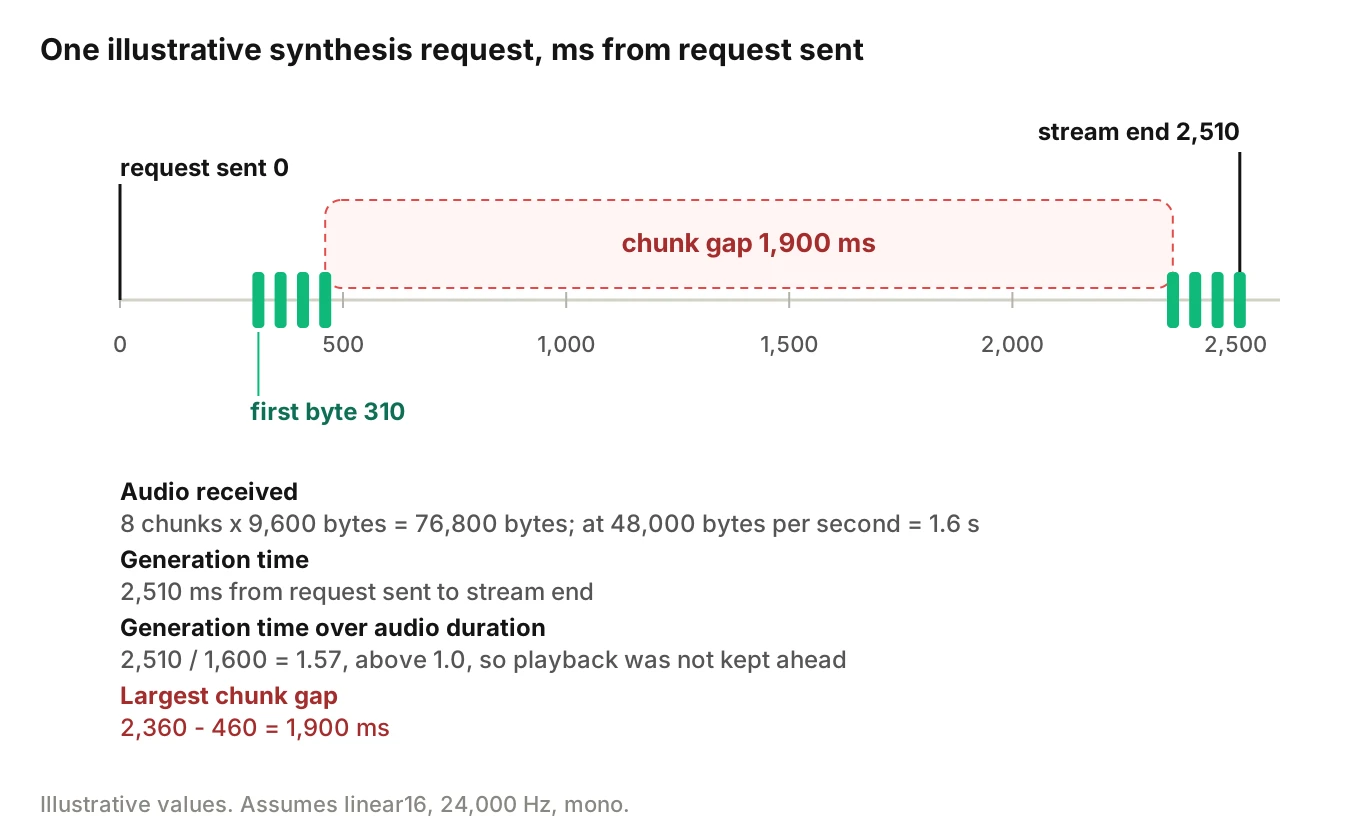
Times are milliseconds from request sent. Each chunk holds 9,600 bytes, which is 200 ms of audio.
| Chunk | Arrives (ms) | Gap since previous (ms) |
|---|---|---|
| 1 | 310 | 310 (time to first byte) |
| 2 | 360 | 50 |
| 3 | 410 | 50 |
| 4 | 460 | 50 |
| 5 | 2,360 | 1,900 |
| 6 | 2,410 | 50 |
| 7 | 2,460 | 50 |
| 8 | 2,510 | 50 |
The arithmetic:
- Audio received: 8 chunks times 9,600 bytes is 76,800 bytes. Divided by 48,000 bytes per second, that is 1.6 s.
- Generation time: the stream ended at 2,510 ms.
- Generation time over audio duration: 2,510 divided by 1,600 is 1.57. Above 1.0 means the engine did not keep ahead of playback.
- The stall: 2,360 minus 460 is a 1,900 ms chunk gap.
LiveKit's duration and audio_duration give the same ratio. The ratio hides the shape: four chunks, then a 1,900 ms stop.
How a chunk gap becomes dead air
This is how a chunk gap shows up in a trace: as a long interval between two arrival events.
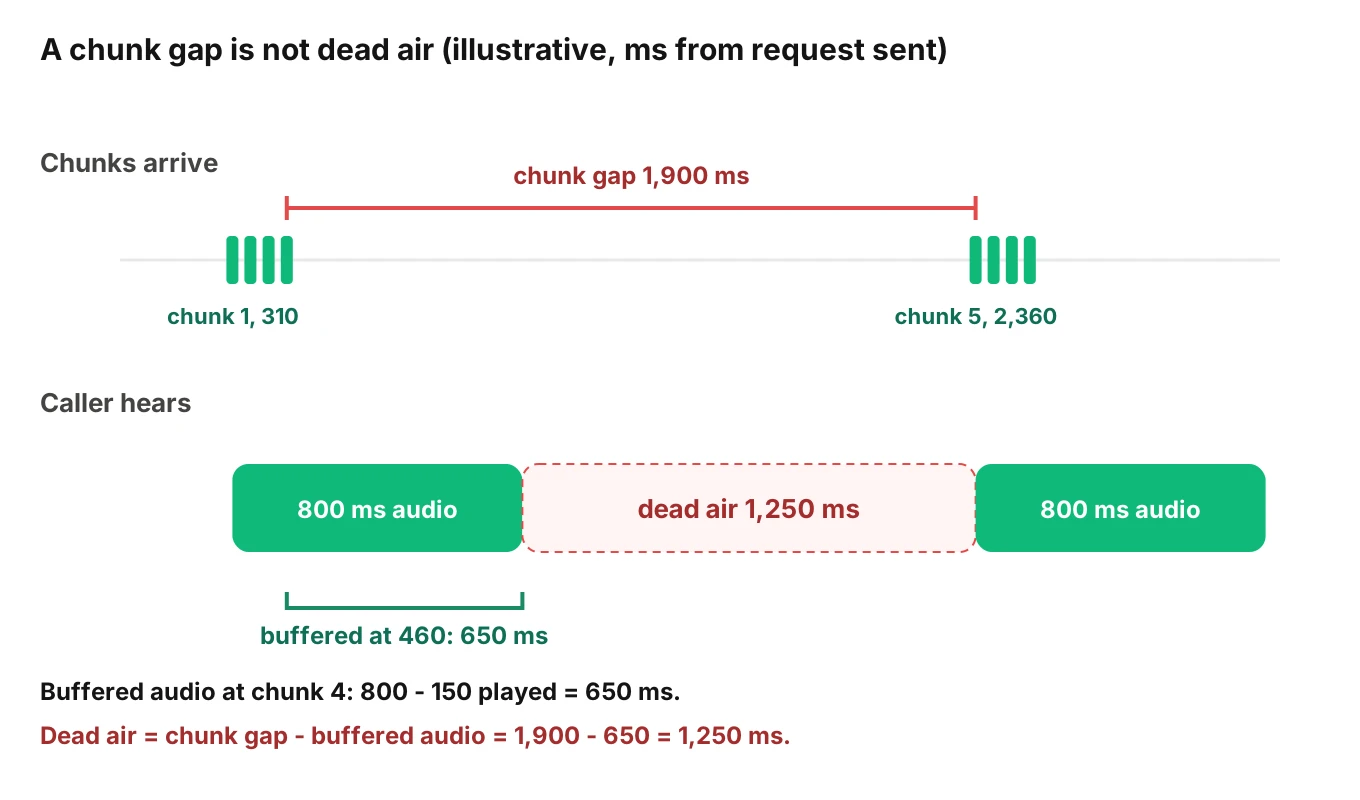
A chunk gap is not silence the caller hears. Buffered audio covers the gap until it runs out.
Twilio's Media Streams docs say outbound media messages are "buffered and played in the order received." So the line plays on while that buffer holds audio. An underrun is the moment it empties. PortAudio's paOutputUnderflow flag names the same idea: "output data (or a gap) was inserted." On a call, the gap is silence.
The rule:
- Dead air is the chunk gap minus the audio buffered when the last chunk arrived.
- It cannot be negative. If the buffer outlasts the gap, nobody hears anything.
Using the worked request, and assuming playout starts the moment chunk 1 arrives:
- At 460 ms, 800 ms of audio has arrived (4 chunks times 200 ms).
- Playout began at 310 ms, so 150 ms has played. Buffered audio is 650 ms.
- The buffer empties at 310 plus 800, which is 1,110 ms.
- Chunk 5 arrives at 2,360 ms. Dead air is 2,360 minus 1,110, which is 1,250 ms.
- Check: 1,900 chunk gap minus 650 buffered is 1,250.
Replies usually go out sentence by sentence. A stall at a boundary is dead air between sentences, and TTS chunk gaps are how it starts. The trace question is why the next request was slow. Four causes look different in the captures.
| What the trace shows | Likely cause | Fix to try |
|---|---|---|
| Text for sentence two was sent late | Upstream: the LLM was slow to produce it | Look at the LLM span and its first token. See going silent |
| Text was sent on time, first byte came late | The TTS engine or network was slow | Compare time to first byte across requests and voices |
| Text was sent on time, no audio until a later flush | Text was held in a provider buffer | Flush at sentence end. Check buffer settings |
| A close, warning or error precedes the gap | Connection or rate-limit event | Reconnect handling, retry, limits |
The third row is documented behaviour. ElevenLabs buffers text until the chunk_length_schedule threshold is met, and flush: true forces generation. Cartesia's max_buffer_delay_ms is "the maximum time in milliseconds to buffer text before starting generation," with a default of 3000 and a range of 0 to 5000. Deepgram's Flush generates audio from text already buffered. Log your settings (item 8).
The fourth row has documented causes too. Deepgram sets a rate limit of 20 Flush messages every 60 seconds and sends a warning after that. It also documents 2,400 characters per minute, a 429 for concurrency limits and a 60-minute socket timeout. ElevenLabs closes an idle socket after 20 seconds by default. A close mid-call is a nameable cause, if you record closes.
That is what timestamps show. Whether the caller heard silence also depends on buffers further down the line. See timestamps and clock sync and voice call quality metrics for those.
Streaming versus non-streaming synthesis
Streaming vs non-streaming TTS changes what a trace can hold. The low-latency TTS post covers speed.
A non-streaming request returns one response. Time to first byte is close to total time, and there is no cadence to inspect. A streaming request returns audio chunks, so you need an arrival stamp on each to find a stall. Stamp only the end, and a stall is invisible.
LiveKit's streamed field records which mode ran. Record it. A streaming time to first byte and a batch one are different quantities, so keep them off the same chart.
Text normalisation surprises: log the text you sent
Text normalisation turns "$40.10" or "5/6" into words before synthesis. When it surprises you, the clue is in the text sent.
ElevenLabs' model docs say Flash v2.5 does not normalise numbers by default as you might expect. Phone numbers "might be read out in way that isn't clear for the user." Dates and currencies are affected similarly. The docs suggest having the LLM normalise text first, or setting apply_text_normalization to "on." The evaluation post covers testing entities.
For observability, the job is narrower. Store the exact text sent to TTS on the span (item 6). Then scan it. Some surprises are visible in the text without any audio:
- An unfilled template variable such as
{{first_name}}or${amount}. - A raw URL or email address.
- A long digit string with no grouping.
- Markdown symbols or tags from the LLM.
// Simplified: flag risky text sent to TTS. Patterns are examples only.
const checks: Record<string, RegExp> = {
  placeholder: /\{\{[^}]*\}\}|\$\{[^}]*\}|<[a-z_]+>/i,
  url: /https?:\/\/\S+|www\.\S+/i,
  long_digits: /\d{7,}/,
  markdown: /[*_`]{1,3}\S+[*_`]{1,3}/,
};

function flagTtsText(text: string): string[] {
  return Object.keys(checks).filter((k) => checks[k].test(text));
}
// Attach flagTtsText(text) to the span as an attribute.
A flag means the text sent held something risky. It does not prove the caller heard it read aloud. It gives you a short list to check first. The text may hold personal data, so mask it. See PII redaction in logs and traces.
Cancel, flush and clear when the caller interrupts
On a barge-in, text is already in flight. Audio sits in at least two buffers: the provider's and the telephony edge's. Each stop control reaches only one.
- Twilio: a
clearmessage "empties all buffered audio" and sends back pendingmarkmessages, so you can tell which audio never played. - Deepgram:
Clearclears the internal text and audio buffer and stops new chunks "as soon as possible." The page also says the server will "process all remaining audio data" beforeCleared. It does not say whether generated audio is discarded, so test that. - Cartesia: a cancel request for a
context_idmeans no more messages are generated for that context. - OpenAI Realtime: over WebRTC and SIP the server truncates unplayed audio. Over WebSockets your client must stop playback and send
conversation.item.truncatewithaudio_end_ms, the played duration.
Record these per interruption: caller speech detected, cancel sent, the provider's acknowledgement, chunks arriving after the cancel, the clear sent to the line, and the playback position. Late chunks are wasted work and a sign your stop path is slow. The turn side is in turn-taking observability. For a tool call in flight, read interrupted tool calls.
How to instrument TTS observability
Follow this order. It works with any provider.
1. Define your clock - Write down what "request sent" and "first byte" mean for your stack. Use one definition everywhere.
2. Wrap the synthesis call - Put one span around each request, with the sent time as the span start. Add the provider and the mode, streaming or not.
3. Stamp every chunk - Record arrival time and byte count on a span event. If that costs too much, keep the largest gap.
4. Derive the numbers - Compute time to first byte, audio duration from bytes, generation time and the largest chunk gap. Store them as attributes.
5. Store text and settings - Save the exact text sent, the character count, and the voice, model and settings. Mask personal data first.
6. Capture stop controls and errors - Record flush, cancel and clear with times. Record warnings, error codes, rate-limit responses and socket closes.
7. Mark playback where you can - Use telephony marks or played duration, so you know where audio stopped, not only where you stopped sending.
8. Join to the turn - Add the turn and call IDs, so a TTS gap lands on the call timeline. See the span model and span attributes.
For wider call fields, see what to log on every call. For debugging order, see root-causing a bad call.
What stays undetermined without the audio
A trace holds text, bytes, times and control messages, not sound. Some questions stay open.
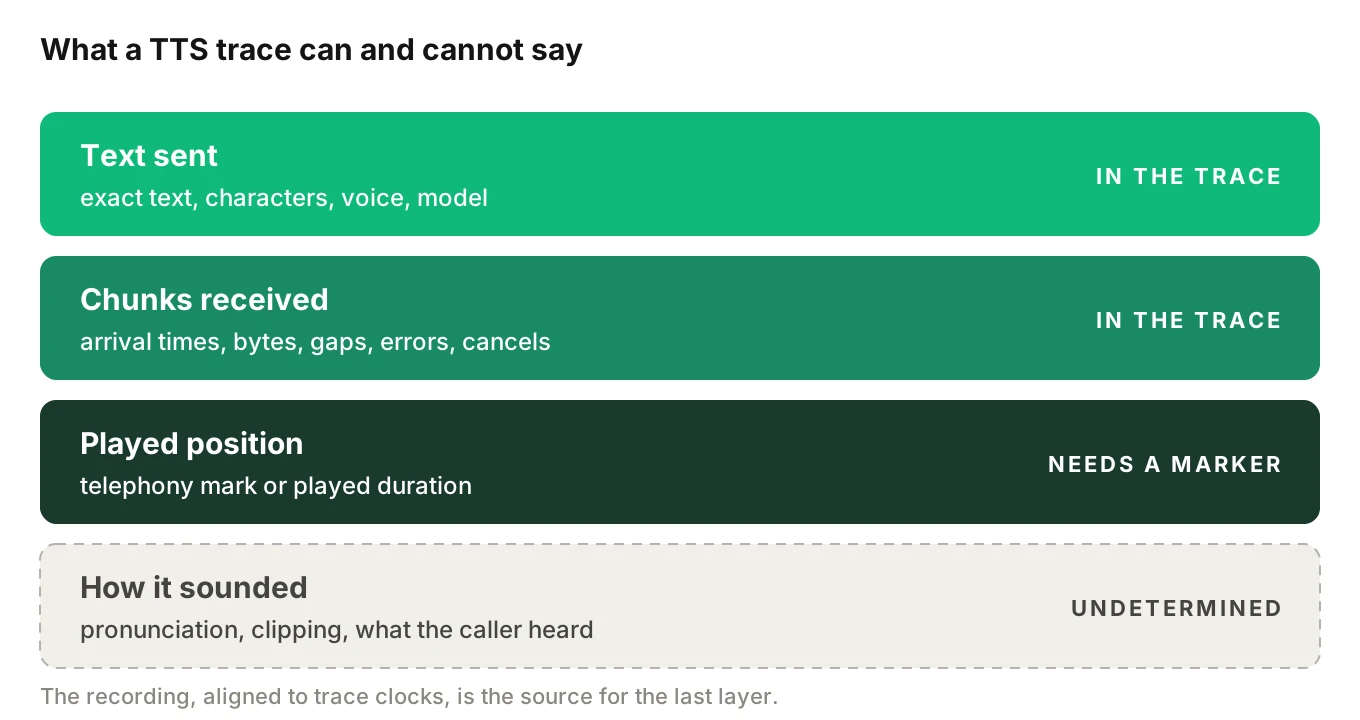
| Question | Why the trace cannot settle it |
|---|---|
| Did the caller hear silence at the gap? | The log shows arrival at your server. Buffers further down can fill or hide a gap |
| Was the number or name pronounced correctly? | The trace has the text, not how it was spoken |
| Did the voice clip or distort? | Bytes and durations carry none of that |
| Do trace times match the recording? | Only if clocks were aligned |
The trace says what the system sent and received. A recording says what happened on the line. Linking recordings to traces is a general engineering task. For line-side causes, see phone audio quality.
Where Evalgent fits
Evalgent is a testing, evaluation and monitoring platform for voice agents. Evalgent Observe, which is launching, ingests OpenTelemetry data from any stack. It traces each failure to the step that caused it and clusters failures into root causes. For the TTS layer, findings such as dead air and template variables or URLs read out loud come from traces and call data, including the text sent to TTS. Where the data is blind, it says "undetermined" and shows the coverage gap. It never sits in the media path.
Testing is the other half. Evalgent test callers carry a profile with seven parameters, including interruption level and response delay, so you can provoke interruptions on purpose. The platform measures call timestamps such as first audio on test calls, and Reviews replay a test call with audio and transcript together. You can book a demo to see this on your agent.
Frequently asked questions
What is TTS observability?
TTS observability is recording the timestamps, sizes, settings and control messages around each text-to-speech request. With them, a trace can show chunk gaps and dead air. It cannot show how the voice sounded.
What is time to first byte for TTS and where do I measure it?
It is the time from sending text to receiving the first audio byte. Tools define it differently, so name yours. At your client it is first byte arrival minus request sent, network time included. Caller-side time to first audio is longer.
What is a buffer underrun in a voice agent?
An underrun is when the playout buffer empties before the next audio chunk arrives. The line then plays silence until audio resumes. In a trace you estimate it as the chunk gap minus the audio buffered at the last arrival.
How does a chunk gap show up in a trace?
It shows as a long interval between two chunk arrivals in one request, or between the last chunk of one sentence and the first of the next. Compare it with the audio buffered then. If the buffer was smaller, the difference is likely dead air.
What changes in observability between streaming and non-streaming TTS?
Non-streaming returns one response, so there is no cadence to see. Streaming returns chunks, so you need an arrival stamp on each to find stalls. Record which mode ran, because mixing them in one latency chart misleads.
Why log the exact text sent to TTS?
The text is the part of speech your trace holds in full. It lets you find unfilled template variables, raw URLs and long digit strings, and tie a disputed amount to its request. It does not prove what was heard. Mask personal data first.
What should I record when a caller interrupts the agent?
Record the barge-in time, the cancel sent, the provider's acknowledgement, chunks arriving after the cancel, the clear sent to the telephony edge, and the played position. Late chunks signal a slow stop path.
What can TTS observability not tell me?
It cannot say how the voice sounded, whether a name was pronounced correctly, whether audio clipped, or whether the caller heard the gap. Label those undetermined and use the recording to settle them.
The bottom line
TTS observability comes down to stamping each synthesis request with its sent time, first byte, every chunk, the exact text and its stop controls, so a stall reads as a number instead of a complaint. Where the trace cannot say what the caller heard, write "undetermined" and bring in the recording.
Related Articles

How to automate voice agent testing: synthetic callers vs manual QA
Learn how ai test automation replaces manual QA for voice agents. Compare synthetic callers vs human testers, with a 5-step framework to scale without hiring.
Read more
AI Agent Testing vs Voice Agent Testing: What General Tools Miss for Voice
AI agent testing measures text outputs. Voice agent testing measures behaviour through an acoustic pipeline. Five failure categories general tools miss.
Read more