Voice Call Quality Metrics: Jitter, Packet Loss, RTCP and MOS Explained
On this page
A caller says the line sounded bad. Your logs say the agent behaved. Teams then search for voice call quality metrics jitter packet loss mos to find out why. Somewhere between the two sits the network path, and it leaves numbers behind. This post explains those numbers as of November 21, 2026, using the standards that define them.
It is a vendor-neutral explainer. It does not repeat the neighbours. For codecs, speech-to-text accuracy and a test plan, see voice call quality for voice agents. For how a MOS listening test works, see mean opinion score for voice agents. This post covers what each network signal means, what it cannot tell you, and how to attach it to a trace.
What the network layer reports about a call
Audio on a phone or WebRTC leg travels as RTP packets. Each packet carries a sequence number and a timestamp. A companion protocol, RTCP, carries reports about the stream. RFC 3550 defines both.
Three facts shape everything below.
- Reports are periodic. RFC 3550 recommends a fixed minimum interval of 5 seconds between RTCP reports. A short glitch can fall between two reports.
- Counters are cumulative. The RFC says the difference in cumulative packets lost between two reports gives the loss in that interval. You compute intervals yourself.
- A receiver describes what it received. A report covers the stream flowing toward the reporter. It says nothing about the opposite direction unless that side reports too.
Many agent stacks never expose raw RTCP. They expose a stats API instead. The W3C WebRTC statistics specification defines the fields browsers and WebRTC libraries return, such as jitter, packetsLost and roundTripTime. Telephony providers publish their own summaries. Twilio Voice Insights returns average and max jitter and a packet loss percentage per call edge, plus a MOS value in its SDK edge metrics.
Jitter: the RFC 3550 definition and estimator
Jitter is variation in packet arrival spacing. It is not delay. A path with a constant 80 ms delay has zero jitter. A path with a 20 ms average delay and wild swings has high jitter.
RFC 3550 section 6.4.1 defines it with two formulas. Let S be a packet's RTP timestamp and R its arrival time, both in the same units.
- Difference: D(i,j) = (Rj - Ri) - (Sj - Si)
- Estimator: J(i) = J(i-1) + (|D(i-1,i)| - J(i-1)) / 16
D compares the gap between arrivals with the gap between sends. The estimator is a running average of |D|. The RFC says the 1/16 gain gives "a good noise reduction ratio while maintaining a reasonable rate of convergence." It also says to update the estimate as each packet arrives. The reported value is whatever J was when the report went out. The RFC points to Appendix A.8 for reference code.
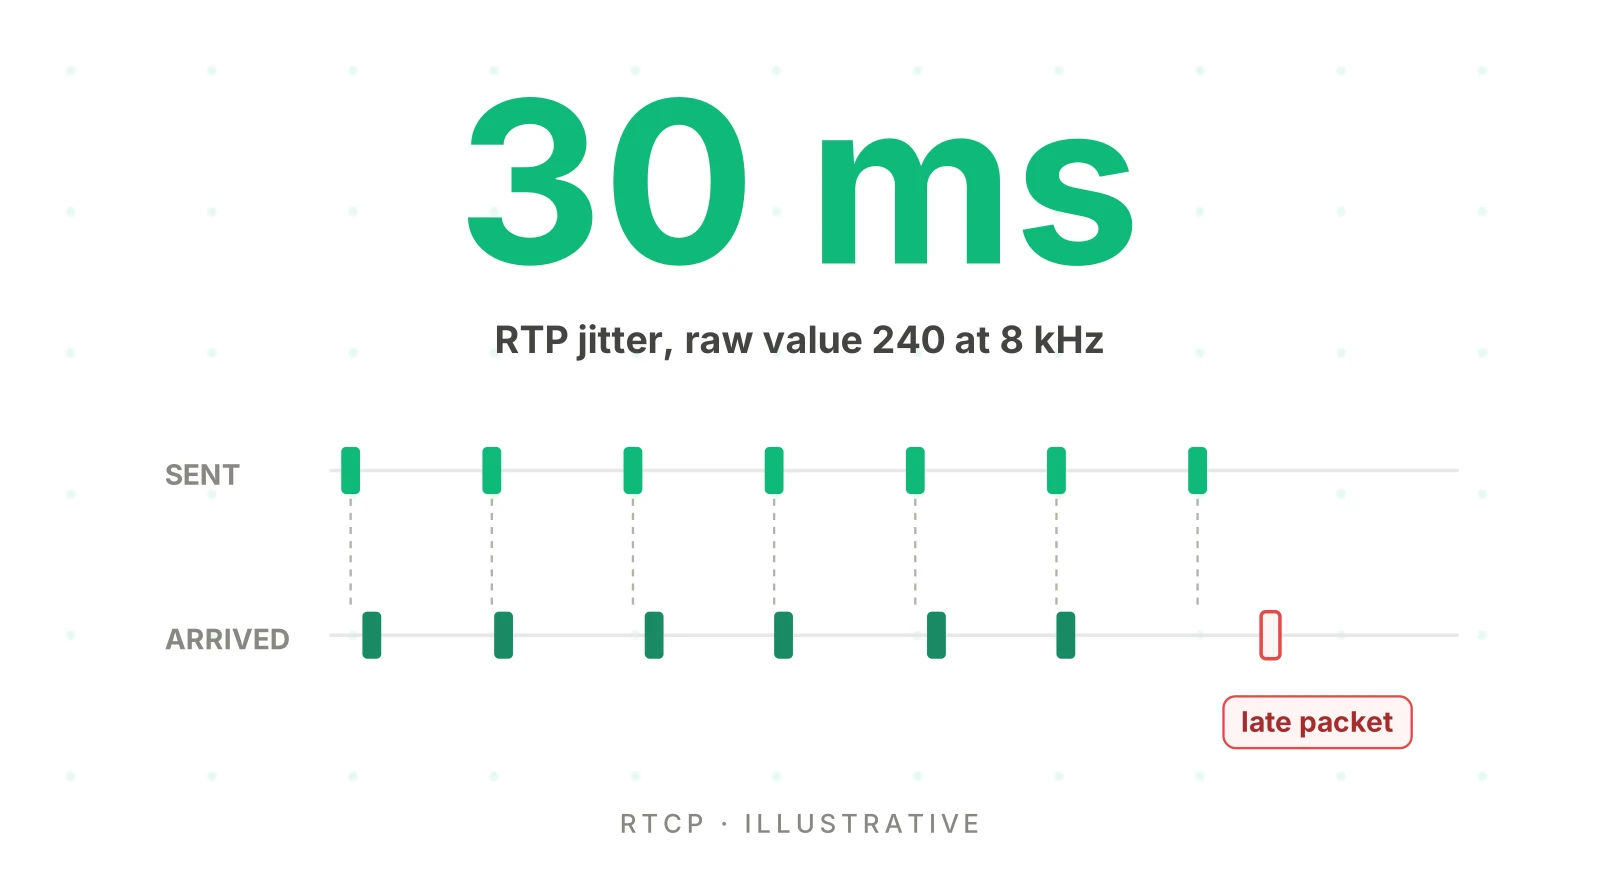
The field is "measured in timestamp units." The clock rate decides what a raw number means. RFC 3551 gives G.711 (PCMU and PCMA) an 8,000 Hz clock. A raw value of 240 is 30 ms. RFC 7587 says Opus uses a 48,000 Hz RTP clock for all modes. The same raw 240 is 5 ms. The W3C spec avoids the trap by reporting jitter in seconds.
A worked example
This is illustrative. A G.711 stream sends a packet every 20 ms. Seven packets arrive with these transit times (arrival minus send).
| Packet | Sent (ms) | Arrived (ms) | Transit (ms) | abs(D) (ms) | J after packet (ms) |
|---|---|---|---|---|---|
| 1 | 0 | 50 | 50 | - | 0 |
| 2 | 20 | 70 | 50 | 0 | 0.00 |
| 3 | 40 | 95 | 55 | 5 | 0.31 |
| 4 | 60 | 110 | 50 | 5 | 0.61 |
| 5 | 80 | 140 | 60 | 10 | 1.19 |
| 6 | 100 | 150 | 50 | 10 | 1.74 |
| 7 | 120 | 270 | 150 | 100 | 7.88 |
Check packet 6: J = 1.19 + (10 - 1.19) / 16 = 1.74. Check packet 7: J = 1.74 + (100 - 1.74) / 16 = 7.88. At 8 kHz, 7.88 ms is about 63 timestamp units.
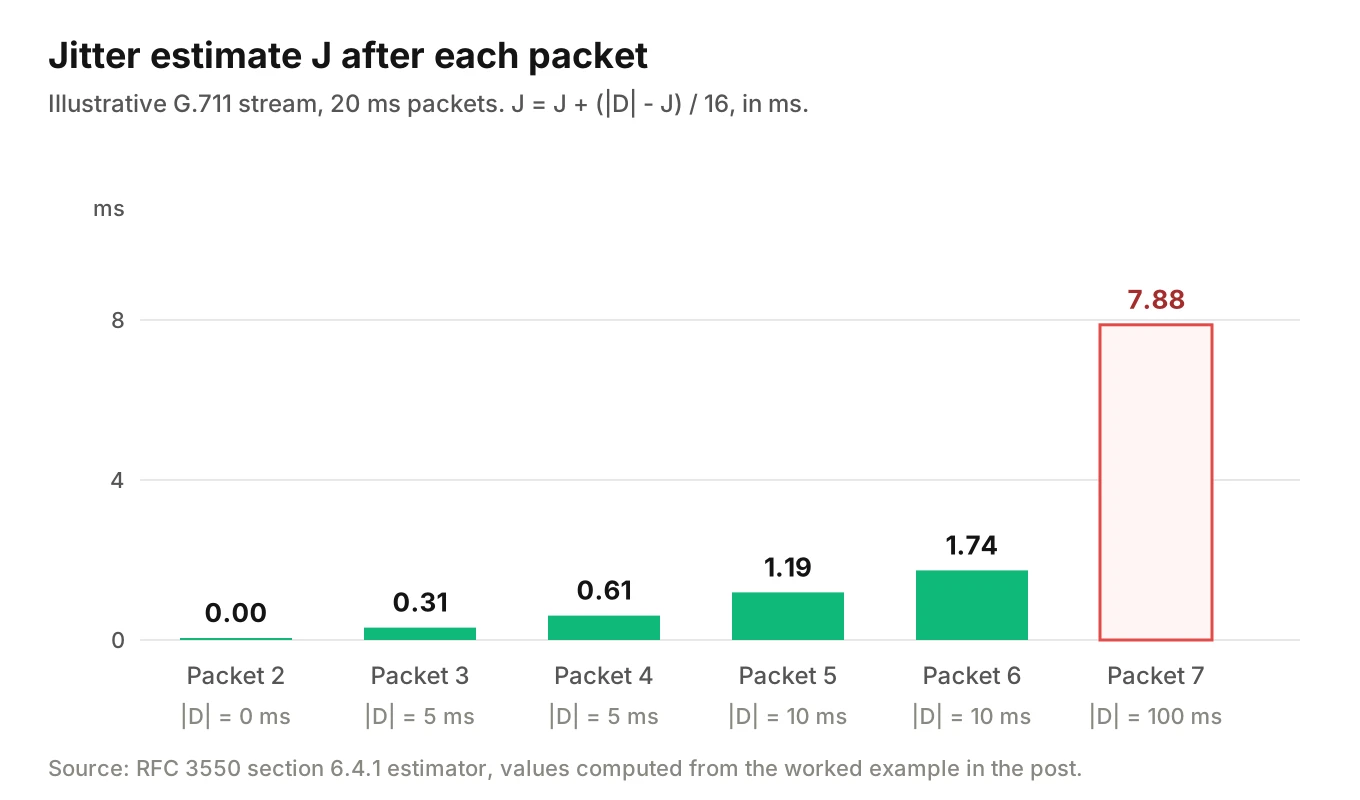
Two lessons follow.
- The estimator lags. Transit times in packets 1 to 6 span 10 ms, yet J is 1.74 ms. It is a smoothed mean, not a peak.
- A single late packet barely shows. Packet 7 arrived 100 ms late, which would likely miss a playout deadline. J rose by about 6 ms.
RFC 3550 section 6.4.4 adds a useful reading. Packet loss tracks persistent congestion, while jitter tracks transient congestion. It also notes jitter may indicate congestion before it leads to loss.
Jitter tells you the path is unsteady. It does not tell you whether audio was lost. That depends on the buffer, covered below.
Packet loss: fraction lost and cumulative lost
RTCP reception reports carry two loss fields. Both come from RFC 3550 section 6.4.1.
- Fraction lost is packets lost divided by packets expected, since the previous report. It is an 8-bit fixed-point number with the binary point at the left edge. A field value of 12 means 12/256. If loss is negative because of duplicates, it is set to zero.
- Cumulative packets lost is packets expected minus packets actually received, since the start of reception. It is a 24-bit field. It can be negative when duplicates arrive.
Expected packets come from the extended highest sequence number received, minus the initial one. So these fields count packets that never arrived. They do not count packets that arrived and were thrown away.
One average, one interval
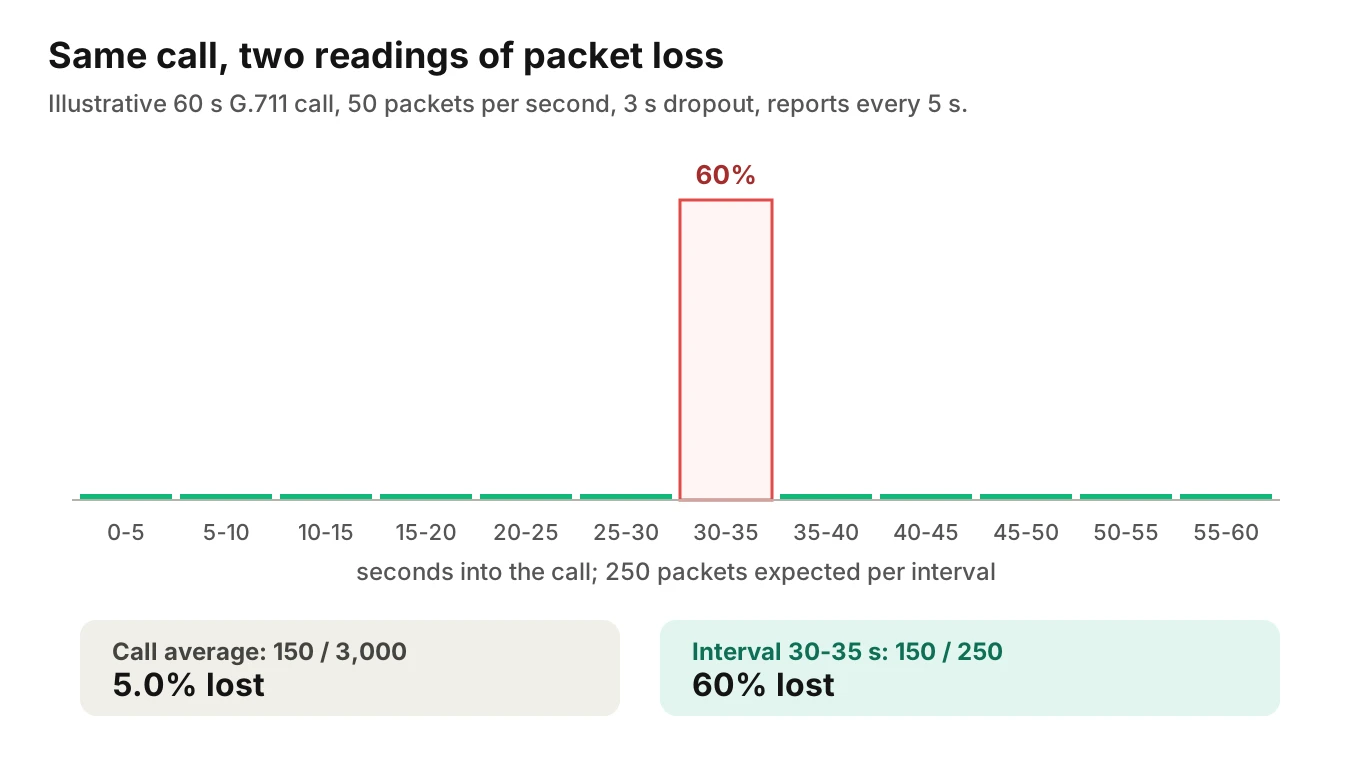
An illustrative case. A 60-second G.711 call sends 50 packets a second, so 3,000 packets are expected. A 3-second dropout loses 150 of them. Assume reports every 5 seconds, so each interval expects 250 packets.
- Call-level loss: 150 / 3,000 = 5.0%
- Interval with the dropout: 150 / 250 = 60%
- Other eleven intervals: 0%
A dashboard that stores only the final cumulative count shows 5%. The caller heard three seconds of nothing. Fraction lost has only 1/256 resolution (about 0.4%), but that is not the issue. The problem is the averaging window.
Late packets are a separate count
A packet that arrives too late for playout never shows as lost in RTCP. The receiver got it. The W3C spec exposes packetsDiscarded as "the cumulative number of RTP packets discarded by the jitter buffer due to late or early-arrival." RTCP XR (RFC 3611) carries the same idea as a separate discard rate. For what a listener experiences, you want loss plus discards.
The W3C spec also warns that packetsLost "can be negative if more packets are received than sent." Treat a negative value as duplicates, not as a bug in your dashboard.
Round-trip time from RTCP
RTCP can measure round-trip time without synchronised clocks. A sender report carries a timestamp. The receiver echoes the middle 32 bits of it as LSR and reports DLSR, the delay between receiving that report and sending its own, in 1/65536 second units. The sender notes arrival time A and computes the round-trip propagation delay as A - LSR - DLSR. This is RFC 3550 section 6.4.1.
Illustrative arithmetic. The sender report goes out at 10.000 s. The reply arrives at 10.380 s. The receiver held it for 0.250 s. Then 10.380 - 10.000 - 0.250 = 0.130 s, or 130 ms.
Know the limits.
- It needs a two-way exchange. A leg with no sender reports yields no value. The W3C spec counts valid measurements in
roundTripTimeMeasurements. - It is round trip, not one-way. Do not halve it and call it mouth-to-ear delay.
- It stops at the RTP endpoints. It excludes speech-to-text, the model and speech synthesis. For those clocks, see what to measure for voice agent latency.
The W3C roundTripTime is "based on the RTCP timestamps in the RTCP Receiver Report." RFC 3611 reports a "round trip delay" in milliseconds in its VoIP metrics block.
Jitter buffers: where jitter becomes loss
Receivers hold packets briefly and play them at an even pace. That holding area is the jitter buffer. A deeper buffer absorbs more variation and adds delay to every packet. A shallow one cuts delay and discards more late packets. Jitter itself is harmless until it exceeds what the buffer absorbs.
When a gap remains, the decoder fills it with packet loss concealment. Three W3C fields show what the buffer and decoder did.
| Field | Definition in short | What you derive |
|---|---|---|
jitterBufferDelay and jitterBufferEmittedCount | Total time samples spent in the buffer, and samples that left it | Average buffer delay = first divided by second |
packetsDiscarded | Packets dropped as late or early | Late-loss count |
concealedSamples, totalSamplesReceived, concealmentEvents | Samples the decoder synthesised, all samples received, and how many separate gaps began | Concealment share and gap count |
Illustrative: 4,800 seconds of buffer time over 80,000 emitted samples is 0.06 s, or 60 ms per sample. The timestamp alignment post uses the same arithmetic to explain why spans disagree with a recording.
Codec effects: G.711 and Opus in general
The codec sets how audio is packetised and how gracefully loss is handled. This is only the part that matters for reading metrics. The phone audio quality post covers the codec chain in depth, and SIP versus WebRTC covers the transports.
- G.711. RFC 3551 says PCMU and PCMA use 8-bit samples at an 8,000 Hz clock, with 20 ms packets by default. That works out to 64 kbit/s, since 8 bits at 8,000 samples a second is 64,000 bits a second.
- Opus. RFC 6716 describes bitrates from 6 to 510 kbit/s and frame sizes from 2.5 to 60 ms. It can add in-band FEC, but RFC 7587 says the encoder decides whether to send it. A receiver cannot assume it is on.
Two consequences for metrics. Identical loss can sound different on different codecs, because frame size and concealment differ. And raw jitter numbers are only comparable after you convert them to milliseconds.
MOS and the R-factor are estimates
Mean opinion score is a rating of perceived quality. It is a number a listener gives, or a model predicts. Production calls are not rated by listeners, so what appears on a dashboard is almost always a prediction.
What the primary sources let me state:
- The model. ITU-T G.107, "The E-model: a computational model for use in transmission planning," is in force as the 06/15 edition. Its title says what it is for: planning.
- The listening method. ITU-T P.800, "Methods for subjective determination of transmission quality," dates from 08/96. P.800.1 covers MOS terminology (07/16).
- The RTCP report. RFC 3611 defines an R factor from 0 to 100, with 94 as toll quality, and MOS-LQ and MOS-CQ on a 1 to 5 scale. MOS-LQ, the listening quality score, "is defined as not including the effects of delay." MOS-CQ, the conversational quality score, includes delay. A value of 127 means unavailable.
- A provider's MOS. Twilio documents
mosin its SDK edge metrics as "a function of jitter, packet loss, and round-trip time" on a 0 to 5 scale, where "anything above 4 is considered acceptable."
The ITU pages I opened show titles and editions, not the full text. So I do not reproduce the E-model formula or its category bands here. The phone audio post walks through a simplified calculation if you want the arithmetic.
What this means in practice:
- Estimate, not measurement. A MOS from network counters predicts what a listener would rate. Nobody listened.
- Scales differ. A 0 to 5 provider scale and a 1 to 5 report field are not interchangeable. Store the source name with the value.
- Listening versus conversational. A listening-only score ignores delay. A conversational one includes it. They answer different questions.
- It knows nothing about the agent. Model delay, endpointing and tool calls are outside it.
Matching what callers say to the signals
Callers do not say "discard rate." They say "choppy." The table maps common reports to the signals worth checking first. Treat each row as a hypothesis to test.
| Caller says | Signals to check | What could be a different cause |
|---|---|---|
| "Choppy" or "breaking up" | Interval loss, packetsDiscarded delta, concealmentEvents, jitter against buffer delay | Noise suppression artifacts; a transcode on the path |
| "Robotic" | Concealed share of samples, codec change between legs | The synthetic voice itself on a clean line; downsampling |
| "You cut out" | Burst loss in one interval; received packet count not rising | Agent ended the turn early; barge-in; endpointing |
| "Can't hear you" | Received counter flat in one direction; no reports from that side | Muted track, wrong channel, agent never started speaking |
| "Long pauses" | Round-trip time, jitter buffer delay | Model, tool or synthesis time, usually larger |
| "Echo" | None of these counters | Echo cancellation failure; see the echo and noise post |
Two cautions.
- Clean counters rule out less than you think. "Robotic" on a clean network points to the voice or the resampling. Loss and jitter will look fine.
- Noise is not a network metric. Background noise changes what the agent hears without moving a single RTP counter. See testing speech-to-text under background noise.
What each metric can and cannot tell you
This table sums up the voice call quality metrics jitter packet loss mos and the RTCP fields behind them.
| Metric | Source | It can tell you | It cannot tell you |
|---|---|---|---|
| Interarrival jitter | RTCP, jitter | The path was unsteady | Whether audio was lost; peak delay |
| Fraction lost | RTCP | Loss in the last interval | Which packets, or when inside the interval |
| Cumulative lost | RTCP | Total loss since start | Burst timing; late discards |
| Discards | packetsDiscarded, RTCP XR | Late packets dropped by the buffer | Why they were late |
| Round-trip time | RTCP, roundTripTime | RTP-level two-way delay | One-way delay; agent processing time |
| Concealment | W3C counters | How much audio the decoder invented | Whether the words were understood |
| MOS, R-factor | Model or provider | A planning-grade estimate | What any listener actually heard |
How to attach call quality metrics to a trace
The goal is to read a bad call's trace and see the network state at each turn. OpenTelemetry attributes are the right container. The span attributes post covers per-turn fields, and tracing a call end to end covers the span tree.
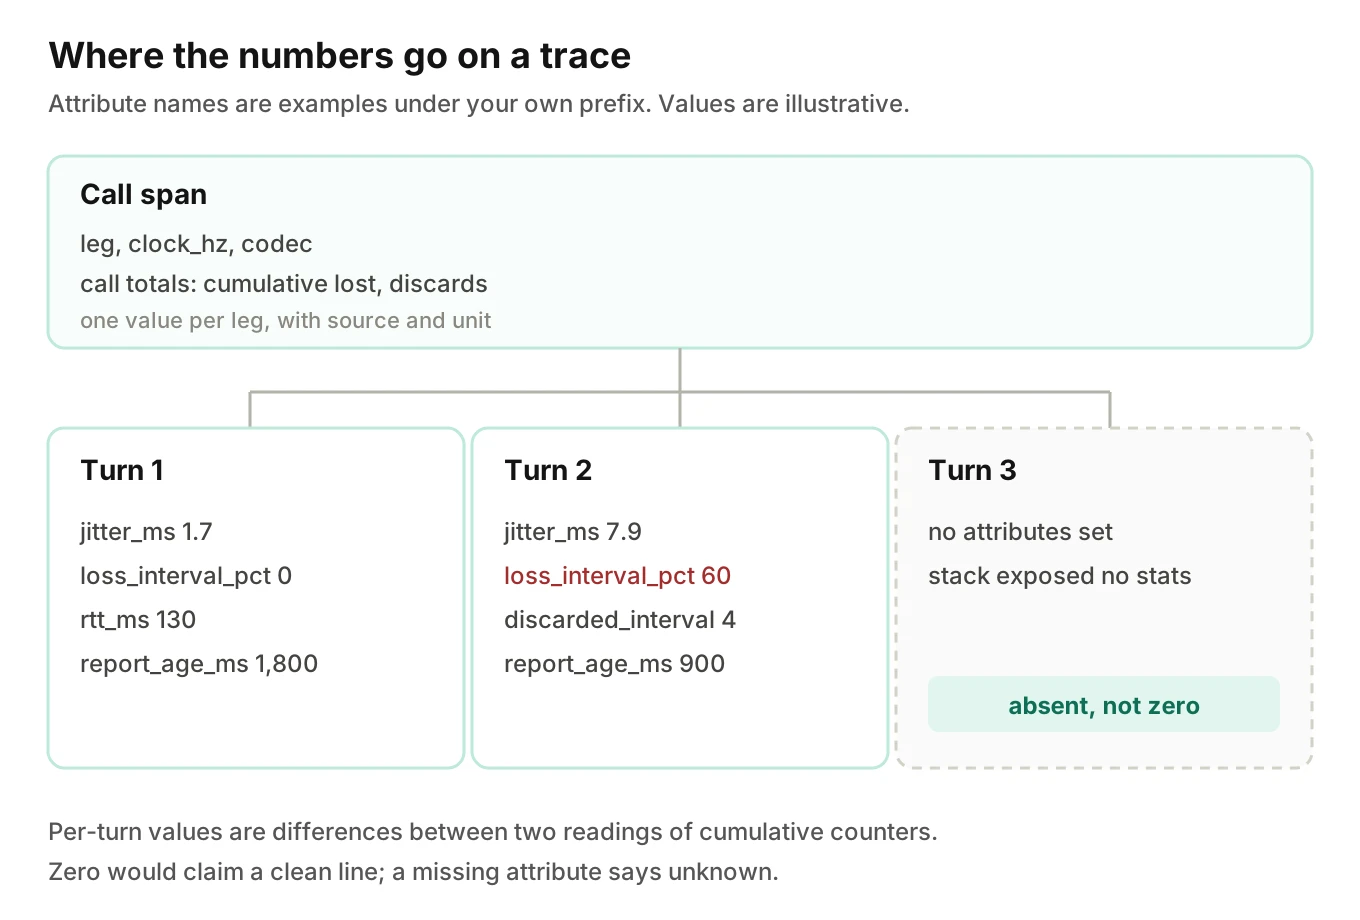
1. Pick the leg - Record which leg a number describes: caller to media server, media server to agent, or provider edge. Put it in an attribute.
2. Poll and diff - Read the stats at the start and end of each turn. Subtract cumulative counters. Store interval values, not only totals.
3. Convert units - Turn raw RTCP jitter into milliseconds using the clock rate. Store the clock rate beside it.
4. Name attributes with your own prefix - OpenTelemetry naming guidance says to use lowercase, dot-delimited names. It reserves otel.* and tells you to prefix custom names with your own namespace. There is no standard attribute for jitter, so these names are yours.
5. Mark absent as absent - If a stack exposes no stats, omit the attribute. Do not write zero. Zero claims a clean line.
6. Stamp the report age - Add how old the last RTCP report was at the turn boundary. A report from 5 seconds ago may not cover the turn.
7. Link the recording - Store the call and trace IDs with the recording, as in linking recordings to traces. Then a number can be checked by ear.
Here is a simplified helper. The acme prefix is a placeholder.
// Simplified sketch. Attribute names are examples, not an OpenTelemetry standard.
function networkAttrs(prev, curr, clockHz) {
  const expected = curr.expected - prev.expected;
  const lost = curr.cumLost - prev.cumLost;
  return {
    "acme.rtp.leg": curr.leg,
    "acme.rtp.clock_hz": clockHz,
    "acme.rtp.jitter_ms": (curr.jitterUnits / clockHz) * 1000,
    "acme.rtp.lost_interval": lost,
    "acme.rtp.loss_interval_pct": expected > 0 ? (100 * lost) / expected : undefined,
    "acme.rtp.discarded_interval": curr.discarded - prev.discarded,
    "acme.rtp.rtt_ms": curr.rttMs,
    "acme.rtp.report_age_ms": curr.nowMs - curr.reportMs,
  };
}

function setPresent(span, attrs) {
  for (const [key, value] of Object.entries(attrs)) {
    // Skip missing or non-finite values: absent is not zero.
    if (typeof value === "string" || Number.isFinite(value)) span.setAttribute(key, value);
  }
}
Put call-level totals on the call span and per-turn intervals on each turn span. Keep any MOS value separate, with its source and scale in its own attributes.
Where Evalgent fits
Evalgent Observe, which is launching, ingests OpenTelemetry data from any stack and traces a failed call to the step or handoff that caused it. Network attributes like the ones above are data you supply. Evalgent does not measure audio quality and is never in the media path. Where your data is blind to the network, the finding is "undetermined" and the coverage gap is shown. See what voice agent observability is and voice agent root cause analysis.
For testing, Evalgent caller Profiles include background noise as one of seven parameters, alongside accent and speech pace. Reviews replay test calls with audio and transcript together. If you want to see either on a call, you can use a short demo.
Frequently asked questions
What is jitter in voice calls?
Jitter is variation in the spacing of packet arrivals. RFC 3550 defines it as a running estimate of the difference between arrival spacing and send spacing, in RTP timestamp units. A path with steady delay has no jitter, however long the delay is. High jitter forces the receiver to buffer more or discard late packets.
How is jitter calculated in RTP?
For each packet, compute D, the arrival spacing minus the send spacing, in timestamp units. Then update J = J + (|D| - J) / 16. The 1/16 gain smooths the result. Divide by the stream's clock rate to get seconds. RFC 3550 section 6.4.1 gives both formulas.
What is the difference between packet loss and jitter?
Packet loss counts packets that never arrived. Jitter measures how unevenly the arrived packets were spaced. They connect through the jitter buffer: packets delayed beyond what the buffer absorbs are discarded, which sounds like loss but is not counted as loss in RTCP. Look at both, plus discards.
What does RTCP round-trip time measure?
It measures the round-trip propagation delay between two RTP endpoints, computed as arrival time minus LSR minus DLSR. It needs a sender report and a reply. It does not measure one-way delay, and it excludes speech-to-text, model and synthesis time on the agent side.
What is a good MOS score for voice calls?
There is no single answer, because scales and methods differ. Twilio documents mos on a 0 to 5 scale and calls anything above 4 acceptable. RFC 3611 uses 1 to 5. Compare only values from the same source. A network-derived MOS is an estimate and ignores your agent's processing delay.
Why does my voice call sound robotic?
Possible causes include concealment filling gaps, a codec change between legs, downsampling, or the synthetic voice itself. Check concealed samples and codec on each leg. If the counters are clean, suspect the voice settings or resampling rather than the network.
Can MOS be measured on a live call?
Not in the listening-test sense. A live MOS value is computed from stats such as loss, jitter and delay using a model like ITU-T G.107. Nobody rated the call. Treat it as a planning-grade estimate and label it with its source.
How do I add call quality metrics to traces?
Read the stats at each turn boundary, diff the cumulative counters, convert jitter to milliseconds and set the values as span attributes under your own prefix. Omit attributes when a stack exposes no data, so absent is never recorded as zero. Store the leg and the report age beside each value.
The bottom line
Jitter, packet loss, round-trip time and MOS describe the network path, and MOS is always a model's estimate rather than a measurement. Record them per turn on the trace with their leg, units and source, and treat a missing value as unknown rather than clean.
Related Articles

How to automate voice agent testing: synthetic callers vs manual QA
Learn how ai test automation replaces manual QA for voice agents. Compare synthetic callers vs human testers, with a 5-step framework to scale without hiring.
Read more
AI Agent Testing vs Voice Agent Testing: What General Tools Miss for Voice
AI agent testing measures text outputs. Voice agent testing measures behaviour through an acoustic pipeline. Five failure categories general tools miss.
Read more