Retell AI Observability: Call Analysis, Logs and Gaps
On this page
A caller says the agent "paused, then asked me the same thing twice." You open Retell. There is a call, a transcript and a latency figure. Whether that answers the complaint depends on what the platform records and what it leaves to you.
This post lists what Retell AI observability covers per Retell's own documentation, with each page opened on November 19, 2026. It separates three things. What Retell shows. What you add in your own store. What the platform view does not show on its own. It ends with a five-step pipeline built on Retell webhooks.
For the wider map, read what is voice agent observability. For the buyer checklist, read voice agent observability. For a platform comparison, see Vapi vs Retell. This post does not repeat them.
What Retell AI observability gives you per its docs
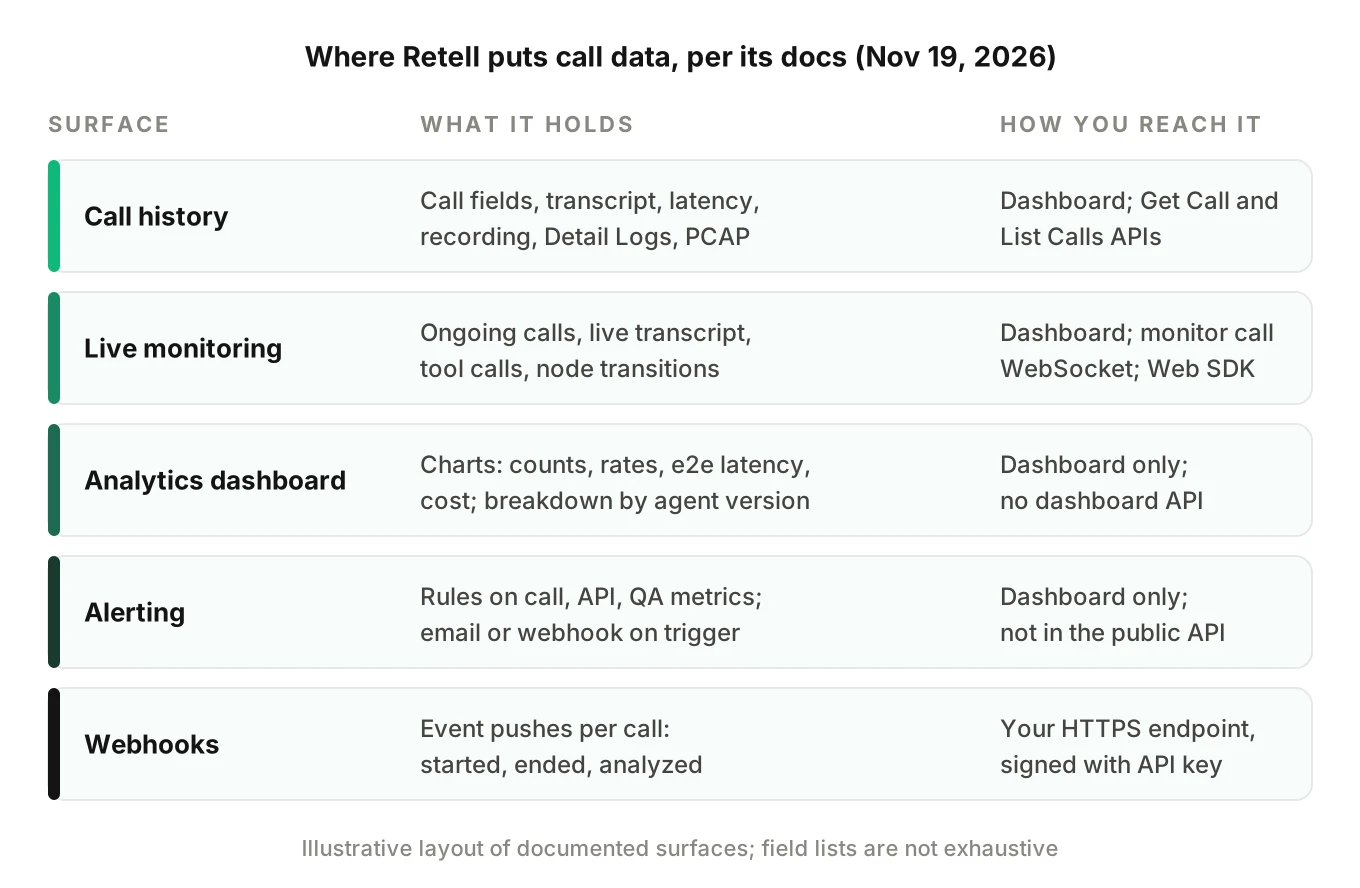
Retell's observability sits in two places. The dashboard is for people. The APIs and webhooks are for your systems. The table maps them.
| Surface | What it holds | How you reach it |
|---|---|---|
| Call history and session history | Call fields, transcript, recording, latency, Detail Logs, packet capture | Dashboard; Get Call and List Calls APIs |
| Live monitoring | Ongoing calls with a live transcript | Dashboard; monitor call WebSocket; Web SDK |
| Analytics dashboard | Charts on counts, rates, latency and cost | Dashboard only |
| Alerting | Rules on call, API and QA metrics | Dashboard only |
| Webhooks | Event pushes per call | Your HTTPS endpoint |
Call history and Retell AI call logs
The session history page says history is for "investigating problems, reviewing transcripts and analysis, comparing sessions, and exporting filtered sets for offline work." The call table adds duration, direction, end reason, outcome and end-to-end latency.
Each call opens a detail panel with a conversation analysis block, a summary and a transcription view. The transcription view shows messages, tool calls and results, node transitions, in-call SMS and knowledge base retrievals. A separate data tab holds dynamic variables and metadata. Calls also get recording playback, latency, Detail Logs and Packet Capture.
Filters cover agent and version, disconnection reason, sentiment, cost, analysis fields, dynamic variables and metadata. Filtered views persist per workspace and appear in the URL, so you can share one. That is the closest thing to Retell AI call logs you can hand to a colleague.
The Get Call API returns the same record as JSON. One field is useful when you debug: public_log_url. The page describes it as a log of LLM WebSocket requests and responses, plus per-turn latency.
The call object: fields worth storing
Field names below come from the Get Call page. Presence depends on the call.
| Question | Field | Note from the docs |
|---|---|---|
| Which agent and release? | agent_id, agent_version, agent_tag | The tag is frozen at call creation |
| How did it end? | disconnection_reason | 39 listed values, from user_hangup to error_llm_websocket_lost_connection |
| How long? | start_timestamp, end_timestamp, duration_ms | Timestamps are milliseconds since epoch |
| Was it slow? | latency | Per component: e2e, asr, llm, tts, knowledge_base, s2s |
| What was said? | transcript_object | Utterances with per-word start and end in seconds |
| What did tools do? | transcript_with_tool_calls | Interleaves tool calls, results, node transitions and DTMF |
| What did it cost? | call_cost | Per-product costs in cents, plus a combined figure |
| Which telephony call? | telephony_identifier | Holds twilio_call_sid when available |
| Your own context? | metadata, collected_dynamic_variables | Metadata is "not used in processing" |
Two details matter for the latency field. First, each component is a CallLatency object with p50, p90, p95, p99, min, max, num and a values array of every data point. Second, the page says not every field appears on every call. Check for a key before you read it.
The e2e field is measured from the user finishing speaking to the agent starting to speak. The page says it excludes the Retell-to-frontend network trip. So it is not what the caller heard on the line. See trace a voice call end to end for the legs outside it.
Transcript timestamps, and what they are relative to
Each utterance in the transcript_object field has a words array. Every word has start and end in seconds. The page says they are relative to the call audio, not wall-clock time, and that word timestamps are approximate.
That has a consequence for any metric you build. To compare a Retell transcript with a span from your own server, you need an anchor. Use start_timestamp as the call's wall-clock start. Then treat the offset as approximate. Voice agent call ID correlation covers the joins.
Utterance metadata can also carry interrupted, which the page describes as whether the user cut off the agent. It applies to Retell LLM and conversation flow agents only. It is a flag Retell computes, so you can store it without deriving it.
Retell call analysis and custom analysis data
The post-call analysis page lists four default fields: call_summary, user_sentiment, call_successful and in_voicemail. You can add custom fields of four types: boolean, text, number and selector. Each needs a name, a description for the LLM and a type.
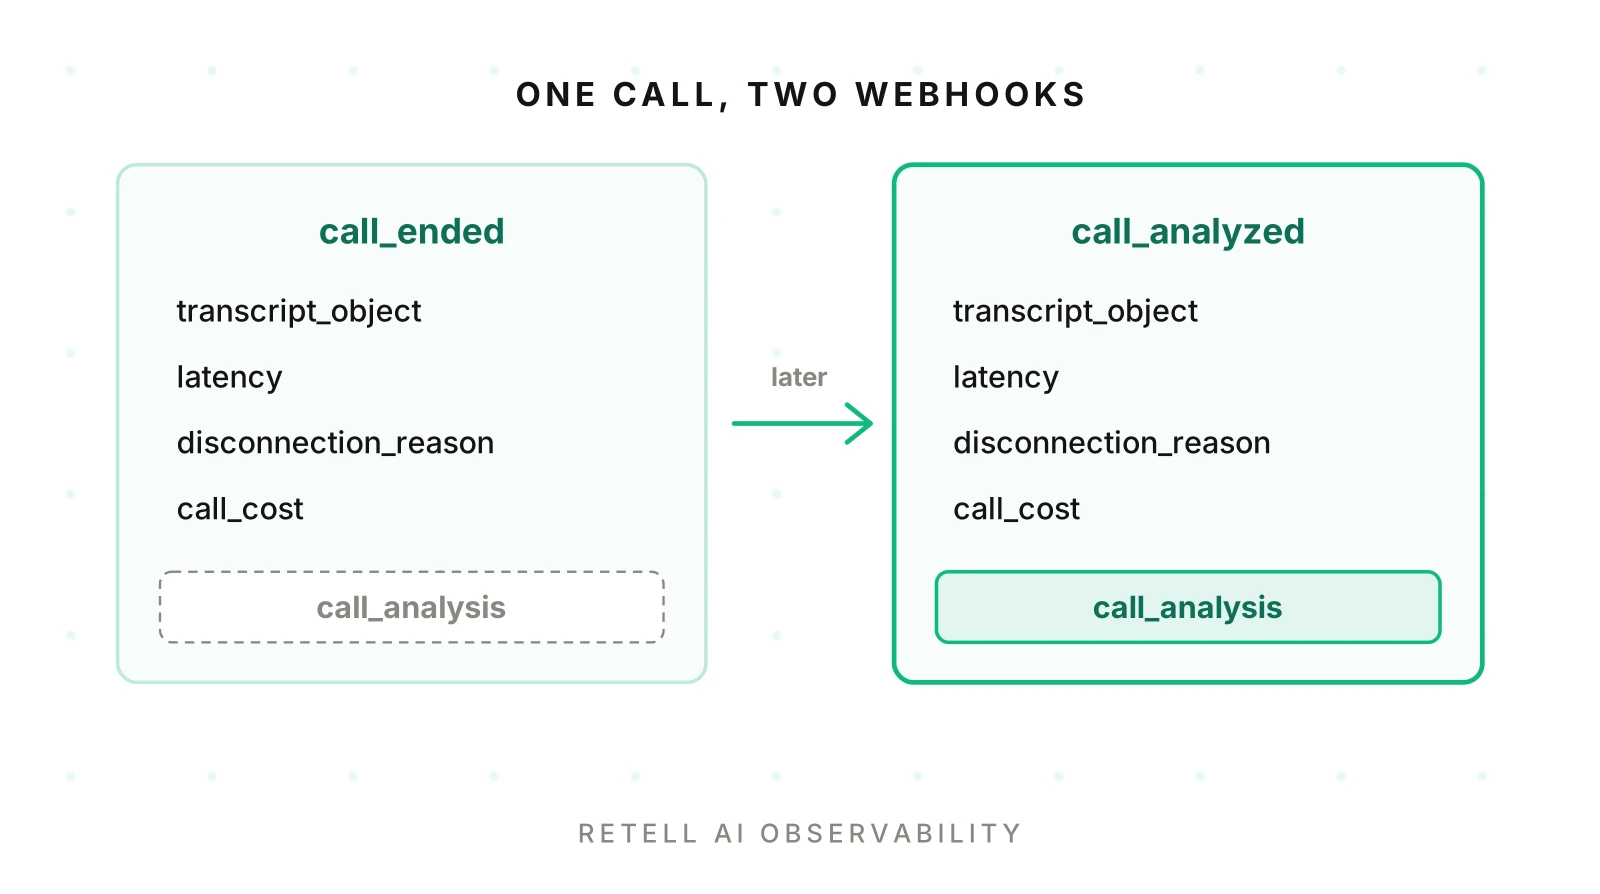
Retell call analysis runs after the call ends. The sequence matters for pipelines. Retell fires call_ended, analyzes the transcript, then fires call_analyzed. The call_ended payload does not contain call_analysis. The page says the analysis "reads the transcript with an LLM" and does not name a model.
Results land in call_analysis.custom_analysis_data. The page warns that custom fields are not populated for calls that never connected or had no conversation. So treat every analysis field as optional.
Both readings of call_successful are LLM judgements over the transcript. Store them next to the raw fields, not instead of them.
Live monitoring
The live monitoring page describes a list of ongoing calls that refreshes about every four seconds. It streams a live transcript with tool calls and node transitions. People with call-management permission can listen live, take over or end a call.
A monitor call WebSocket can also stream the transcript to your server. Live monitoring is for the call in progress, not a record of ended calls.
The analytics dashboard and Retell AI analytics
The analytics dashboard page describes call dashboards with column, bar, line, donut and number charts. Metrics include call counts, success rate, call status, disconnection reason, user sentiment, call duration, end-to-end latency, concurrency and combined cost.
You can break charts down by agent, agent version, disconnection reason and post-call extraction fields. You can bucket by hour, day, week or month and overlay the previous period. Any custom extraction field can drive a chart.
So release comparison is partly there. A breakdown by agent version lets you split a chart before and after a change. Two limits from the same page: there is no dashboard API, and a chart renders at most 3,000 data points. If you need these numbers in another tool, compute them from the call records you store.
AI QA on a sampled cohort
The AI QA overview describes automatic evaluation of a sampled set of calls against rules you configure. You group calls into a cohort by agent, date range and other filters, then set how many to sample. The page lists trends such as average score, resolution rate and latency. It also lists call-level diagnostics such as hallucinations, knowledge base accuracy, overlapping speech, sentiment and tool usage, each backed by transcript evidence.
Two scoping points. It works on a sample, not every call. And the page does not define how it differs from post-call analysis. If AI QA covers your question, use it. If you need every call scored on your own criteria, store the raw fields.
Retell monitoring: alert rules
The alerting page describes rules you create in the dashboard's Alerting tab. Metrics include number of calls, concurrency used, call success rate, negative sentiment rate, total call cost, API error count, QA not passed, custom function latency, custom function failures and transfer call failures. I did not see end-to-end latency in that list.
Each rule uses one of two threshold types: a fixed value, or a change against the last cycle. You can filter by agent, environment tag, disconnection reason and post-call extraction fields. Channels are email and a webhook. The webhook sends alert_triggered, then alert_resolved, with an HMAC-SHA256 signature. Retell waits up to 10 seconds and does not retry.
Limits to plan around. A workspace can have up to 10 rules. Only one incident stays open per rule, with no repeat notifications while it persists. Alerting is dashboard-only, not in the public API. For what to page on, read voice agent alerting.
Packet capture for SIP calls
The PCAP debugging page says packet capture files are available on the call details dashboard. For a Retell SIP call they can show SIP signalling such as INVITE and BYE, codec negotiation, DTMF settings and RTP streams including packet loss and jitter, if RTP is captured. Some files contain signalling only. For custom SIP trunks, the page says to capture on the server or gateway that terminates SIP.
Retell webhooks: events, payloads and delivery
Retell webhooks are the cleanest way to get data into your own store. The webhook overview lists the voice events: call_started, call_ended, call_analyzed, transcript_updated, transfer_started, transfer_bridged, transfer_cancelled and transfer_ended. Default subscriptions are the first three. Set webhook_events on an agent to change that.
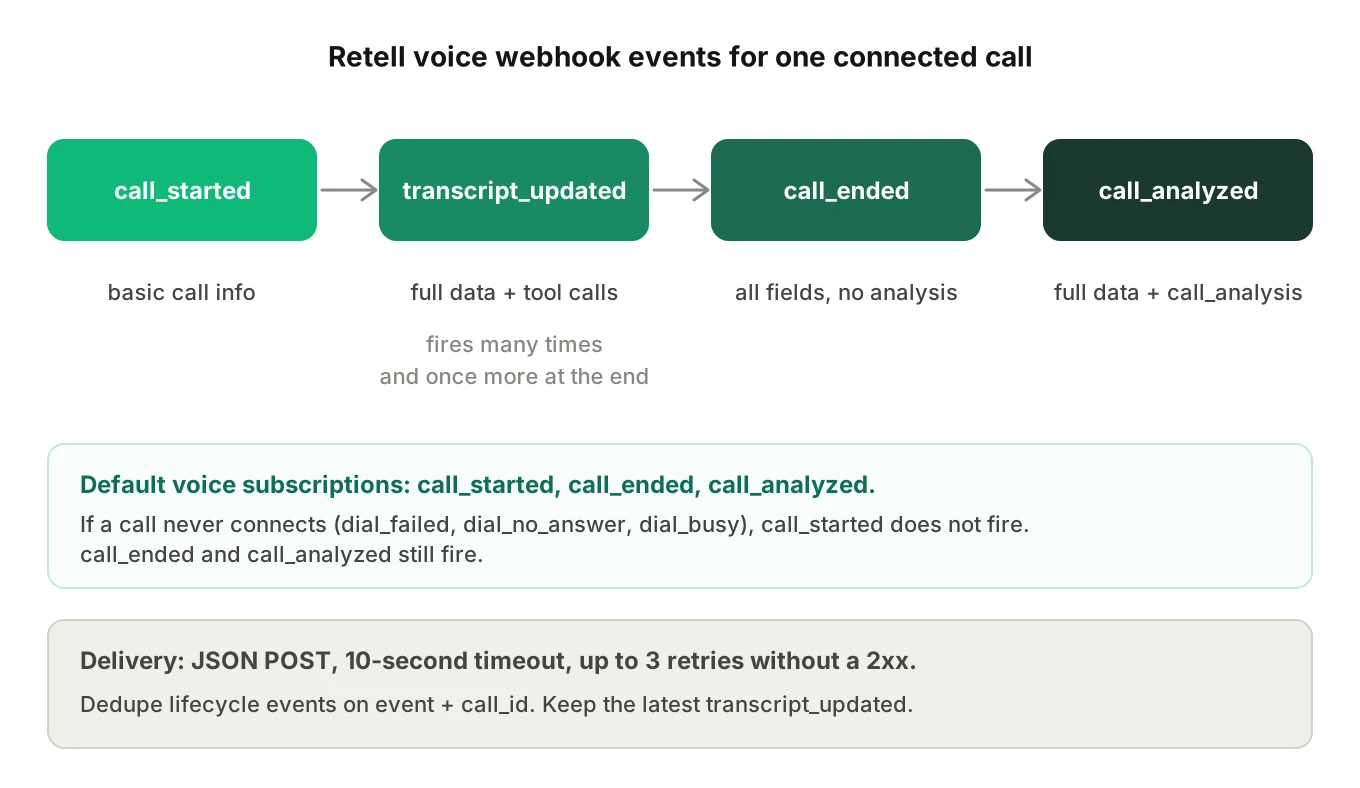
What each payload carries, per the page:
call_startedholds basic call information.call_endedholds all call object fields exceptcall_analysis. It includes the transcript fields.call_analyzedholds full call data, includingcall_analysis.transcript_updatedholds full call data plustranscript_with_tool_calls. It fires during turn-taking and once more when the call ends.- Transfer events add
transfer_destination, andtransfer_endedadds the updatedcall_costandtransfer_end_timestamp.
Three behaviours are easy to miss. If a call never connects, such as dial_no_answer, call_started does not fire. But call_ended and call_analyzed still do. Delivery is not blocking, so a failed call_started does not stop call_ended. And webhooks always include full, unscrubbed call data, whatever the agent's data_storage_setting says. That setting controls only what Retell keeps afterward.
Registration works at two levels. An account-level URL is set in the dashboard. An agent-level webhook_url replaces it for that agent. Webhook URLs support dynamic variables.
Delivery is a JSON POST with a 10-second timeout. Without a 2xx, Retell retries up to three times. The page says to deduplicate lifecycle events on event plus call_id. For transcript_updated, keep the latest.
How to verify Retell webhooks
The secure webhook page describes the X-Retell-Signature header in the form v={timestamp},d={hex_digest}. The steps are:
1. Parse the timestamp and digest from the header.
2. Reject a timestamp more than five minutes from now, to block replays.
3. Compute HMAC-SHA256 over the raw body with the timestamp appended, keyed with your API key.
4. Compare with the digest in constant time.
Use the raw body, not re-serialized JSON. Only an API key with the webhook badge can verify. The overview also shows the SDK's verify call, which is the simpler path. You can allowlist Retell's IP address listed on the page too.
Pull call data with the Retell API
Webhooks are push. The APIs are pull, and they backfill gaps. The List Calls reference documents POST /v3/list-calls with a filter_criteria object, a limit of up to 1,000, and a pagination_key cursor. Filters include agent and version, disconnection reason, call_successful, e2e_latency_p50, tool call outcomes, custom analysis data and metadata.
The catch: the v3 list payload omits transcript, transcript_object, transcript_with_tool_calls and recording_url. For those, fetch the single call. The Get Call page documents GET /v2/get-call/{call_id}. The List Calls page refers to a /v1/get-call/{call_id} path for the same purpose. The two pages disagree on the version, so confirm the current path in the API reference before you code against it.
What the platform view does not show
The gaps below are not defects. They are limits of one platform's own view, and each argues for a second record. Retell AI observability is strong per call. It is thinner across calls.
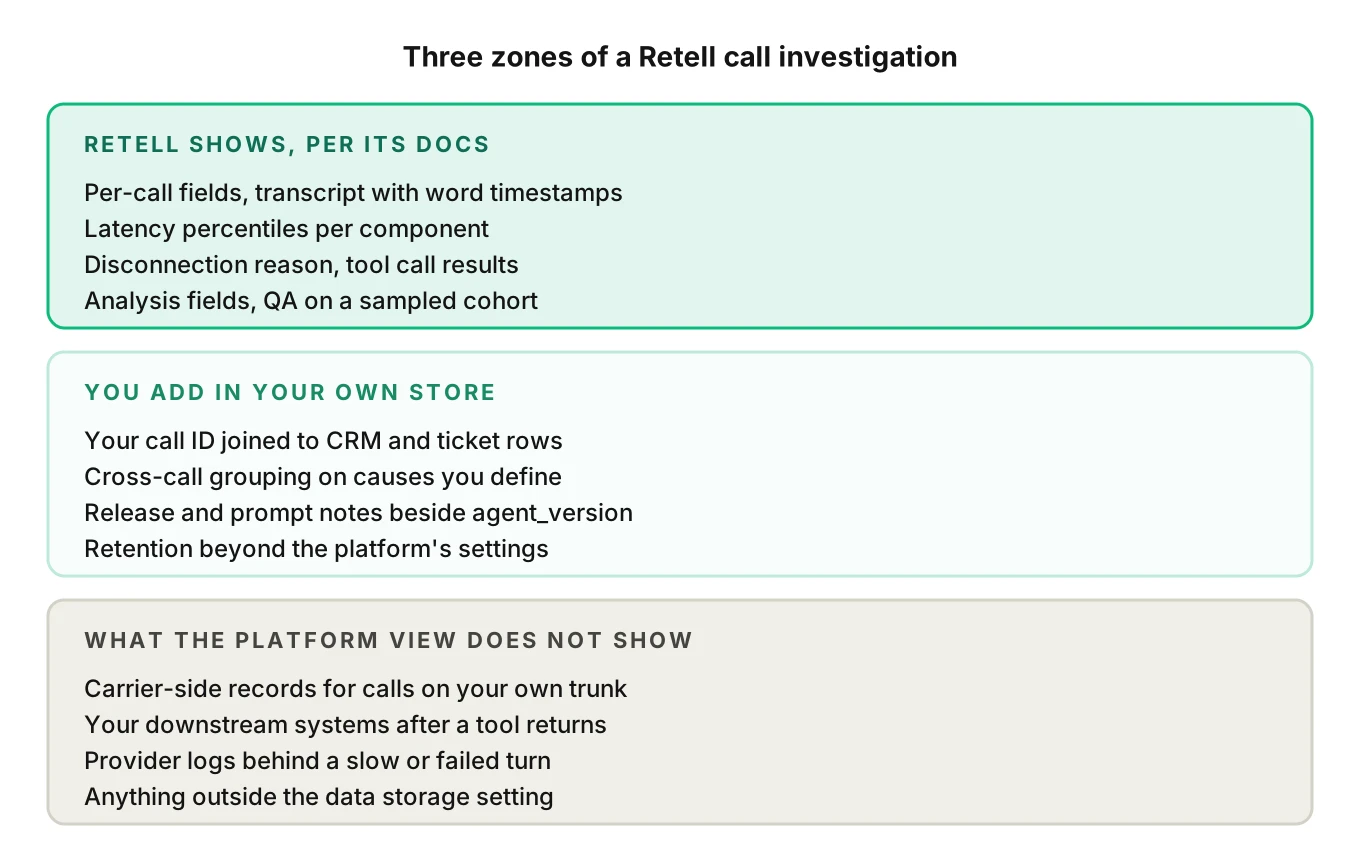
- A cross-call view on your causes. Retell has analytics breakdowns and AI QA on a sample. I found no documented way to group failures across all calls by a cause you define, such as one tool or one vendor. See cluster voice agent failures.
- Business outcomes. A tool can return success and write the wrong record. Retell sees the tool result. Your CRM sees the record. See detect silent tool failures.
- Carrier-side records. For calls on your own trunk, Retell's PCAP guide itself says to capture at your gateway. The carrier's records stay with the carrier.
- Provider logs. If a model or speech provider misbehaves, the cause sits in that provider's logs.
- Release context.
agent_versiontells you which version ran. It does not say what changed or why. Keep release notes beside it. - Longer retention on your terms.
data_storage_settingofferseverything,everything_except_piiandbasic_attributes_only. Withopt_in_signed_url, recording and log links expire after 24 hours. Copy what you need.
I also looked for OpenTelemetry or Langfuse export. As of November 19, 2026, I found no page on either in Retell's documentation index, which lists pages on webhooks, APIs, alerting and QA. So treat an OpenTelemetry export as something you build from webhooks and APIs. If Retell adds one, it will be on the docs site first.
How to build a basic Retell AI observability pipeline in 5 steps
The code is simplified and illustrative. Copy exact details from Retell's pages.
1. Register one endpoint — Set an account-level webhook URL in the dashboard, or an agent-level webhook_url if you want per-agent routing. Keep the three default events. Add transcript_updated only if you need live data, since it fires many times per call.
2. Verify, queue, acknowledge — Check the signature on the raw body, put the event on a queue and return 2xx fast. Retell times out at 10 seconds.
3. Store raw events once — Key each lifecycle event on event name plus call_id. Keep the raw JSON untouched. You will want it when a field changes.
4. Merge into one row per call — Upsert on call_id. call_ended fills the transcript, latency and cost columns. call_analyzed fills analysis columns later. Backfill missed calls with List Calls, then Get Call for transcripts.
5. Derive fields and slice them — Compute your own flags from stored fields, then group by agent version, disconnection reason and tool. Page on a small set, and keep the rest on a dashboard.
A simplified receiver for steps 1 and 2:
import hmac, hashlib, re, time
from flask import Flask, request

API_KEY = "..."  # an API key with the webhook badge
app = Flask(__name__)

def is_valid(raw: bytes, header: str) -> bool:
    m = re.match(r"v=(\d+),d=(.*)", header or "")
    if not m:
        return False
    ts, digest = m.groups()
    if abs(time.time() * 1000 - int(ts)) > 5 * 60 * 1000:
        return False
    mac = hmac.new(API_KEY.encode(), raw + ts.encode(), hashlib.sha256)
    return hmac.compare_digest(mac.hexdigest(), digest)

@app.post("/retell")
def retell_webhook():
    raw = request.get_data()  # raw body, not re-serialized JSON
    if not is_valid(raw, request.headers.get("X-Retell-Signature")):
        return "", 401
    queue.put(raw)  # process after acknowledging
    return "", 204
An illustrative call_analyzed payload, trimmed to fields from the Get Call page. Values are made up:
{
  "event": "call_analyzed",
  "call": {
    "call_id": "call_example_123",
    "agent_id": "agent_example",
    "agent_version": 7,
    "call_type": "phone_call",
    "direction": "inbound",
    "disconnection_reason": "user_hangup",
    "duration_ms": 94000,
    "latency": { "e2e": { "p50": 820, "p90": 1900, "num": 12 } },
    "call_analysis": {
      "call_successful": false,
      "user_sentiment": "Negative",
      "custom_analysis_data": { "appointment_booked": false }
    }
  }
}
A simplified merge for step 4. Treat absent keys as missing, not zero:
def merge(evt):
    call = evt["call"]
    row = {"call_id": call["call_id"], "agent_version": call.get("agent_version")}
    if evt["event"] == "call_ended":
        row["reason"] = call.get("disconnection_reason")
        row["e2e_p90"] = (call.get("latency", {}).get("e2e") or {}).get("p90")
        row["cost_cents"] = (call.get("call_cost") or {}).get("combined_cost")
    if evt["event"] == "call_analyzed":
        a = call.get("call_analysis") or {}
        row["successful"] = a.get("call_successful")
        row["custom"] = a.get("custom_analysis_data")
    upsert("calls", key="call_id", row=row)
Derived fields to compute for step 5
| Finding | Derive it from | Caveat |
|---|---|---|
| Slow turn | latency.e2e.values, or llm, tts, asr | Fields can be absent |
| Caller cut the agent off | metadata.interrupted on agent utterances | Retell LLM and conversation flow agents only |
| Agent talked over the caller | Overlap of agent word start against the prior user word end | Word times are approximate |
| Repeated tool calls | Repeated tool_call_invocation names in transcript_with_tool_calls | Check one real payload first |
| Failed tool step | tool_call_result.successful | Optional field |
| Bad ending | disconnection_reason such as error_asr or inactivity | Group, do not page on single calls |
A worked example on pooling latency (illustrative numbers)
Per-call percentiles do not average cleanly. Take two illustrative calls with e2e.values in milliseconds. Call A: 700, 800, 900. Call B: 750, 2600, 2700, 2800. The per-call medians are 800 and 2,650. Their average is 1,725. The median of all seven turns pooled is 900. One number says the fleet is slow. The other says most turns are fine and one call is bad.
Store the values arrays, not only p50. Then you can pool by turn, by agent version or by day. How Retell computes its own dashboard aggregates is not stated in the pages I read, so do not assume they match your pooling.
Where a second system helps
A basic Retell AI observability pipeline gives you a call table. The next question is why calls fail, and which failures share a cause. That is the work in voice agent root cause analysis and in debugging a bad voice agent call. It needs spans. The OpenTelemetry trace and span model shows one shape. What to log on voice agent calls lists the fields.
Evalgent Observe, which is launching, ingests data in OpenTelemetry format and has an upload path for call details. It traces each failure to the step or handoff behind it. It clusters failures into root causes. Where the supplied data is blind, it says "undetermined" and shows the coverage gap. With Retell, Observe works today through OpenTelemetry and the upload path; native connectors are planned.
Evalgent Monitor, which is live, covers production calls. It flags PII leakage, tool-call failures, latency spikes and policy failures, with fix recommendations. Neither product sits in the media path. For how the three disciplines fit, see testing vs monitoring vs observability.
Privacy and retention checks before you store
Webhooks always carry unscrubbed data, so your endpoint receives personal data on arrival. Decide what you mask before you persist. Our PII leakage post covers where it hides. Set the data_storage_setting field deliberately. It limits what Retell keeps, not what your webhook receives. This is not legal advice.
Frequently asked questions
What does Retell AI observability include out of the box?
Retell documents call and session history, live monitoring, an analytics dashboard, alert rules, and webhooks plus Get Call and List Calls APIs. Calls carry transcripts, latency, disconnection reasons and post-call analysis. The docs index lists no OpenTelemetry export page as of November 19, 2026, so cross-system tracing is something you build.
Where do I find Retell AI call logs?
Open call history in the dashboard, then a call's detail panel for the transcript, tool calls, latency, Detail Logs and packet capture. Programmatically, the Get Call API returns the record, including public_log_url, a log of LLM WebSocket requests and per-turn latency. List Calls returns many calls but omits transcripts.
Which Retell webhooks should I subscribe to?
Start with the defaults: call_started, call_ended and call_analyzed. call_ended carries every call field except analysis, and call_analyzed adds it. Add transcript_updated only for live use, because it fires many times per call. Transfer events matter if you route calls to humans or other numbers.
How do I verify a Retell webhook signature?
Read the X-Retell-Signature header, parse the timestamp and digest, and reject timestamps more than five minutes old. Compute HMAC-SHA256 over the raw body plus timestamp using your API key, then compare in constant time. The SDK's verify helper does this for you. Never verify against re-serialized JSON.
What is Retell call analysis and when does it arrive?
Retell call analysis is post-call extraction: a summary, user sentiment, a success flag, a voicemail flag and your custom fields. It runs after the call ends, so call_ended has no analysis and call_analyzed follows. Custom fields may be empty for calls that never connected, so check each key.
Does Retell monitoring include alerts?
Yes, in the dashboard. Rules watch metrics such as success rate, negative sentiment rate, API errors, cost and custom function failures, by fixed value or change from the last cycle. Notifications go by email or webhook. A workspace is limited to 10 rules, and alerting is not in the public API.
Can I export Retell AI analytics to my own store?
The analytics dashboard has no API, so build the numbers from call records. Pull them with webhooks, List Calls and Get Call, then compute latency, success and cost in your own database. Store raw latency values, not only percentiles, so you can pool by turn, version or day.
Does Retell document OpenTelemetry or Langfuse export?
As of November 19, 2026, I found no page on either in Retell's documentation index. You can still produce spans yourself: turn each webhook event and its transcript timestamps into spans, and send them to any OpenTelemetry backend. Check the docs again before you build, in case that changes.
The bottom line
Retell AI observability gives you a solid per-call record: transcript with word timestamps, latency by component, a disconnection reason and post-call analysis. What it does not give you by itself is a cross-call view of causes, your own business outcomes and the carrier side, so push webhook data into a store you control and add those yourself.
Related Articles

How to automate voice agent testing: synthetic callers vs manual QA
Learn how ai test automation replaces manual QA for voice agents. Compare synthetic callers vs human testers, with a 5-step framework to scale without hiring.
Read more
AI Agent Testing vs Voice Agent Testing: What General Tools Miss for Voice
AI agent testing measures text outputs. Voice agent testing measures behaviour through an acoustic pipeline. Five failure categories general tools miss.
Read more