LLM Observability for Voice Agents: Time to First Token, Context Size and Finish Reasons
On this page
A caller says the agent "paused for ages, then cut off mid-sentence." Your dashboard shows a healthy average model latency and zero errors. Both can be true. The model call was fine on average, and the one that mattered hit a retry, a token limit or a stalled stream.
This post is the LLM observability voice agent view of the model layer, as of November 21, 2026. It lists what to capture per call, how to read it on a trace, and what each finish reason means for the caller. It does not rank models (see best LLM for voice agents) or price delay (see the cost of latency). For the attribute names across every span type, read voice agent span attributes. For where the OpenTelemetry names stand, read the GenAI conventions post.
What one LLM call needs to record
A cascaded voice agent sends one or more model requests per turn. A turn with a tool call sends at least two, because the second request turns the tool result into speech. Each request is one span. Each span in an LLM observability voice agent trace needs the fields below.
| Capture | Why it matters on a call | Source |
|---|---|---|
| Model requested and model that answered | A silent provider update changes behavior under a fixed label | gen_ai.request.model, gen_ai.response.model |
| Time to first token | Start of the model's share of the silence | Your timer, or gen_ai.response.time_to_first_chunk |
| Time to first sentence | When the TTS can start speaking | Your timer, from the text stream |
| Total generation time | Long answers keep the pipeline busy | Span duration |
| Input tokens, total | Context size for this turn | Provider usage field |
| Cached input tokens | Whether the prefix was reused | Provider usage field |
| Output tokens, and reasoning tokens if reported | Answer length, hidden work | Provider usage field |
| Finish reason | Why generation stopped | Provider field |
| Attempt count and retry delay | Time lost before the first token | Your client wrapper |
| Error class, HTTP status, request ID | Which failures, and how to find them at the provider | Provider error |
| Longest gap between stream chunks | Mid-answer stalls | Your timer |
Names differ by provider. The OpenTelemetry names in the table are from the client inference conventions, whose status line reads Development as of November 21, 2026. The provider fields below are provider-specific, and I name only providers whose docs I opened.
Token counts mean different things by provider
Record input tokens, but check what the field includes. Providers disagree.
- OpenAI Chat Completions: the example response in the API reference shows
prompt_tokens,completion_tokens,prompt_tokens_details.cached_tokensandcompletion_tokens_details.reasoning_tokens. - OpenAI Responses API: the prompt caching guide reports cached tokens in
input_tokens_details.cached_tokens. - Anthropic Messages API: the prompt caching docs say
input_tokenscounts only tokens after the last cache breakpoint. Total input iscache_read_input_tokens + cache_creation_input_tokens + input_tokens. - Google Gemini API: the generateContent reference lists
promptTokenCount, which "still includes the cached tokens," pluscachedContentTokenCount,candidatesTokenCountandthoughtsTokenCount. - OpenTelemetry:
gen_ai.usage.input_tokensis the input total, with cached tokens counted inside it. Cache reads go ingen_ai.usage.cache_read.input_tokens.
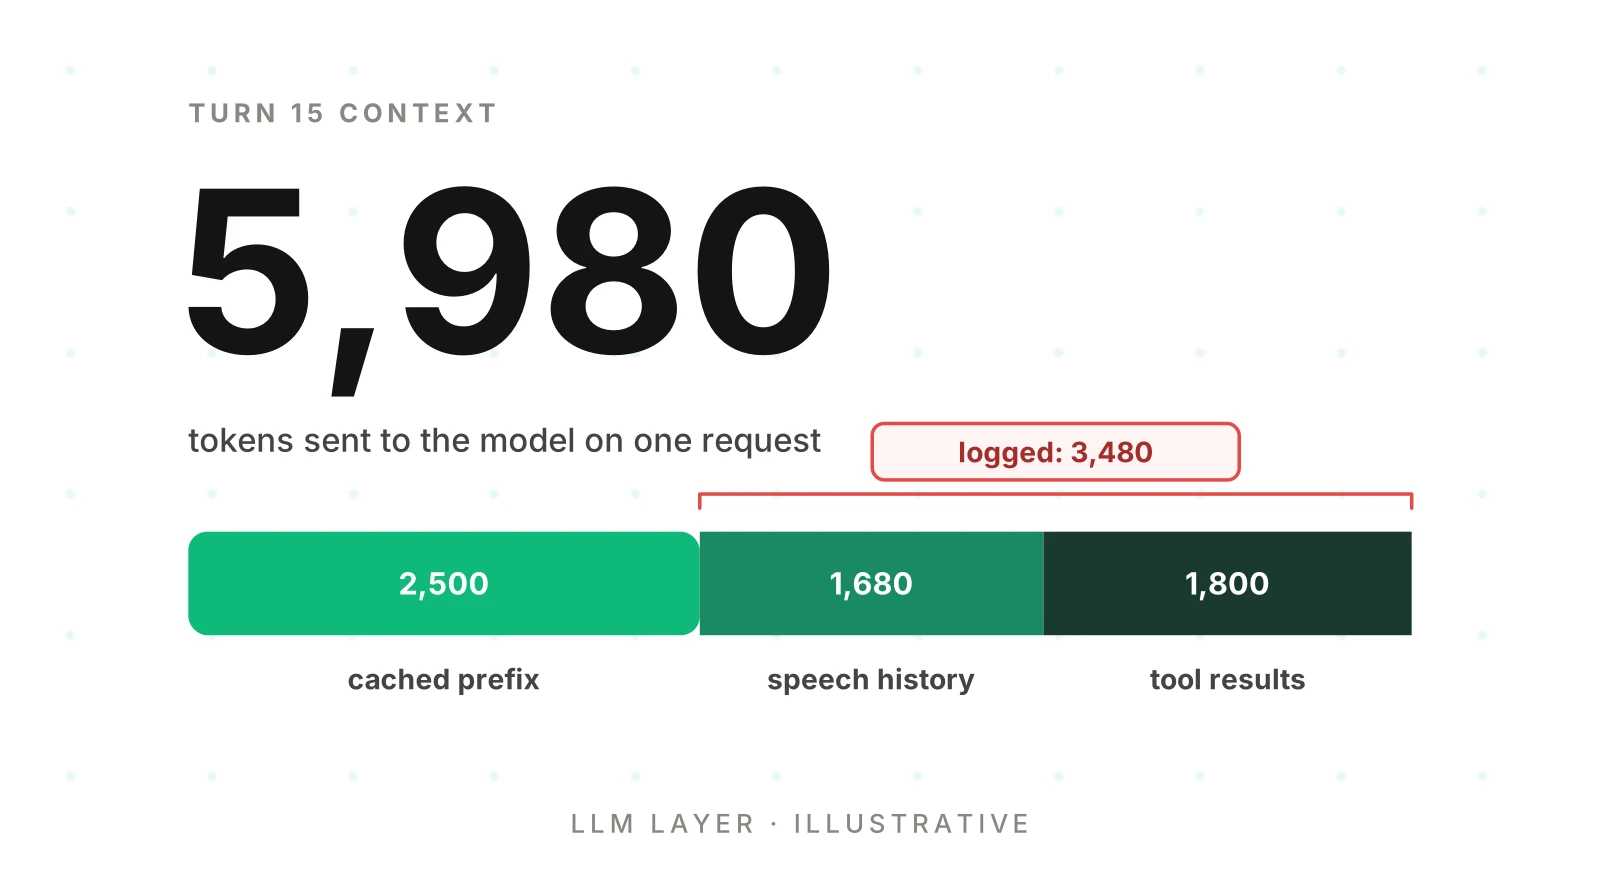
A worked example, with illustrative numbers. At turn 15 of a call, an Anthropic-style response reports cache_read_input_tokens 2,500, cache_creation_input_tokens 0 and input_tokens 3,480. The context is 2,500 + 0 + 3,480 = 5,980 tokens. If you plot input_tokens alone, you plot 3,480 and miss 2,500 tokens of prompt. If you map it straight to the OpenTelemetry total, the number is wrong the other way.
The fix is a normalization step in your client wrapper. Compute total input once, store it as the total, and store cached tokens separately. Anthropic's context window docs add that cached prefixes still count toward the window. Caching changes the bill and the speed, not the size.
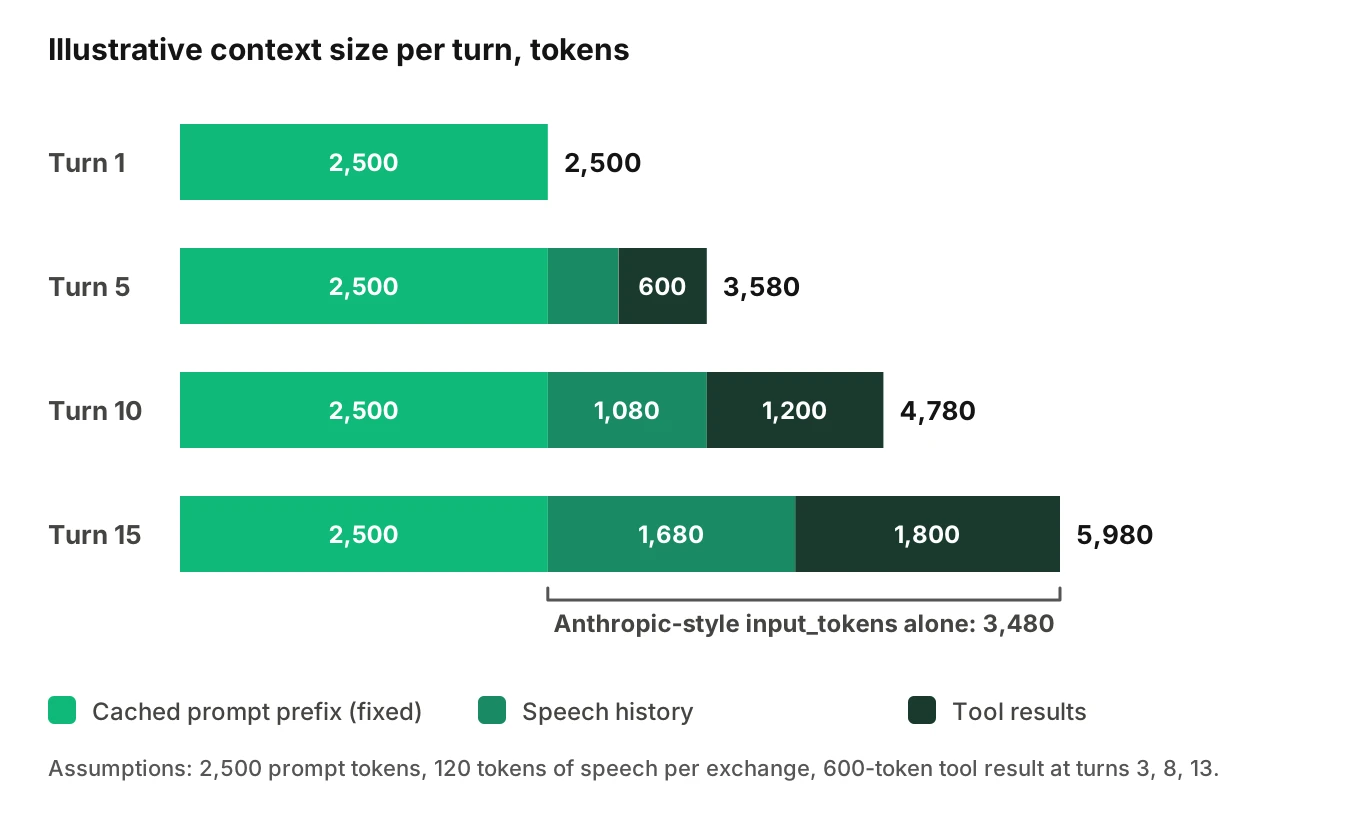
The diagram uses assumptions, not measurements: 2,500 fixed prompt tokens, 120 tokens of speech per exchange and a 600-token tool result at turns 3, 8 and 13. Tool results outgrew speech by turn 15. Causes and fixes are in voice agent long call context bloat. You only see bloat if every turn logs its total.
Time to first token, first sentence and chunk gaps
Time to first token voice agent teams track is not one number. Three timers answer three questions.
| Timer | Starts | Stops | Answers |
|---|---|---|---|
| Attempt TTFT | A request is sent | First token of that attempt | How fast is the provider right now? |
| Operation TTFT | The logical call begins | First token of the successful attempt | How long did this turn wait on the model? |
| First sentence | The logical call begins | First speakable sentence complete | When can speech start? |
The OpenTelemetry definition of gen_ai.response.time_to_first_chunk is the operation kind. It measures from the start of the logical inference operation, before authentication and the first attempt, and "SHOULD include authentication, failed attempts, and retry backoff." Check your instrumentation library against that. A library that times only the last attempt reports a healthy number for a turn that waited seconds.
Watch what counts as a chunk. The same page says a chunk is a decoded provider stream event with new, non-empty output, and it lists reasoning and tool-call names or arguments as output. So the first chunk may be a reasoning event or a tool-call name, not words a caller can hear. Record time to first text token as its own field, and time to first sentence from the text stream. The full silence a caller hears is in time to first audio.
Streaming chunk gaps
After the first chunk, the OpenTelemetry metric gen_ai.client.inference.time_per_output_chunk records the time from the end of the previous chunk to the end of the current one. For voice, the useful summary is the longest gap in each response. If your TTS waits for a full sentence, a stall in the middle of a sentence is silence in the middle of speech. A per-call maximum is cheap to log.
Reading a slow turn: model, tool or speech
A turn is slow when the caller waits. A trace says who they waited on. In LLM observability voice agent work, the idea is simple: lay every span of the turn on one timeline and label each as speech side, model or tool.
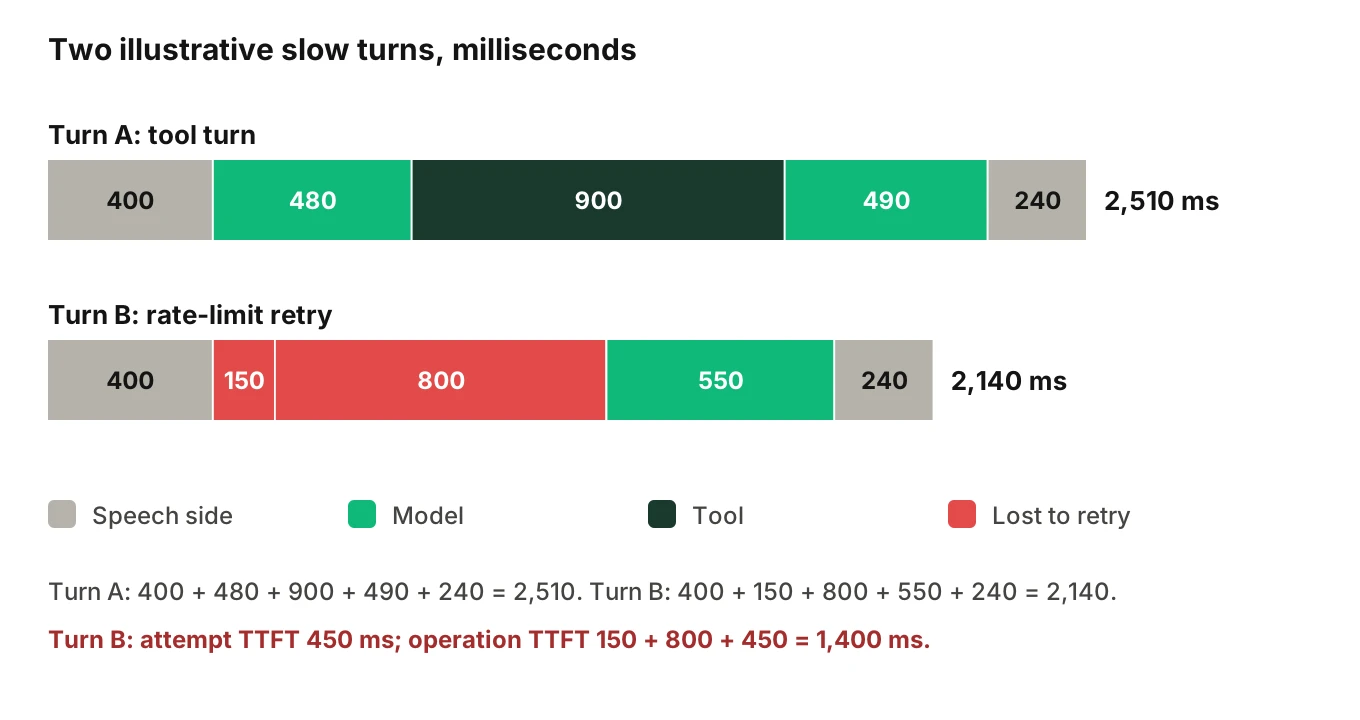
Both turns above are illustrative. Turn A is a tool turn. The caller finishes speaking, and the agent waits 400 ms to be sure. The first model request takes 480 ms to emit a tool call. The tool takes 900 ms. The second request needs 490 ms to produce a first sentence. The TTS adds 240 ms to first audio. The total is 400 + 480 + 900 + 490 + 240 = 2,510 ms.
Turn B has no tool. The first model attempt fails after 150 ms with a rate-limit response. The client waits 800 ms and retries. The second attempt takes 450 ms to a first token and 100 ms more to a first sentence, 550 ms in all. The total is 400 + 150 + 800 + 550 + 240 = 2,140 ms.
Both turns feel slow, yet the model was fast on its own. In turn A the largest block is the tool. In turn B it is a retry. Turn B also shows why the timers differ: attempt TTFT is 450 ms, but operation TTFT is 150 + 800 + 450 = 1,400 ms. A dashboard fed by attempt TTFT would show nothing wrong.
Three questions settle most slow turns:
- Did the model spend the time? Compare operation TTFT with attempt TTFT. A big gap means retries or backoff.
- Did a tool spend it? Look for a tool span between two model spans. See tracing tool calls.
- Was it on the speech side? Endpointing wait and TTS start sit outside the model. See turn-taking observability for those events.
Finish reasons and what the caller hears
A finish reason says why the model stopped generating. It does not say what was spoken. Still, each value has a likely effect on the call, and the values differ by provider as of November 21, 2026.
| Meaning | OpenAI Chat Completions | Anthropic Messages | Google Gemini | Likely effect on the call |
|---|---|---|---|---|
| Natural end | stop | end_turn | STOP | The reply was complete |
| Token limit | length | max_tokens | MAX_TOKENS | Speech can end mid-thought |
| Tool requested | tool_calls | tool_use | Not confirmed; see note | Silence until the tool returns |
| Filtered or declined | content_filter | refusal | SAFETY | Partial, empty or fallback speech |
| Truncated by context | Not listed | model_context_window_exceeded | Not listed | A cut-off reply |
Sources: the OpenAI chat reference, Anthropic's stop reason docs and the Gemini generateContent reference. Gemini's enum has many more values, such as RECITATION, BLOCKLIST, SPII and MALFORMED_FUNCTION_CALL. I did not confirm how Gemini reports a normal tool request, so the table leaves it out.
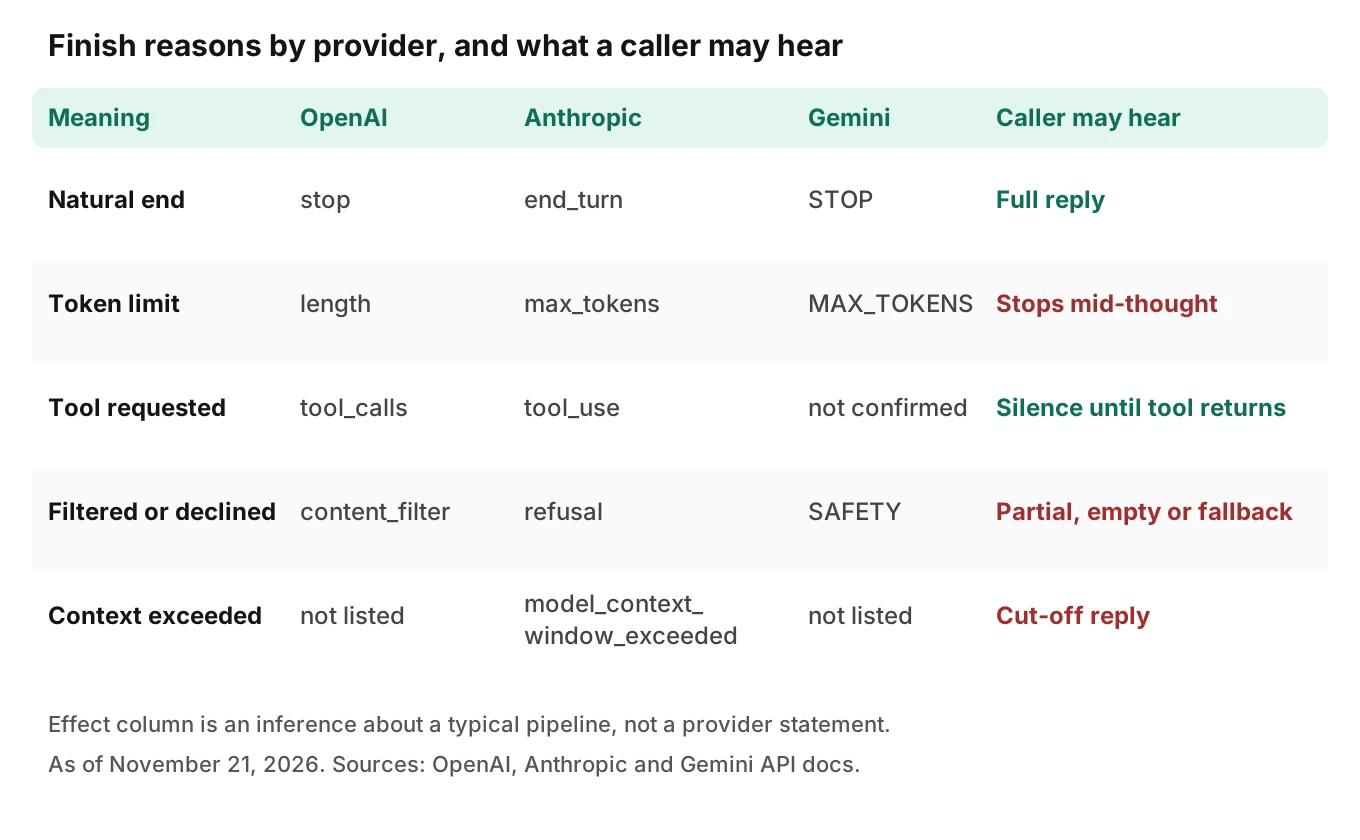
The last column is an inference about a typical pipeline, not a provider statement. Your TTS speaks whatever text arrived. If the stream ends at a limit, the caller hears a sentence that stops. If the model asked for a tool, no speech comes from that request, so the silence belongs to the tool and the second request.
Three details change how you read these values:
- Anthropic streaming: per the streaming docs,
stop_reasonisnullinmessage_startand arrives inmessage_delta. A stream cut before then has no finish reason at all. - Refusals are not errors: the stop reason docs say
refusalcomes back as a normal HTTP 200. An error-only alert will never see it. - Empty replies: Anthropic's docs describe an empty response of 2 to 3 tokens with
end_turn, usually after tool results. The finish reason looks normal. The caller hears nothing.
For the cancelled case, OpenTelemetry says that if a finish reason was expected but not received, for example because the stream ended early or generation was cancelled, instrumentation SHOULD report error for that position. For interrupted generations it says to report the provider's interruption reason, and interrupted otherwise. Record the cancel reason yourself, since a barge-in cancel is normal and a dropped connection is not.
A finish reason also rules causes out. A repeated question with stop every time points away from the model; see repetition loops and tool call accuracy.
Retries, errors and rate limits
Retries hide in the first-token number. Capture the attempt count, the delay before each retry, the error class and the request ID for every logical call.
The providers document what to read:
- OpenAI: the rate limits guide lists
Retry-Afterand headers such asx-ratelimit-remaining-tokensandx-ratelimit-reset-tokens. It distinguishes a 429rate_limit_errorfrom a 503server_is_overloaded. It says official SDKs retry 429 and 503, and that Retry-After handling varies by SDK version. - Anthropic: the errors page lists 429
rate_limit_errorand 529overloaded_error. Its SDK retries transient failures twice by default. Every response carries arequest-idheader.
Two traps follow. An SDK that retries quietly makes a turn slow with no error in your logs unless you count attempts. And Anthropic notes an error can arrive after a 200 response, as an error event in the stream, so store the in-stream error separately from the status.
What stays invisible
An LLM observability voice agent setup is precise about the model and silent about the call. Four blind spots matter.
- What the caller heard. Finish reason and text show what the model produced. Playback, buffering and cancellation sit in the TTS and transport layers.
- Where the time went inside TTFT. Network, provider queueing and prefill are one number from the client side. The span cannot split them.
- Hidden reasoning. Providers report reasoning or thought token counts, such as Gemini's
thoughtsTokenCount. You see the count, not the thinking. - Silent model changes. A provider can change behavior behind a label. The response model field helps, but it will not flag drift. See LLM update regressions and metric drift.
When a field is absent, the right verdict is "undetermined," not a guess. Quality questions, such as wrong facts, need scored samples, not spans; see hallucination rate. For what trace tools do and do not know about a phone call, see the tracing-tool view.
How to instrument the LLM layer of a voice agent in 6 steps
An LLM observability voice agent rollout fits in a wrapper around your model client. You do not need to change prompts or models.
1. Tag every request with identity - Set the call ID, turn index, agent version and prompt version on each LLM span at creation. Add requested model and, on completion, the model that answered.
2. Normalize usage once - Compute total input, cached input, output and reasoning tokens in the wrapper, per provider. Write the total to the standard field and the cached part to its own field. Keep a test for each provider.
3. Time three moments - Start one timer at the logical call, before any retry. Record time to first text token and time to first sentence. Record attempt TTFT separately.
4. Capture stop and error facts - Store the provider's finish reason verbatim. Add the cancel reason, final HTTP status, any in-stream error, attempt count and request ID.
5. Log the longest chunk gap - Track the gap between stream events and write the maximum when the response ends. Add the count of chunks.
6. Read one staged call back - Make a test call with a tool turn, a forced token limit and a simulated rate-limit response. Check that the trace shows each, and that the totals match the provider's usage.
A sketch of one span after step 4, with illustrative values:
// llm span, turn 7, tool turn, second request
gen_ai.request.model            "your-model-id"
gen_ai.response.model           "your-model-id-with-date"
gen_ai.usage.input_tokens       5980      // total, cached included
gen_ai.usage.cache_read.input_tokens  2500
gen_ai.usage.output_tokens      48
gen_ai.response.finish_reasons  ["stop"]
gen_ai.response.time_to_first_chunk   0.49  // seconds, operation level
voice.llm.first_sentence_ms     600       // your own field
voice.llm.attempts              1
voice.llm.max_chunk_gap_ms      140       // your own field
The gen_ai.* names are in Development status, so pin the version you target. The voice.* names are suggestions, as in the span attribute post.
Where Evalgent fits
Evalgent is a testing, evaluation and monitoring platform for voice agents. Its Observe product, which is launching, ingests OpenTelemetry-format data from any stack, so the LLM spans above can be read there. It traces a failed call to the step that caused it and clusters failures into root causes. Findings such as long latency and long agent turns come from traces and call data. Where the LLM fields are missing, it reports a coverage gap and "undetermined," not a verdict. It never sits in the media path.
Its Monitor product, which is live, flags production problems such as latency spikes and tool-call failures with fix recommendations. For testing, Evalgent can measure latency percentiles and call timestamps such as endpointing and first audio on test calls, and Reviews replay a test call with audio and transcript together and show exact tool payloads. You can book a demo to see how that works on your agent.
Frequently asked questions
What is LLM observability for a voice agent?
LLM observability voice agent work means recording each model call as a span: model and version, time to first token, token counts, finish reason, retries and errors. It explains a slow or cut-off turn after the call. It covers the model step only, so it needs speech and tool spans beside it.
What time to first token is acceptable for a voice agent?
No source I opened gives one target for every agent. Measure operation-level time to first token and first sentence on your own calls, and compare them with your total response delay. A model that is fast alone can still be slow after a retry or a tool call, so read p50 and p95 per turn type.
Which finish reasons matter most for a voice agent?
Token-limit stops matter most because speech can end mid-thought. Tool requests matter because silence follows. Filter and refusal values matter because replies may be partial or empty. In the provider docs I read, these are length, max_tokens and MAX_TOKENS for limits, and content_filter, refusal and SAFETY for filtering.
Why does input token count differ between providers?
Providers define it differently. Anthropic's input_tokens excludes cached reads and writes, which have their own fields. Gemini's promptTokenCount includes cached tokens. OpenTelemetry's input total includes cached tokens. Compute the total once in your wrapper, and keep cached tokens in a separate field.
How do I measure voice agent context size growth?
Log total input tokens on every LLM span with the turn index, then plot tokens by turn. Add tool result size if you can. Because the full history is sent on each request, the line should climb. A steep rise after tool turns points at raw tool output in history.
How do I tell if a slow turn was the LLM or a tool?
Put every span of the turn on one timeline. A tool span between two model spans is tool time. Compare operation-level and attempt-level first-token time to find retries. Endpointing and TTS start are speech-side time. The largest block is where to look first.
Should I trace LLM calls with OpenTelemetry?
Yes, if your backend reads it. The GenAI conventions define inference spans, token usage, finish reasons and time to first chunk, but their status is Development as of November 21, 2026. Pin the version, mark your own fields as custom, and keep content capture off by default.
Can LLM spans show what the caller heard?
No. They show what the model generated and when. What reached the caller depends on TTS, buffering, cancellation and the phone line. Without data from those layers, the right label is undetermined. Use speech and playback events alongside the LLM span.
The bottom line
LLM observability voice agent work succeeds when every model call records its versions, three timers, normalized token totals, the finish reason, retries and chunk gaps on one trace. Spans explain the model's share of a slow or cut-off turn, but not what the caller heard, so mark those gaps as undetermined.
Related Articles

How to automate voice agent testing: synthetic callers vs manual QA
Learn how ai test automation replaces manual QA for voice agents. Compare synthetic callers vs human testers, with a 5-step framework to scale without hiring.
Read more
AI Agent Testing vs Voice Agent Testing: What General Tools Miss for Voice
AI agent testing measures text outputs. Voice agent testing measures behaviour through an acoustic pipeline. Five failure categories general tools miss.
Read more