The Cost of Latency in Voice Agents: What Each 100 ms Does to Hang-Ups, Handle Time and Revenue
On this page
Every voice agent team gets the same question from finance or the founder: "Is it worth two sprints to cut 300 ms?" Most answers are a vendor blog stat with no source, or a shrug.
This post gives you a better answer in three parts. First, what peer-reviewed research shows about response delay, and where it stops. Second, a cost model where every assumption is labeled, worked through for three use cases at 100,000 calls a month. Third, the code and study design to replace those assumptions with your own numbers.
What "latency" means for this calculation
The latency that costs money is the gap the caller hears. It runs from when the caller stops talking to when they hear the agent's first syllable. Your framework's dashboard doesn't report that number.
LiveKit's `e2e_latency` uses two timestamps on the agent's clock, so it leaves out both network legs. Our LiveKit latency debugging guide breaks down which hops each metric covers. Pipecat's TTFB metrics are per service, so you have to add them up into a turn total; see measuring Pipecat latency. On a phone call, the gap the caller hears also includes the carrier legs and jitter buffers on both sides.
Three definitions used in the rest of this post:
- Turn gap (g): caller-perceived silence before the agent replies, per turn, in ms.
- p50 turn latency (m): median turn gap across a call's agent turns.
- Spread (σ): standard deviation of ln(g). Turn latency is right-skewed, and a lognormal fits it well enough for planning. The tail is set by σ, not by m.
Time to first audio on the greeting is a separate metric with separate causes. It's covered in time to first audio for voice agents. This post is about the gaps between turns, which repeat 8 to 15 times per call.
What the research proves, and where it stops
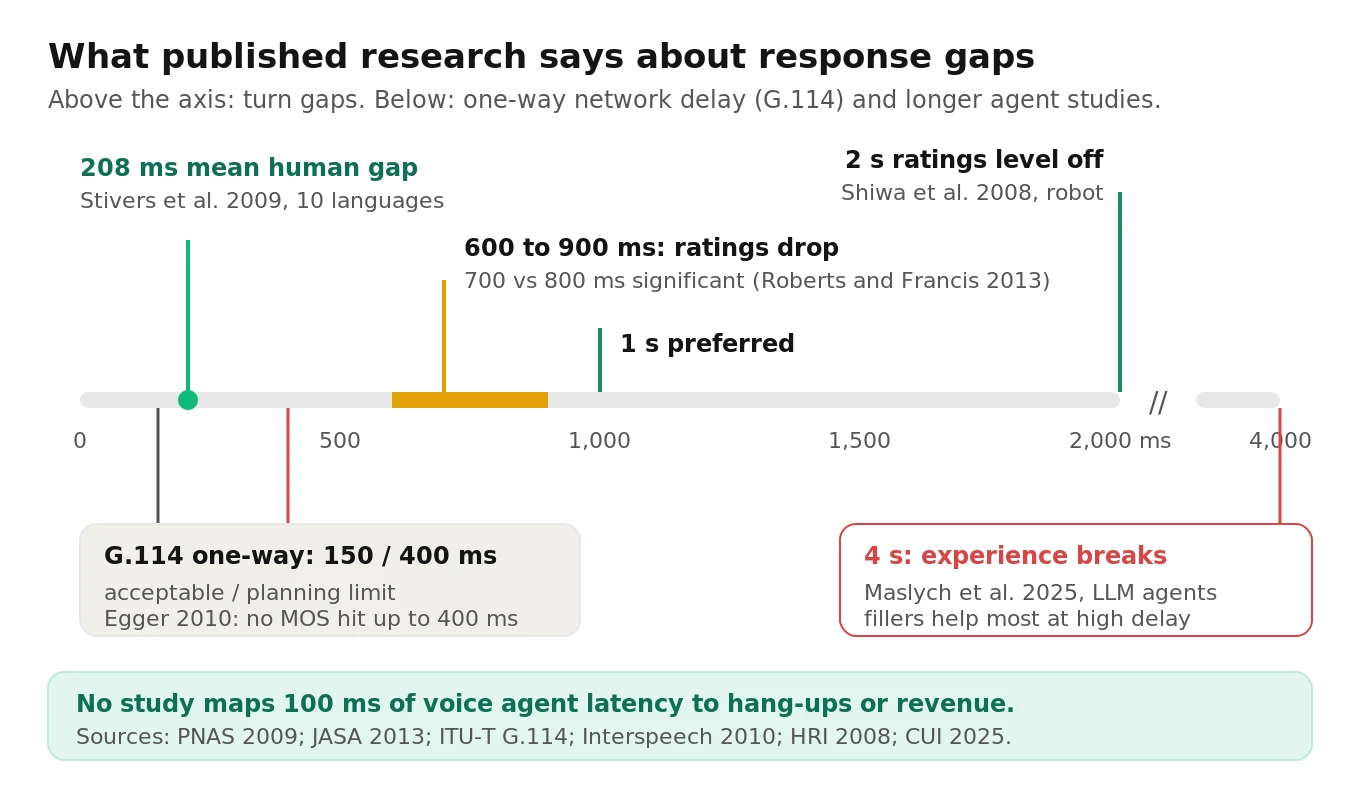
The table pulls the findings a builder can use. Each row lists the setup, because the setup decides how far the number carries over to your agent.
| Source | Setup | Finding | What it means for you |
|---|---|---|---|
| Stivers et al., PNAS 2009 | Question-answer pairs in natural conversation, 10 languages | Mean response offset +208 ms. Language means range from Japanese +7 ms to Danish +469 ms. English is +236 ms | Callers expect replies in about a quarter second. Every cascaded agent is slower than that, so you're managing a deficit, not meeting a norm |
| Roberts and Francis, JASA 2013 | 380 listeners rated recorded request-response pairs. Gaps from 200 to 1,200 ms in 100 ms steps, between-groups | Ratings of "willingness" dropped off at 600 ms. 700 vs 800 ms was a significant difference. Past 900 ms the curve flattened | A threshold band exists. 100 ms inside 600 to 900 ms matters much more than 100 ms at 300 ms or 1,500 ms |
| Egger, Schatz and Scherer, Interspeech 2010 | 34 people in 17 pairs on G.711 VoIP. One-way delay 100 to 1,600 ms across three tasks | Up to 400 ms one-way delay had no significant MOS effect, even on the most interactive task. Unintended interruptions were about 1 per minute at 100 ms and rose steadily up to 800 ms | Delay shows up as collisions before it shows up in quality ratings. Count overlaps, not just MOS |
| Kitawaki and Itoh, IEEE JSAC 1991, as summarized by Egger et al. | Delay detectability by task | Detection thresholds of 100 to 700 ms for trained subjects and 350 to 1,100 ms for untrained | Your engineers notice delay well before your callers do. Don't tune on internal gut feel |
| Shiwa et al., HRI 2008 | People rated a talking robot's system response time | Preference was highest at a 1 s response and leveled off by 2 s. A filler ("etto", like "well...") softened the hit from long delays | For a system people know is a machine, about 1 s is the comfort point and 2 s is the floor |
| ROMAN 2024, filler insertion in an ASR-LLM-TTS system | Subject experiments on a cascaded dialogue system | Fillers improved delay impressions by 1.1 points on a Likert scale. Parallel processing cut 0.6 s of delay | Perceived latency is partly a design choice. A short acknowledgment changes the score even when the gap stays the same |
| Maslych et al., CUI 2025 | LLM agents in VR at several latency levels, with and without fillers | Quality of experience degraded above 4 s. Fillers helped most at high delay | Beyond a few seconds, the conversation breaks |
| Tan et al., CHI 2026 | Text LLM chat with time to first token of 2, 9 or 20 s | Interaction behavior held steady across latencies. People who waited 2 s rated answers less thoughtful | That's text, not voice. Don't import "slower feels smarter" into phone calls, where silence reads as a dropped line |
The ITU-T G.114 recommendation adds the network side. It treats 0 to 150 ms one-way delay as acceptable for most uses, 150 to 400 ms as acceptable if you know the impact, and above 400 ms as unacceptable for network planning. Those are one-way transmission budgets for human-to-human calls. They are not targets for agent think-time, but the carrier legs come out of the same budget.
The number nobody has published
There is no peer-reviewed or primary-source study of the form "each 100 ms of voice agent turn latency changes hang-ups by X points or revenue by Y%." We looked. The figures that circulate ("abandonment spikes 40% past 1 second," "sub-800 ms agents complete 23% more tasks") don't link to a method, a dataset or a control group. Treat them as marketing.
The closest real 100 ms-to-revenue number comes from web search. Kohavi and colleagues report a controlled slowdown experiment at Bing. It slowed 10% of users by 100 ms and another 10% by 250 ms for two weeks. The result: 250 ms cost about 1.5% of revenue, every 100 ms of speedup was worth about 0.6%, and a linear approximation held well. The same paper repeats Amazon's "100 ms slowdown cost 1% of sales," citing a talk, not a paper.
Two lessons carry over. Latency effects are measurable with randomized delay injection, and that's the only design that settles causality. And the size of the effect is product-specific, so you can't borrow Bing's 0.6% for a scheduling line.
The other relevant result comes from queueing science. Brown et al. (JASA 2005).pdf) studied a bank call center over 3,867 hourly intervals. Percent abandoned was linear in average wait (R² = .875), and implied mean patience was 446 seconds. That's patience in a queue with hold music, where the caller expects to wait. It sets a useful lower bound, covered below.
How latency turns into cost: four mechanisms
A slower agent costs money through four separate paths. They behave differently, and most back-of-envelope estimates count only the first one.
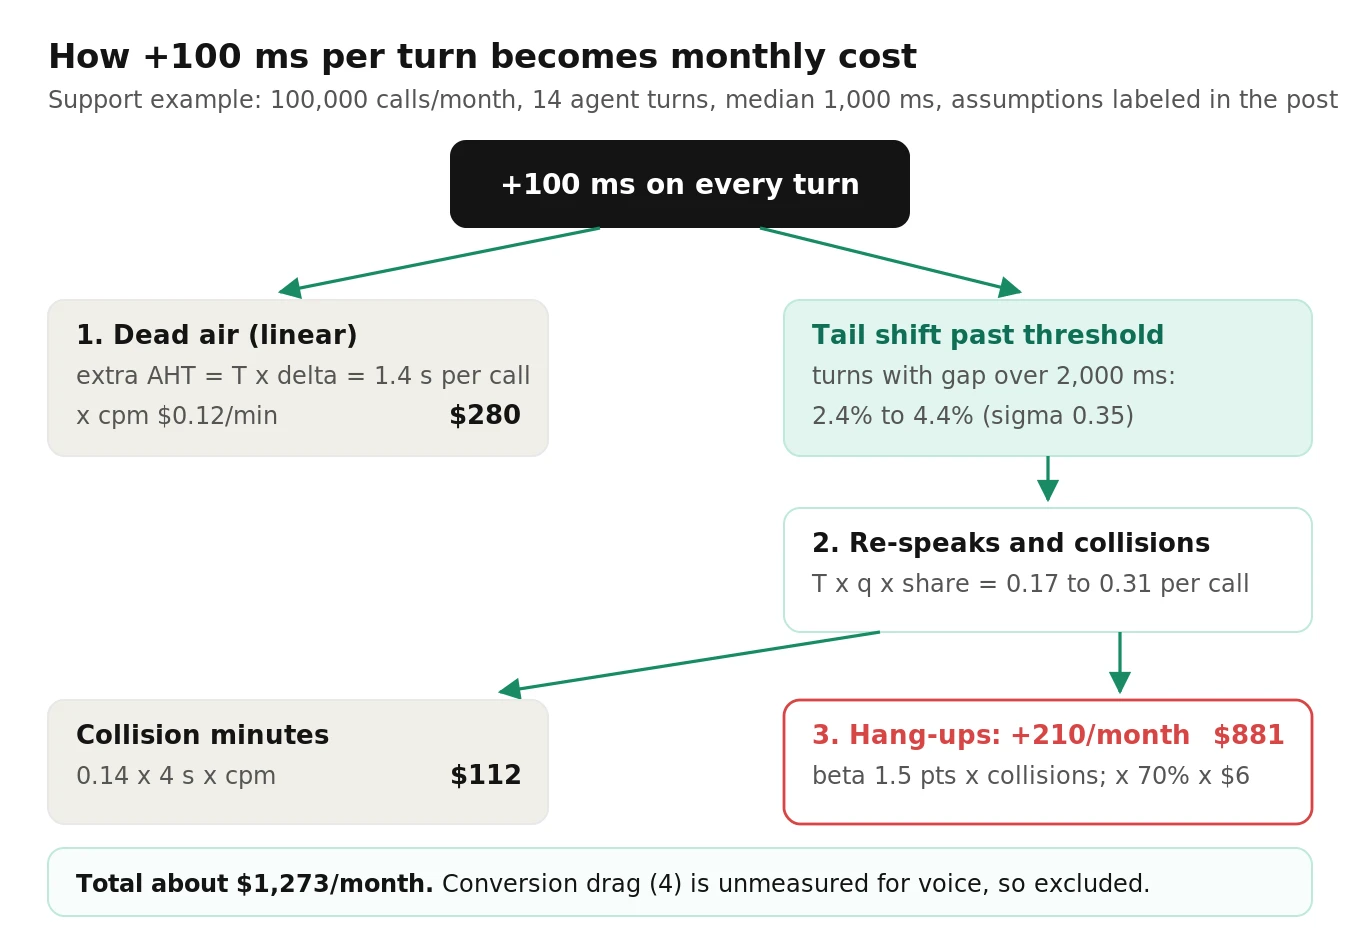
1. Dead air (linear). Each agent turn waits Δ longer. Extra handle time per call is turns × Δ. With 14 agent turns, +100 ms adds 1.4 seconds per call. At 100,000 calls and an all-in $0.12 per minute (an assumption; put in your own figure from your cost per resolution), that comes to $280 a month. It's real, and it's small.
2. Re-speaks and collisions (threshold). When a gap runs past the caller's patience, the caller fills it: "Hello?", "Are you there?", or a repeat of the request. That speech lands right as the agent's reply starts. In a LiveKit or Pipecat pipeline, the VAD fires and barge-in logic cancels the TTS. "Hello?" becomes a new user turn, and the LLM may now see two user messages. The usual result is an apology, a restart, and another full turn of latency. Egger's data shows the mechanism in human calls: unintended interruptions rose steadily with delay while quality ratings barely moved. Our interruption rate guide shows how to separate these from intentional barge-ins.
3. Hang-ups (threshold, compounding). Every collision and every long gap is a chance for the caller to give up. A hang-up loses the whole outcome of the call: the resolution, the booking, the qualified lead. That outcome is usually worth 50 to 500 times the call's per-minute cost, so this term dominates. Abandonment rate covers how to tell caller abandonment apart from normal completion.
4. Conversion among completed calls (soft). Callers who stay may trust a hesitant agent less, the way Roberts and Francis's listeners judged the late responder as less willing. This term matters for sales and qualification. No voice-specific study measures it.
A queue-theory cross-check
Here's an independent scale check using Brown et al.'s law. Abandonment ≈ E[wait] / E[patience]. If you treat all extra dead air as "waiting" and use the 446-second queue patience, +1.4 s per call raises hang-ups by about 0.3 points. The threshold model below lands at 0.2 points for the same case, so the two approaches agree on order of magnitude: tenths of a point per 100 ms, not whole points. Don't read the queue figure as a precise estimate. In-conversation silence isn't hold time: there's no music, no position-in-queue message, and Roberts and Francis show judgments shifting within a second. If a model of yours predicts whole points of hang-up per 100 ms at a 1 s median, recheck its assumptions.
The model, with every assumption labeled
The model works per turn and then adds up per call. You can build it in a spreadsheet.
share_over(m) = 1 - NORMSDIST( (ln θ - ln m) / σ )      # share of turns with gap > θ
collisions    = T × q × share_over(m)                      # re-speaks per call
AHT(m)        = base + T × m/1000 + collisions × c         # seconds
P_hang(m)     = h0 + β × collisions
Monthly cost of Δ = N × [AHT(m+Δ) - AHT(m)]/60 × cpm
+ N × [P_hang(m+Δ) - P_hang(m)] × p_success × value| Symbol | Meaning | Assumed value | Basis |
|---|---|---|---|
| θ | Patience threshold where callers start to re-speak | 2,000 ms caller-perceived | Assumption. Shiwa's ratings level off at 2 s, and Roberts and Francis see judgments shift from 700 ms. Measure yours |
| σ | Spread of ln(turn gap) | 0.35 (p95 ≈ 1.8 × p50) | Assumption. Tool calls and long LLM answers widen it |
| q | Chance a caller re-speaks once a gap passes θ | 0.5 | Assumption |
| c | Seconds lost per collision (overlap, apology, repeat) | 4 s | Assumption. Measure from recordings |
| β | Absolute hang-up increase per collision | 1.5 points | Assumption. The parameter with the most uncertainty |
| cpm | All-in cost per minute | $0.12 | Assumption. Use your own STT + LLM + TTS + telephony |
| N | Calls per month | 100,000 | Given |
There's a reason to use a threshold model instead of "x% per 100 ms." Your latency isn't one number. Moving the median by 100 ms shifts the whole lognormal and pushes a slice of the tail across θ. How big that slice is depends on where your median sits.
Worked example: 100,000 calls a month, three use cases
The use-case parameters are illustrative assumptions, not benchmarks. Median turn latency is 1,000 ms caller-perceived, and Δ = +100 ms.
| Inbound support | Appointment scheduling | Outbound lead qualification | |
|---|---|---|---|
| Agent turns per call (T) | 14 | 10 | 8 |
| Baseline handle time excluding gaps | 150 s | 100 s | 60 s |
| Baseline hang-up rate (h0) | 6% | 5% | 20% |
| P(success if call completes) | 70% resolved | 80% booked | 10% qualified |
| Value per success | $6 (human handling avoided) | $25 (booking contribution) | $60 (qualified lead) |
| Turns over θ: 1,000 → 1,100 ms | 2.4% → 4.4% | 2.4% → 4.4% | 2.4% → 4.4% |
| Collisions per call | 0.17 → 0.31 | 0.12 → 0.22 | 0.10 → 0.18 |
| Added handle time per call | +2.0 s | +1.4 s | +1.1 s |
| Extra hang-ups per month | +210 | +150 | +120 |
| Dead-air minute cost | $280 | $200 | $160 |
| Collision minute cost | $112 | $80 | $64 |
| Lost-outcome value | $881 | $2,997 | $719 |
| Monthly cost of +100 ms | $1,273 | $3,277 | $943 |
Read the table this way:
- The minute cost is the small part. Dead air plus collisions comes to $280 to $392 a month in every column. Teams that only price minutes conclude that latency is free.
- Lost outcomes are about 70 to 90% of the cost. Scheduling costs the most because each lost call takes a $25 booking with it at 80% odds.
- Lead qualification has a fourth term the table leaves out. Suppose you assume, with no voice evidence, that Bing's 0.6% per 100 ms applies to conversion among completed calls. The baseline value is 100,000 × 0.80 × 0.10 × $60 = $480,000 a month, so 0.6% adds about $2,900. That single borrowed assumption is three times everything else. That's why you should measure it rather than assume it.
- Annualized, +100 ms at a 1 s median costs this scheduling line about $39,000 a year. +300 ms costs about $165,000. That's a number you can weigh against a sprint, or against the price gap between a faster and a cheaper model (cost by use case covers the model side).
Sensitivity: where 100 ms is cheap and where it's expensive
Same model, support line, cost of +100 ms per month across median latency and patience threshold:
| Median turn latency | θ = 1,500 ms | θ = 2,000 ms | θ = 2,500 ms |
|---|---|---|---|
| 600 ms | $792 | $333 | $286 |
| 800 ms | $2,068 | $620 | $339 |
| 1,000 ms | $3,482 | $1,273 | $532 |
| 1,200 ms | $4,228 | $2,118 | $919 |
| 1,400 ms | $4,163 | $2,838 | $1,444 |
| 1,600 ms | $3,587 | $3,228 | $1,976 |
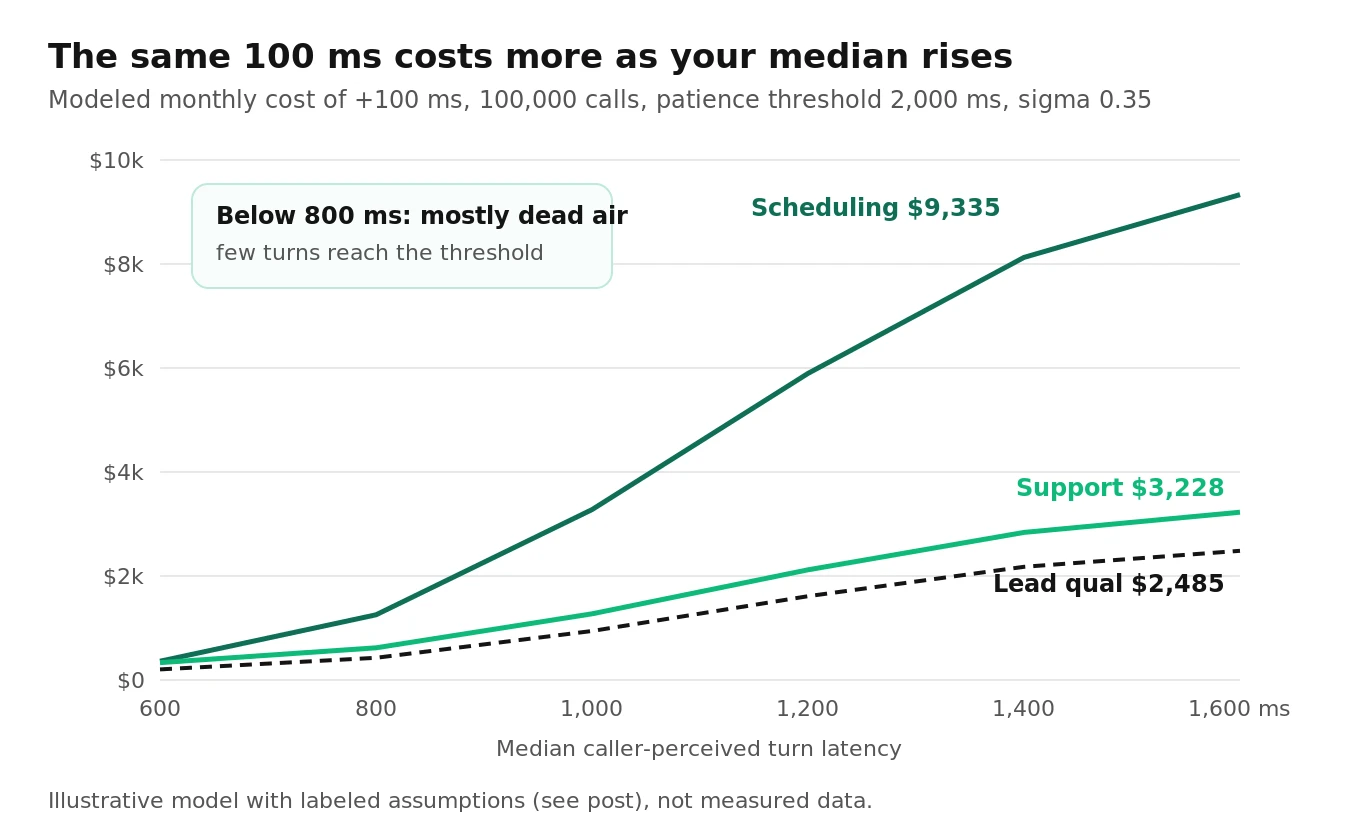
And across all three use cases at θ = 2,000 ms:
| Median turn latency | Support | Scheduling | Lead qualification |
|---|---|---|---|
| 600 ms | $333 | $363 | $202 |
| 800 ms | $620 | $1,253 | $428 |
| 1,000 ms | $1,273 | $3,277 | $943 |
| 1,200 ms | $2,118 | $5,895 | $1,610 |
| 1,400 ms | $2,838 | $8,126 | $2,178 |
| 1,600 ms | $3,228 | $9,335 | $2,485 |
What the tables show:
- The same 100 ms costs 5 to 22 times more at a 1.4 s median than at 600 ms. Below about 800 ms, almost no turns reach θ, and you only pay for dead air. If you're already at 600 ms, the next 100 ms is a weak investment. At 1.2 s, it's one of the best you have.
- When θ is near your median, the curve peaks and then falls. In the θ = 1,500 ms column, cost tops out around 1,200 to 1,400 ms. Once most turns are already over θ, each extra 100 ms crosses fewer new ones. A slow agent doesn't recover on its own, though. It's already paying the full collision cost on most turns.
- σ matters as much as m. At a 1,000 ms median, σ = 0.25 gives $559 and σ = 0.5 gives $1,924. Cutting the tail with tool-call fillers, shorter first sentences and region pinning can be worth more than shaving the median. Our stack guide lists where tail latency comes from in each layer.
- β moves the result in direct proportion. 0.5, 1.5 and 3 points per collision give $686, $1,273 and $2,154 for support. β is the parameter to measure first.
How to measure your own latency-outcome curve
The model is only as good as θ, β and the conversion term. These steps replace them with data from your own calls. Steps 1 to 3 build the data, steps 4 to 6 estimate the curve, and step 7 is the causal test.
1. Record two channels. You need the caller and the agent on separate tracks. Twilio now stores call recordings dual-channel by default. With a LiveKit or Pipecat SIP path, record each participant's track separately. Check which channel is which on a known call before you trust any output. The recording point isn't the caller's ear: add a fixed offset for the access legs you can't see.
2. Extract caller-perceived turn gaps and collisions. Run VAD on each channel and compute gaps from the caller's speech offset to the agent's speech onset. Here's a simplified version using py-webrtcvad, which takes 16-bit mono PCM at 8, 16, 32 or 48 kHz in 10, 20 or 30 ms frames:
# turn_gaps.py  (simplified, illustrative)
import numpy as np, soundfile as sf, webrtcvad

FRAME_MS = 20

def speech_segments(x, sr, mode=3, min_speech_ms=200, merge_gap_ms=300):
    vad = webrtcvad.Vad(mode)
    n = sr * FRAME_MS // 1000
    pcm = (np.clip(x, -1, 1) * 32767).astype("<i2")
    flags = [vad.is_speech(pcm[i:i + n].tobytes(), sr)
             for i in range(0, len(pcm) - n + 1, n)]
    segs, start = [], None
    for i, f in enumerate(flags + [False]):
        t = i * FRAME_MS
        if f and start is None:
            start = t
        elif not f and start is not None:
            segs.append([start, t]); start = None
    merged = []
    for s, e in segs:                       # merge short pauses inside one utterance
        if merged and s - merged[-1][1] < merge_gap_ms:
            merged[-1][1] = e
        else:
            merged.append([s, e])
    return [(s, e) for s, e in merged if e - s >= min_speech_ms]

def turn_events(path, caller_ch=0, agent_ch=1, respeak_ms=700):
    audio, sr = sf.read(path)               # shape (frames, 2), sr 8000 for phone audio
    caller = speech_segments(audio[:, caller_ch], sr)
    agent = speech_segments(audio[:, agent_ch], sr)
    gaps, respeaks = [], 0
    for _, c_end in caller:
        nxt = next((a for a in agent if a[0] >= c_end), None)
        if nxt is None:
            continue
        between = [c for c in caller if c_end < c[0] < nxt[0]]
        if between:                          # caller spoke again before the agent replied
            if between[0][0] - c_end >= respeak_ms:
                respeaks += 1
            continue
        gaps.append(nxt[0] - c_end)
    overlaps = sum(1 for a in agent for c in caller
                   if c[0] < a[0] + 500 and c[1] > a[0])  # caller talking as agent starts
    return {"gaps_ms": gaps, "respeaks": respeaks, "overlaps": overlaps}
Raise `min_speech_ms` on noisy lines, because caller-side VAD flags background noise. Don't drop calls with re-speaks. Those are the turns you're trying to price.
3. Build one row per call. Columns: `call_id`, `call_type` (intent or flow), `hour`, `day`, `new_caller`, `early_p50_ms`, `early_turns`, `reached_k`, `hung_up_after_k`, `success`, `aht_s`, `respeaks`, `overlaps`.
4. Measure exposure early to avoid survivorship bias. If you compute p50 over the whole call, calls that hang up at turn 3 get a p50 from three turns, while successful calls get one from fifteen. Compute `early_p50_ms` from agent turns 1 to k (k = 3 or 4). Then model only outcomes after turn k, among calls that reached it. Leave the greeting out; it has its own causes. Also exclude turns that wait on a tool call, or flag them separately. Slow tools come with complex calls, and complex calls hang up more anyway. That's confounding, not a latency effect.
5. Bucket and plot within call type. Group `early_p50_ms` into 100 ms bins and plot hang-up rate per bin, one line per `call_type`. A flat line followed by a knee tells you where θ is. Bins with fewer than about 300 calls are noise.
6. Fit the curve with controls. The regression sketch below uses a hinge term, so you can test for a knee without spline extrapolation problems:
# latency_curve.py  (illustrative)
import numpy as np, pandas as pd
import statsmodels.formula.api as smf

df = pd.read_parquet("calls.parquet").query("reached_k")
KNEE = 1000  # try 800, 1000, 1200 and compare AIC

formula = ("hung_up_after_k ~ early_p50_ms + I(np.maximum(early_p50_ms - %d, 0))"
           " + C(call_type) + C(hour) + new_caller" % KNEE)
m = smf.logit(formula, data=df).fit(cov_type="cluster",
                                    cov_kwds={"groups": df["day"].astype("category").cat.codes})
print(m.summary())

# average effect of +100 ms on hang-up probability, across your real call mix
shifted = df.assign(early_p50_ms=df.early_p50_ms + 100)
delta = m.predict(shifted).mean() - m.predict(df).mean()
print(f"+100 ms -> {delta*100:.2f} pt hang-up rate")

# handle time: log-linear, same controls
aht = smf.ols("np.log(aht_s) ~ early_p50_ms + C(call_type) + C(hour)", data=df).fit()
print(f"+100 ms -> {(np.exp(aht.params['early_p50_ms']*100)-1)*100:.2f}% AHT")
Put the per-100 ms hang-up delta in place of β × Δcollisions in the model, and refit a small regression of `respeaks` on `early_p50_ms` to estimate θ and q. Treat the result as an association. Load-dependent slowness can track time of day and caller mix in ways that `hour` doesn't fully absorb.
7. Confirm with a delay-injection experiment. The clean causal estimate comes from Bing's method. Randomly assign a small share of calls to +0, +100 or +200 ms of added delay before the agent's audio, then compare outcomes. Size it first. To detect a hang-up change from 6.0% to 6.5% at 80% power and α = 0.05 takes about 36,800 calls per arm. A 1-point change (6% to 7%) needs about 9,500 per arm. At 100,000 calls a month, a 10% treatment arm detects only large effects within a month, so test +200 ms and scale the result down. Our A/B testing guide covers the rest of the math. Only inject delay on low-stakes flows, and stop early if a guardrail metric breaks.
Once you have this curve, latency stops being a feeling and becomes a line item. You can also track it as a leading metric: `share_over(θ)` moves the day a release ships, while hang-up and conversion data take weeks to settle.
Testing the curve before release
Production measurement tells you what latency cost last month. A release gate tells you before callers pay for it. The pre-release version uses the same quantities. Run a fixed scenario set over a real phone path, record caller-perceived gaps per turn, and check three numbers against your thresholds: p50, `share_over(θ)`, and re-speaks per 100 calls with a scripted impatient caller who says "hello?" after 1.5 s of silence. A release that keeps p50 flat but doubles the share over θ, usually from a slower tool or a longer first sentence, is the one that costs money.
This is where an independent evaluator helps. Evalgent places calls through the carrier path, so measured gaps include the legs your framework metrics leave out. It scores turn gaps, collisions and outcomes per scenario, and compares releases or vendors on the same script. If you're weighing a faster model against a cheaper one, run both through the same test set and put the measured tail shift into the model above. Fillers and backchannels change perceived latency without changing the gap, so test them as their own variant (backchanneling and proactivity).
Frequently asked questions
How much does 100 ms of voice agent latency cost?
No published study answers this for voice agents. A labeled model at 100,000 calls a month and a 1 s median turn gap puts it at roughly $900 to $3,300 a month, depending on use case. Most of that is lost outcomes, not minutes. At a 600 ms median, the same 100 ms costs a few hundred dollars.
What latency is acceptable for a phone voice agent?
Research points to a band, not a single line. Human gaps average about 200 ms. Listener judgments shift between 600 and 900 ms. Robot studies find preference highest near 1 s and leveling off by 2 s. Aim to keep caller-perceived p50 under about 800 ms and keep p95 under the threshold where your callers start saying "hello?"
Does voice bot latency increase hang-ups?
Lab studies show that delay worsens impressions and causes more unintended interruptions. No peer-reviewed field study yet links voice agent latency directly to hang-up rate. The likely path is gaps past the caller's patience, then re-speaks and collisions, then hang-ups. You can measure that chain in your own recordings with the method above.
Is the Bing "100 ms = 0.6% revenue" figure valid for voice?
No. It came from a randomized slowdown experiment on web search pages. It's a strong source for web search and shows that latency effects can be measured and close to linear in that setting. Voice calls have threshold effects and a different cost structure. Use it as a method to copy, not a number to borrow.
Why does my dashboard latency look fine when callers complain?
Framework metrics usually leave out the carrier legs, jitter buffers and playout. They also drop turns where the caller interrupted or gave up, which are often the slowest turns. Averages that include zeros or sentinel values look better when things break. Measure gaps from two-channel recordings and track the tail, not just the mean.
Should I cut median latency or tail latency first?
Usually the tail. In the model, raising σ from 0.25 to 0.5 at a fixed 1 s median more than triples the cost of each 100 ms. Tail turns come from tool calls, long first sentences, cold starts and cross-region hops. Fixing those cuts the share of turns over the patience threshold more than shaving the median does.
How many calls do I need to measure latency's effect on hang-ups?
For a randomized test at 80% power and 5% significance, detecting a move from 6.0% to 6.5% hang-ups takes about 36,800 calls per arm. A 1-point move takes about 9,500 per arm. Observational analysis needs fewer calls but only gives you an association. Bucket by early-turn latency and control for call type.
Do filler phrases fix latency costs?
Partly. One study of a cascaded ASR-LLM-TTS system found fillers improved delay impressions by 1.1 Likert points. Another found fillers helped most at long delays. A filler doesn't shorten the gap, and an overused one becomes its own annoyance. A/B test fillers as a separate variant and measure re-speaks, not just ratings.
The bottom line
The direct minute cost of 100 ms is small, but 100 ms that pushes turns past your callers' patience threshold costs several times more in hang-ups and lost outcomes, and far more at a slow median than a fast one. Measure caller-perceived gaps from two-channel recordings, fit your own latency-outcome curve, and price latency work against that curve, not a borrowed statistic.
Related Articles
How to automate voice agent testing: synthetic callers vs manual QA
Learn how ai test automation replaces manual QA for voice agents. Compare synthetic callers vs human testers, with a 5-step framework to scale without hiring.
Read more
AI Agent Testing vs Voice Agent Testing: What General Tools Miss for Voice
AI agent testing measures text outputs. Voice agent testing measures behaviour through an acoustic pipeline. Five failure categories general tools miss.
Read more