Tracing Tool Calls in Voice Agents: Latency, Retries and Silent Failures
On this page
A caller asks to move an appointment to Thursday. The agent says nothing for five seconds. Then it says, "You're all set."
The trace has a long bar in the middle. Every span has a clean status. Nothing in it says the booking never happened.
This post is the tracing view of that failure. It covers what to capture on a tool span, how to read retries and silent failures, and how the caller feels tool call latency. Good voice agent tool call tracing makes the call above explainable in a minute. The worked examples are illustrative.
We do not repeat neighbouring posts. For the assertions that catch a false "done", see detecting silent tool failures. For choosing the right tool, see tool call accuracy, and for the right values, tool argument accuracy. For duplicates after a barge-in, see interrupted tool calls. Here we ask one question: what should the trace show?
What the caller hears while a tool runs
The caller does not hear spans. They hear silence, then a voice.
The wait runs from the end of their speech to the first agent audio. A tool call sits in the middle of it. But the tool is not the whole wait. Before it, the model must decide to call the tool. After it, the model must run again with the result, and speech synthesis must start.
Here is an illustrative turn. The numbers are assumptions, not measurements.
| Step | Starts (s) | Length (s) |
|---|---|---|
| Endpointing wait | 0.00 | 0.30 |
| Speech-to-text final | 0.30 | 0.25 |
| Model decides to call the tool | 0.55 | 0.60 |
| Tool call, including retry | 1.15 | 3.40 |
| Model reads the result, first token | 4.55 | 0.55 |
| Speech synthesis, first audio | 5.10 | 0.35 |
The caller waits 5.45 seconds. The tool span is 3.40 of them. The other 2.05 seconds are real too, and they sit outside the tool span.
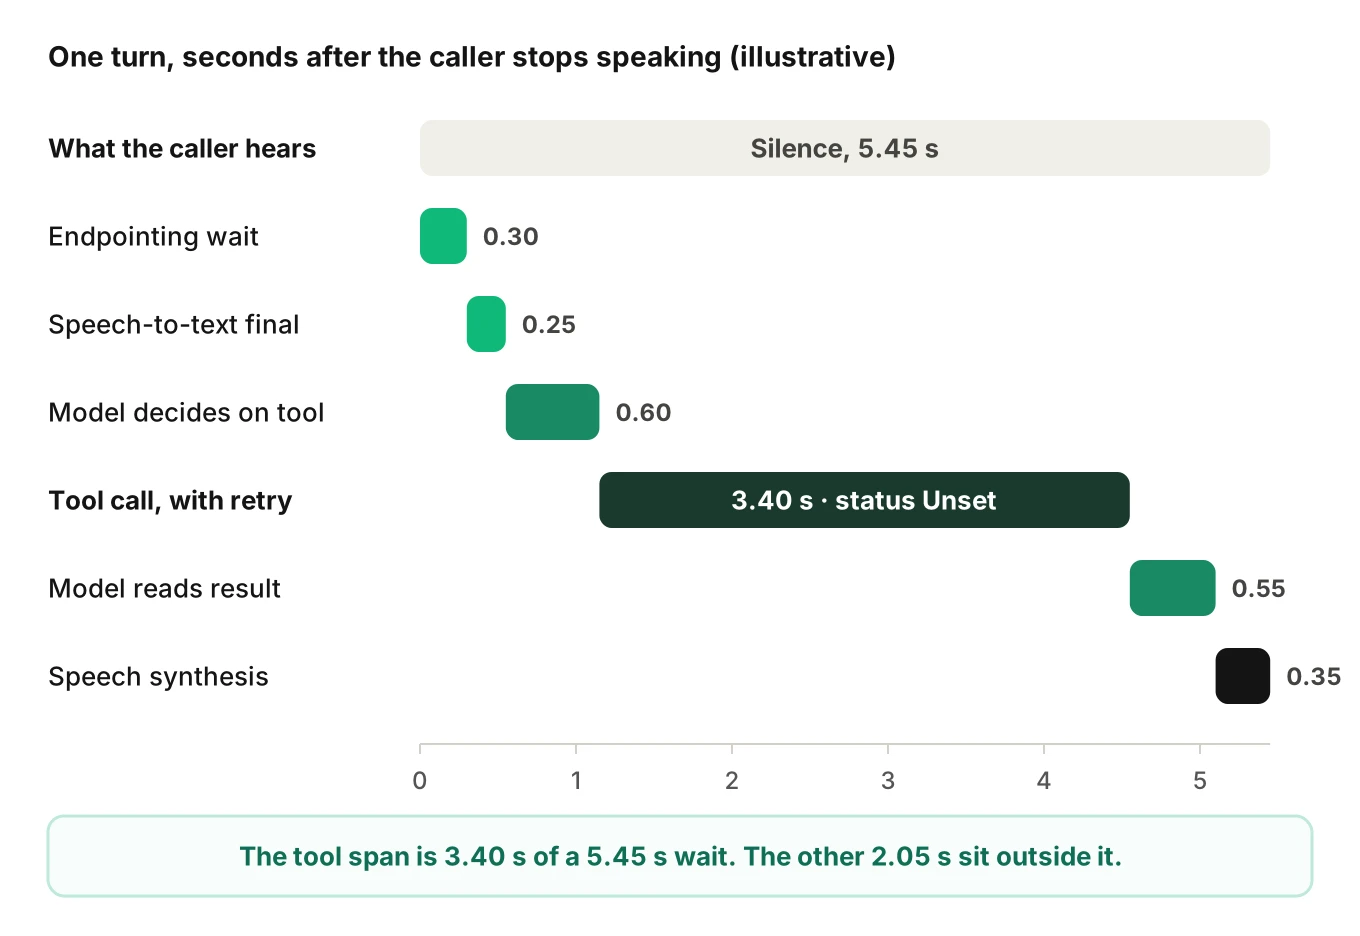
Two lessons follow. First, a tool span's duration understates what the caller feels. Judge the turn by the gap from speech end to first audio. Our post on what to measure for voice agent latency defines that clock, and time to first audio breaks it down.
Second, a slow tool can add a second slow step. The model call after the tool is not free. Trace it as its own span, linked to the tool it read.
Why successful tool spans still hide failures
The OpenTelemetry recording errors guidance says span status must be left unset if the operation ended without errors. It says to set Error when the operation fails. It also says a call that "returns an error in another way, for example, via an error code" counts as failed.
That rule is correct, and it leaves a gap. A tool that returns HTTP 200 with an empty list raised nothing. Its span looks successful. So does a call that returned stale data, or a result the model ignored.
The trace API specification adds that Ok is for operations an application developer or operator has validated, and instrumentation libraries generally should not set it. Unset does not mean "worked." It means "no error was recorded."
So span status alone cannot find silent failures. You need fields that say what came back and what happened next.
What the GenAI semantic conventions define for tool spans
As of November 19, 2026, these conventions live in the semantic-conventions-genai repository. The execute tool page is marked Status: Development. Names can still change, so pin the version you target.
The page says the span name should be execute_tool {gen_ai.tool.name}. The span kind should be INTERNAL. It encourages developers to follow it for tools their own code invokes, which covers most voice agents. Call it the execute_tool span.
| Attribute | Requirement level | What it holds |
|---|---|---|
gen_ai.operation.name | Required | execute_tool |
gen_ai.tool.name | Required | The tool's name |
error.type | Conditionally required, if it ended in error | A low-cardinality error class |
gen_ai.conversation.id | Conditionally required, if available | The conversation or session |
gen_ai.tool.call.id | Conditionally required, if the model supplied one | The model's identifier for this call |
gen_ai.tool.type | Recommended | For example function or extension |
gen_ai.tool.call.arguments | Opt-In | Parameters passed to the tool |
gen_ai.tool.call.result | Opt-In | The result, if execution succeeded |
The page warns that arguments and results may contain sensitive information, so they are Opt-In.
It also defines an event, gen_ai.execute_tool.exception, and a metric, gen_ai.execute_tool.duration. The metric is a histogram in seconds. It should equal the span duration when both are reported. The page suggests bucket boundaries from 0.01 to 81.92 seconds.
What the page does not define matters just as much. We found no attribute for retry count, result size, an arguments summary, or whether the model used the result. Those are yours to name. Use one prefix of your own, as in our post on voice agent span attributes. We use voice.tool.* below. Those names are suggestions, not a standard.
What to capture on a tool-call span
A tool span has one job. A reviewer should see what the agent asked for, what came back and what the model did with it, without opening a transcript.
Standard names are used where they exist. The voice.tool.* names are our suggestion.
| Field | Name | Answers |
|---|---|---|
| Name | gen_ai.tool.name | Which tool? |
| Call ID | gen_ai.tool.call.id | Which request from the model? |
| Status | span status, error.type | Did it fail, and in which class? |
| Outcome | voice.tool.outcome | success, error, timeout, empty, cancelled |
| Attempts | voice.tool.attempts | How many tries for this one call? |
| Wall time | span duration | How long did the whole call take? |
| Backoff time | voice.tool.backoff_ms | How much of it was waiting between tries? |
| Arguments summary | voice.tool.args_summary | Which keys, which normalised shape? |
| Result summary | voice.tool.result_summary | Type, item count, size, empty or not |
| Result used | voice.tool.result_used | yes, no or undetermined |
Take the less obvious ones in turn.
The latency split
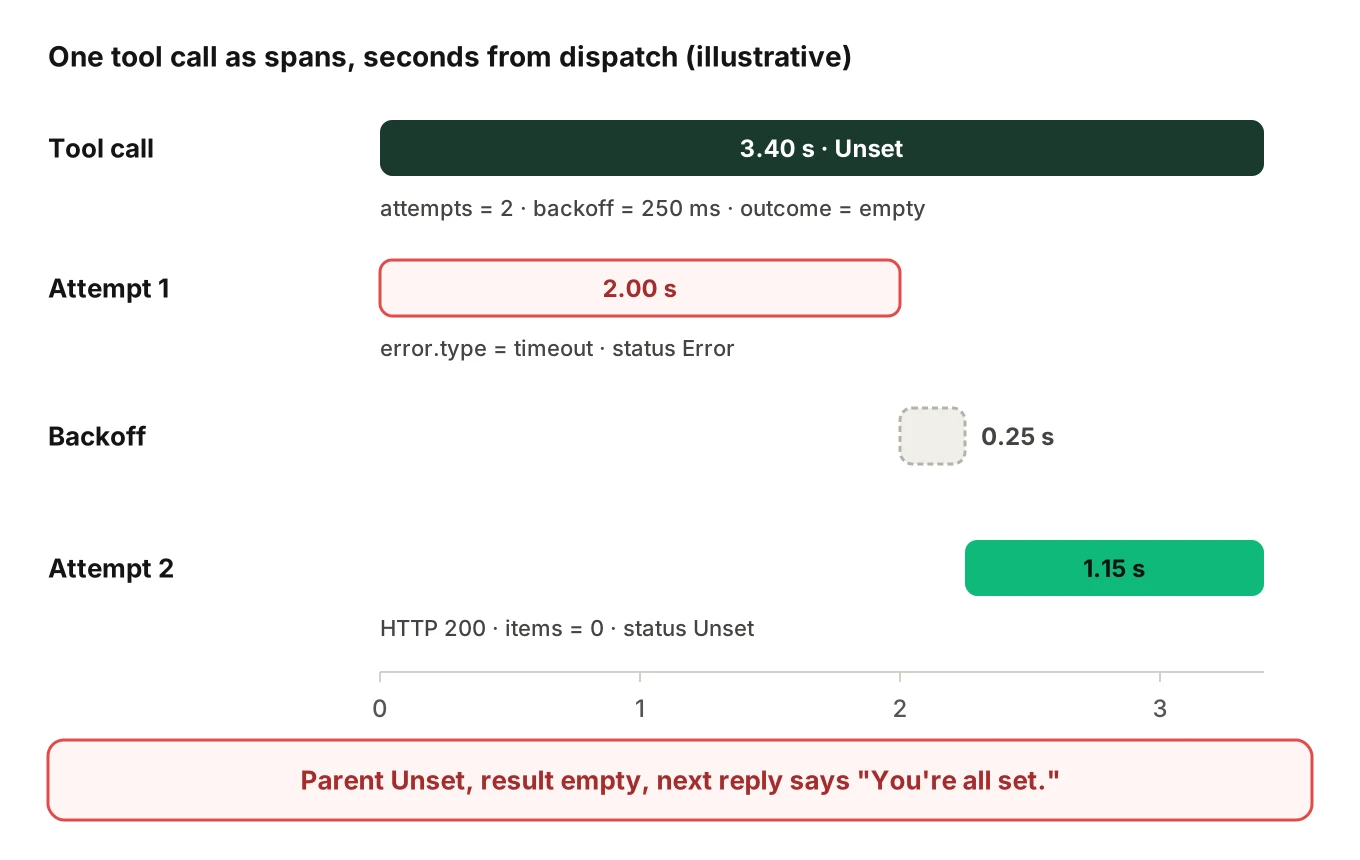
One duration is not enough. A tool call with a retry has several parts: each attempt, and the wait between them. Put each attempt on its own attempt span, a child of the tool span, and record the backoff as a number on the parent. Then "3.40 seconds" separates into "two attempts and a quarter-second pause."
If your backend returns its own processing time, record it as a separate field. The client wait minus the server time is what the network and queueing added. If the backend does not return it, leave it out. Do not guess.
Never drop failed calls from latency. Google's SRE book makes the point in its monitoring chapter. It says to distinguish the latency of successful and failed requests. A fast 500 can drag a number down. It adds that "a slow error is even worse than a fast error," so you should track error latency instead of filtering errors out. In a voice call, a slow timeout is the worst case: silence, then a failure.
The same chapter warns about averages. A service can average 100 ms while 1% of requests take 5 seconds. Use a histogram per tool, and read the tail of tool call latency.
The arguments summary
Raw arguments carry names, phone numbers and dates of birth. The conventions mark them Opt-In and sensitive. Record a summary instead.
Good summaries are bounded. List which argument keys were present, whether each value was normalised, and a short hash of the canonical arguments. The hash finds repeats without storing values. Our post on PII redaction in logs and traces covers where to mask.
Whether the arguments were right is a different question. See tool argument accuracy. The trace only has to make the question answerable.
The result summary
Record what kind of thing came back, not the thing: item count, byte size and an empty flag, plus the HTTP status class if the tool calls an API. These catch the empty-200 case without storing a patient's record.
Whether the model used the result
This is the field most traces lack, and the one that exposes the worst silent failures.
All three major providers tie a result to a call by an identifier. Anthropic's handle tool calls page says each tool_use block has an id, and each tool_result carries the matching tool_use_id. It says to send one result per tool use "even if the tool failed," and to set is_error to true on failure. OpenAI's function calling guide says tool output should reference the call by call_id. Google's Gemini function calling guide passes the function call id back as call_id in the result.
That identifier is your join key. Record on the tool span whether a result went back to the model, and whether it was flagged as an error. Then look at the model span that follows. Does the reply reflect the result?
You can decide this in code for many tools. If the result lists three open slots, check that the reply offers one of them. If it cannot be decided, say so. Set undetermined. A trace that admits a blind spot is more useful than one that fills it with a guess.
How retries show up in a trace
Tool call retries are second attempts at the same logical call. One span for both loses the attempt. Unrelated spans lose the grouping. The fix is a parent and children.
- Parent: the logical tool call. One span per request from the model. It carries the tool name, the model's call ID, the attempt count and the final outcome.
- Children: one attempt span per try. Each has its own start, end, status and error class.
The stable HTTP span conventions take the same approach for requests on the wire. They say instrumentations should create a span for each attempt. They define http.request.resend_count as the ordinal number of the resending attempt, recommended only if the request was retried. If your tool calls an API through an instrumented HTTP client, you may already get the attempt spans. Your tool span becomes their parent.
The HTTP page also says instrumentations should not emit a logical encompassing HTTP client span. That rule is about HTTP client spans. Your tool span wraps the model's request, not one HTTP call. Keep it.
Where the error goes
The recording errors page says errors that were retried or handled should not be recorded on spans or metrics that describe the operation. Our reading for voice: do not put Error on the logical tool span if a retry recovered. Put it on the failed attempt. Set Error on the parent only when every attempt failed, or when the final result is unusable.
That keeps your error rate honest, and the trace still shows the retry.
Who retried
Retries come from several layers: the tool wrapper, the HTTP client, the model and the backend.
The SRE book's cascading failures chapter warns that retries multiply across layers. With three retries at each of three layers, one user action can produce 64 attempts on the database. It advises limiting retries per request and not retrying at multiple levels.
The trace can tell the layers apart with two identifiers:
- Same model call ID, several attempt spans. The wrapper or client retried.
- New model call ID, same tool and same arguments hash. The model asked again. This is a repeated tool call.
Anthropic's docs say that after an error result, Claude "might then call the tool again with a new tool_use block," so you should limit how many retries your loop allows. That is the second pattern, and it is invisible if you only count HTTP requests.
Which retries are safe
A trace cannot tell you whether a retry was safe. It can record the facts you need. MDN defines an idempotent method as one where several identical requests have the same intended effect as one. GET, PUT and DELETE qualify. POST and PATCH are not guaranteed to. RFC 9110 says only some requests can be automatically retried by a client after an underlying connection failure.
So record the HTTP method and whether the call carried an idempotency key, as a boolean. A write with two attempts and no key is a flag for review. Keys and read-back are covered in interrupted tool calls.
Reading silent failures in a trace
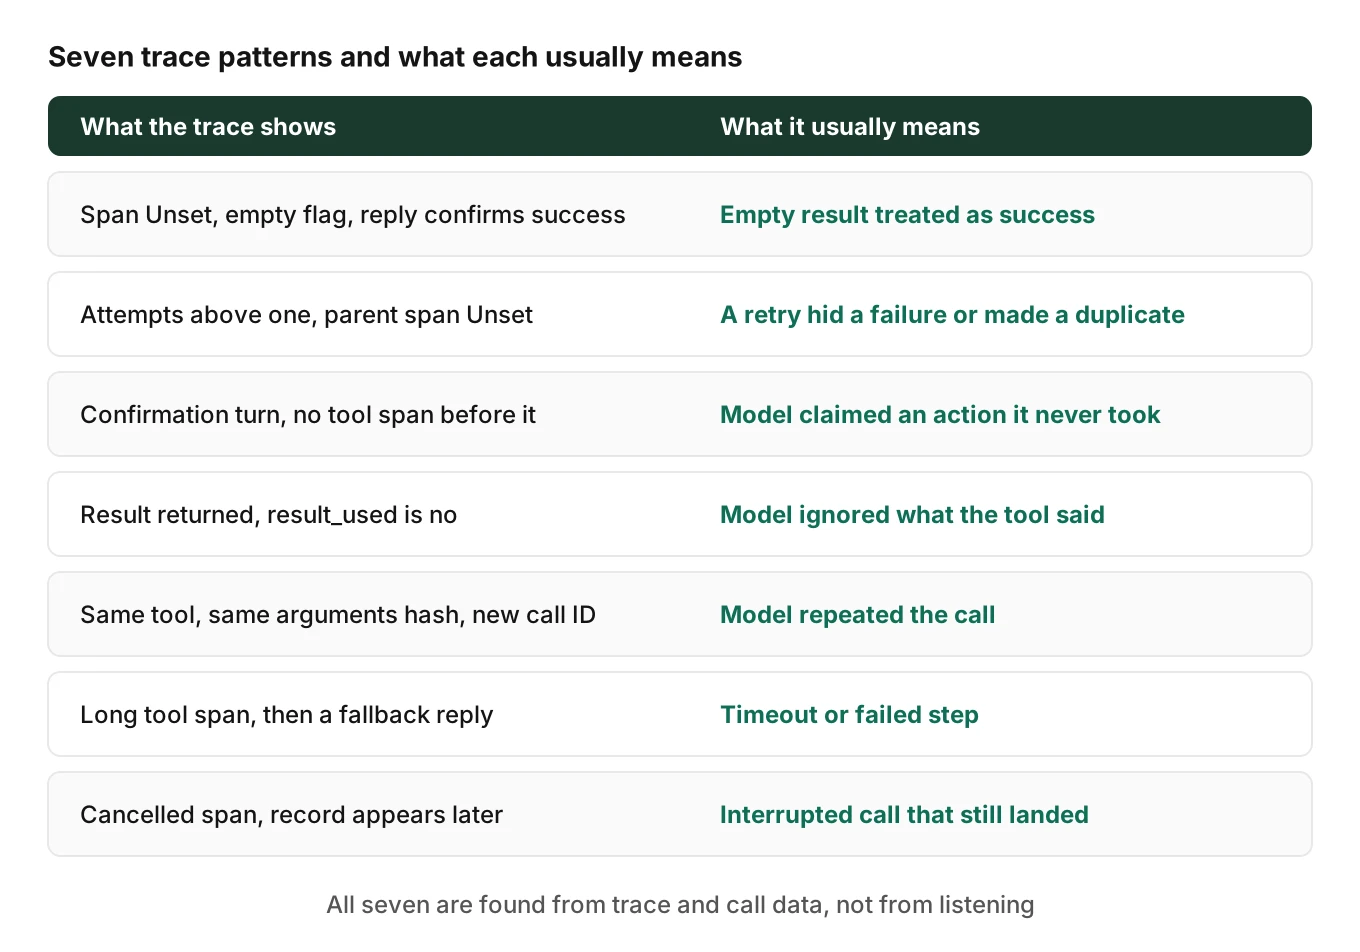
A silent failure is a tool call that went wrong while everything looked fine. In a trace it has a few recognisable shapes. Each is found from the fields above, not from listening to the call.
| What the trace shows | What it usually means |
|---|---|
Tool span Unset, empty flag true, reply confirms success | Empty result treated as success |
| Attempts above one, final span Unset | A retry hid a failure, or caused a duplicate |
| Confirmation turn with no tool span before it | The model claimed an action it never took |
Result returned, result_used is no | The model ignored what the tool said |
| Same tool, same arguments hash, new call IDs | The model repeated the call |
| Tool span long, then fallback reply | A timeout or a failed step |
| Tool span ended at cancel time, record exists later | An interrupted call that still landed |
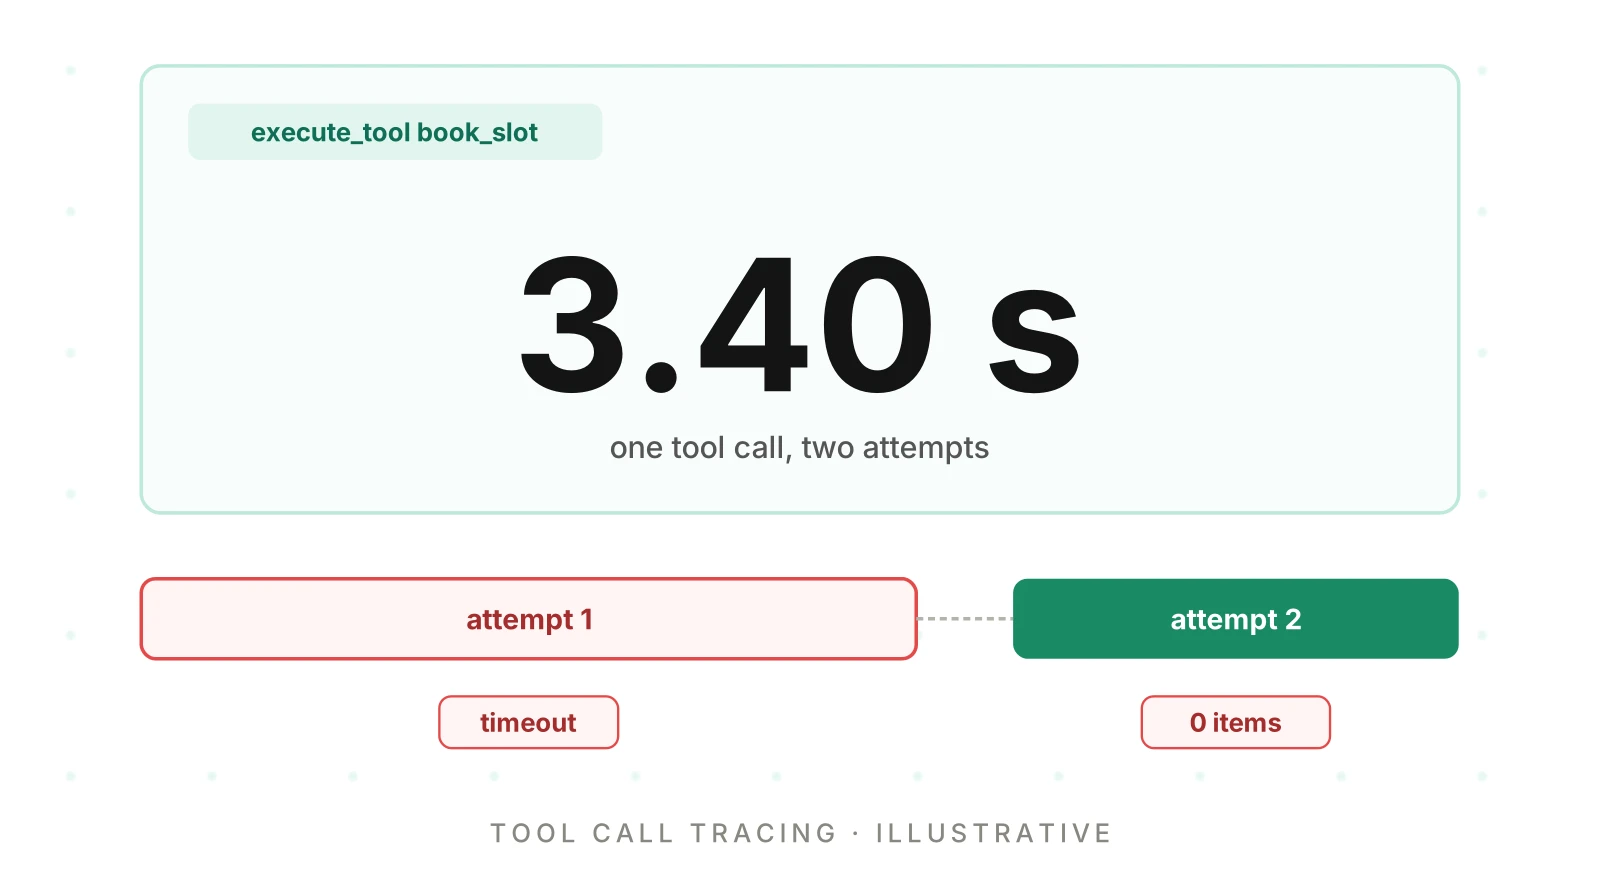
Go back to the opening call. Its trace has two attempt spans. Attempt one ended at 2.00 seconds with error.type set to timeout. Attempt two returned a 200 with zero items. The parent span is Unset. The next model span produced "You're all set."
Read in order, the fields tell the story. The tool timed out once. The retry returned nothing. The model ignored the empty result. Status never changed. Without the result summary and the result_used field, the trace shows a long but successful tool call.
The question "did a confirmation follow an empty result?" has an answer only if both facts are on the trace.
For the assertions that test for this before release, see detecting silent tool failures. For the test-case library, see voice agent tool calling test cases.
A simplified instrumentation sketch
This sketch uses the OpenTelemetry Python API. It is simplified, and the field names after gen_ai. are our suggestions. It creates a logical span and one child per attempt.
import time
from opentelemetry import trace
from opentelemetry.trace import Status, StatusCode

tracer = trace.get_tracer("voice-agent")

def call_tool(tool, name, call_id, args_summary, max_attempts=2):
    with tracer.start_as_current_span(
        f"execute_tool {name}",
        attributes={
            "gen_ai.operation.name": "execute_tool",
            "gen_ai.tool.name": name,
            "gen_ai.tool.call.id": call_id,
            "voice.tool.args_summary": args_summary,
        },
    ) as parent:
        backoff_ms, result = 0, None
        for attempt in range(1, max_attempts + 1):
            with tracer.start_as_current_span(f"{name} attempt") as span:
                span.set_attribute("voice.tool.attempt", attempt)
                try:
                    result = tool()
                    break
                except TimeoutError:
                    span.set_attribute("error.type", "timeout")
                    span.set_status(Status(StatusCode.ERROR))
            time.sleep(0.25)
            backoff_ms += 250
        parent.set_attribute("voice.tool.attempts", attempt)
        parent.set_attribute("voice.tool.backoff_ms", backoff_ms)
        if result is None:
            parent.set_attribute("error.type", "timeout")
            parent.set_status(Status(StatusCode.ERROR))
            return None
        empty = not result.get("items")
        parent.set_attribute("voice.tool.result_summary",
                             f"items={len(result.get('items', []))}")
        parent.set_attribute("voice.tool.outcome",
                             "empty" if empty else "success")
        return result
Check the calls against your SDK version before use. Set voice.tool.result_used later, from the code that reads the model's next reply.
The sketch sets no Error on the parent when an empty result arrives, because no error occurred. It marks the outcome empty instead.
How to trace tool calls in a voice agent in six steps
1. List the tools by risk - Mark each tool as read, soft write, hard write or money. Instrument the hard writes and money first, because their silent failures cost the most.
2. Create one logical span per model request - Name it execute_tool {tool name}. Set the operation name, tool name and the model's call ID at creation. Link it to the model span that asked for it.
3. Add a child span per attempt - Record each attempt's start, end, status and error class. Record the wait between attempts as a field on the parent. Do not mark the parent as an error if a retry recovered.
4. Record summaries, not content - Capture the argument keys and a hash, the result type, item count and an empty flag. Keep raw values out of attributes. Redact before export if you need content elsewhere.
5. Link the result to the next model turn - Use the call ID to join the tool result to the model span that follows. Set result_used to yes, no or undetermined. Never leave it blank.
6. Stage a failing call and read it back - Make a stub tool time out once, then return empty. Run a test call and open the trace. Check that you can see both attempts, the empty result and the model's reaction.
Then save the weekly queries, such as empty results followed by a confirmation.
Where Evalgent fits
Evalgent is a testing, evaluation and monitoring platform for voice agents. Evalgent Observe, which is launching, ingests OpenTelemetry-format data from any stack. It traces each failure to the step or handoff that caused it, and groups failures into root causes. Repeated tool calls and failed steps are among the findings, found from your traces and call data. Where the data cannot support a verdict, it says "undetermined" and shows the coverage gap. It never sits in the media path.
Evalgent Monitor, which is live, flags production problems such as tool-call failures and latency spikes, with fix recommendations. Evalgent can also measure uptime and latency percentiles.
On the testing side, Reviews replay a test call with the audio and transcript together, and show the exact tool payloads. That lets you check a tool trace against what the simulated caller actually said. If you want to see this on your own agent, you can book a demo.
A tool can only read what you recorded. For the wider picture, see what is voice agent observability, voice agent root cause analysis and the OpenTelemetry trace and span model.
Frequently asked questions
What is voice agent tool call tracing?
Voice agent tool call tracing means recording each tool call a voice agent makes as a span in a trace. The span carries the tool name, timing, retries, status, a summary of arguments and results, and whether the model used the result. It lets a reviewer explain a slow or wrong turn without replaying the call.
What should a tool call span capture?
Capture the tool name, the model's call ID, status and error class, attempt count, wall time and backoff time. Add a summary of the arguments and the result, and whether the model used the result. Keep raw values out. The OpenTelemetry conventions mark arguments and results Opt-In because they may hold sensitive information.
How do I see retries in a voice agent trace?
Use one parent span per model request and one child span per attempt. The parent records the attempt count and final outcome. If the model calls the tool again, it gets a new call ID. Same tool and same arguments hash under a new call ID means the model repeated the call.
How do I find silent tool failures in a trace?
Look for tool spans with no error but an empty result, followed by a confirmation. Also look for attempts above one with an Unset parent, and confirmations with no tool span before them. Status alone misses these. You need a result summary and a record of whether the model used the result.
Should a tool span be marked Error if a retry succeeded?
Our reading of the OpenTelemetry recording errors guidance is no. It says errors that were retried or handled should not be recorded on the spans describing the operation. Mark the failed attempt as Error and leave the parent Unset. Set the parent to Error only if all attempts fail or the result is unusable.
How much latency does a tool call add for the caller?
More than its own duration. The caller waits from the end of their speech to the first agent audio. That includes the model deciding to call the tool, the tool itself, the model reading the result and synthesis starting. In our illustrative turn, a 3.40 second tool span sat inside a 5.45 second wait.
Should I record tool arguments and results on spans?
Usually not in full. Voice tools take names, phone numbers and dates of birth. The OpenTelemetry page marks both attributes Opt-In and warns they may be sensitive. Record argument keys, a hash, the result type, item count and an empty flag. Redact before export if you must keep content elsewhere.
Are the OpenTelemetry tool attributes stable?
Not yet. As of November 19, 2026, the execute tool page in the GenAI conventions is marked Development, and its attributes are Development too. Only error.type and the exception attributes it uses are Stable. Pin the version you target, and use your own prefix for fields the standard does not define.
The bottom line
Voice agent tool call tracing works when each tool call is a parent span with one child per attempt, plus summaries of the arguments and result and a record of whether the model used it. Status alone will not find silent failures, so record what came back and what the agent said next.
Related Articles

How to automate voice agent testing: synthetic callers vs manual QA
Learn how ai test automation replaces manual QA for voice agents. Compare synthetic callers vs human testers, with a 5-step framework to scale without hiring.
Read more
AI Agent Testing vs Voice Agent Testing: What General Tools Miss for Voice
AI agent testing measures text outputs. Voice agent testing measures behaviour through an acoustic pipeline. Five failure categories general tools miss.
Read more