Langfuse and Voice Agents: What Trace Tools Capture and What They Miss
On this page
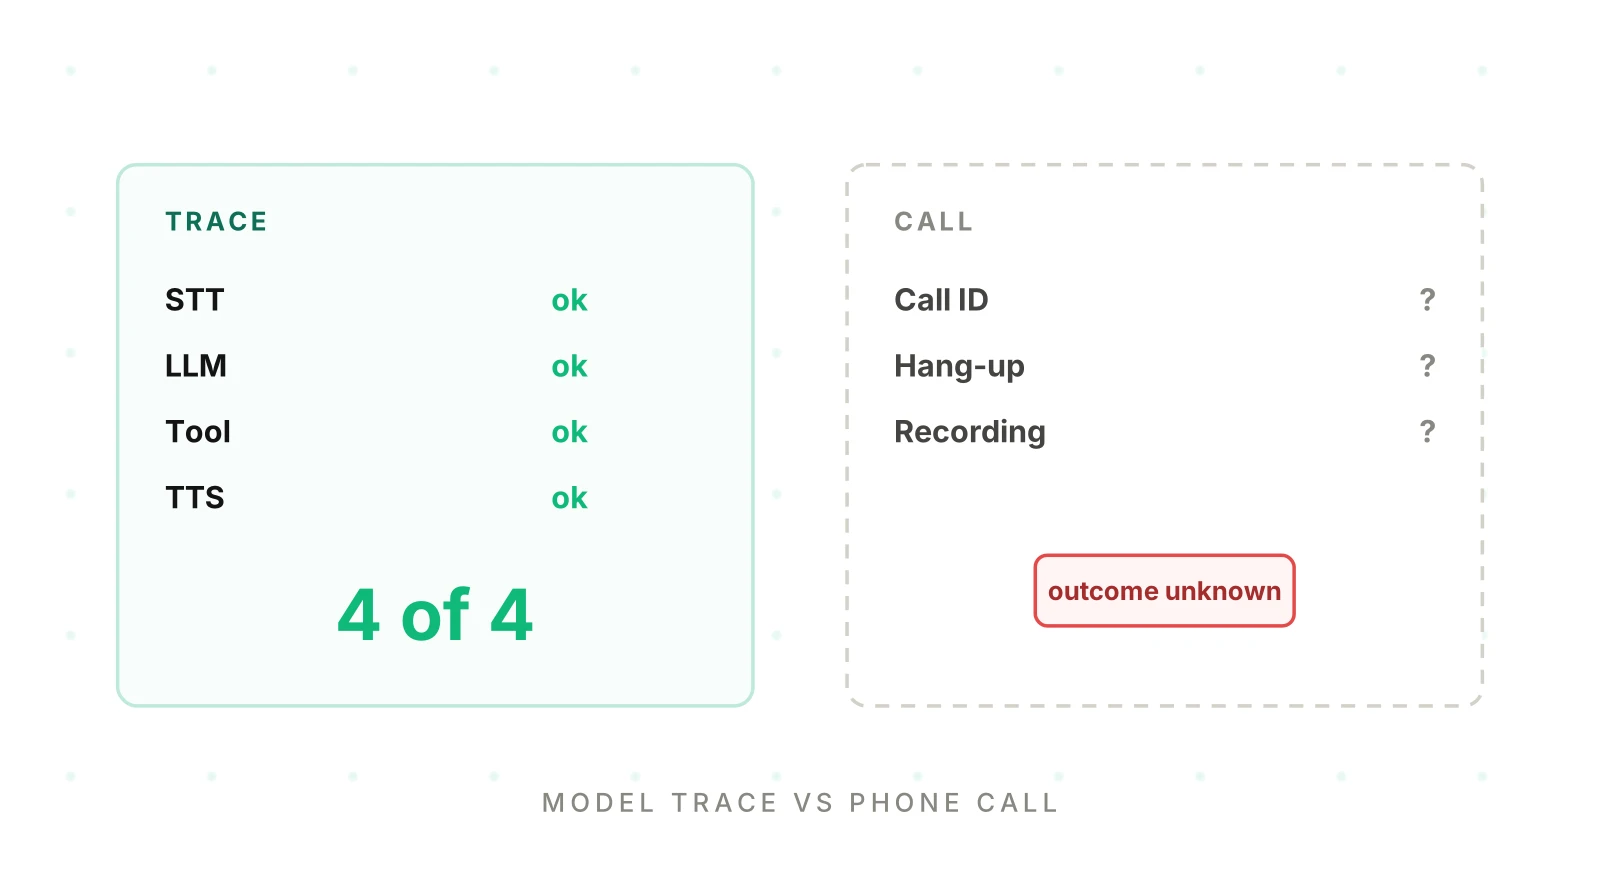
A caller says the agent "kept going after I spoke." You open your tracing tool. Every model call is there, with inputs, outputs and token counts. Nothing is red. The question is whether that trace is enough, and what it would need to hold for you to find the cause.
This post is about Langfuse voice agents setups: what an LLM tracing tool records, what the docs say about voice frameworks, and what a voice team still has to add. Every Langfuse fact below comes from its docs, opened on November 19, 2026. Each is linked.
Other posts cover the surrounding ground. For the vendor-neutral map, read what voice agent observability is. For the span schema, read the OpenTelemetry trace and span model for voice agents. This post is the Langfuse-specific one. It covers where its data model fits a call and where it does not.
What Langfuse records well
Langfuse is an LLM engineering platform with a tracing core. Its data model page defines the units. This is a plain reading of that page.
A trace "represents a single request or operation," such as one chatbot interaction. An observation is one step inside it: an LLM call, a tool call or a retrieval step. Observations nest. Langfuse names several LLM-specific types, such as generations and events, and calls spans observations too.
A session is an optional grouping of traces that belong to the same user interaction. The page recommends it for multi-turn conversations. A user attribute records which end user triggered a trace. Environments separate production from staging. Tags and metadata carry labels and custom key-value data.
That is a good fit for a model pipeline. For Langfuse voice agents, each part maps to something you already have. The table below is a suggested mapping, not a Langfuse rule.
| Langfuse concept | What the docs say | Suggested voice mapping |
|---|---|---|
| Session | Groups traces from one user interaction | One phone call |
| Trace | One request or operation | One turn, or the whole call (see below) |
| Observation | One step: LLM, tool or retrieval | STT, LLM, tool and TTS steps |
| User ID | Which end user triggered the trace | Caller or customer account, not a raw phone number |
| Environment | production, staging, development | Same split for your voice agent |
| Tags and metadata | Labels and key-value data | Agent version, tenant, call ID |
Scores and prompt versions
Scores are Langfuse's evaluation record. The scores page lists four value types: numeric, boolean, categorical and text. A score can attach to a trace, an observation or a whole session. A session score needs only the session ID. The REST route is POST /api/public/scores.
That matters for voice. A score on the session is a place to put a per-call verdict, such as "resolved" or "abandoned." Langfuse stores it. It does not decide it. You still write the logic that judges the call.
Prompt versions link to generations when you pass the fetched prompt object. The prompt linking page shows the prompt argument in the Python SDK. It also says that a fallback prompt creates no link. For a voice agent, that link answers "which prompt version produced this reply." It does not tell you which version was live on a given call unless every generation is linked.
Audio as media
Langfuse can hold audio as media in a trace. Its multi-modality page lists formats including WAV, MP3, OGG and FLAC. The SDKs upload base64 data to object storage and put a reference in the trace. You can also wrap bytes in the LangfuseMedia class.
The docs do not say Langfuse analyses the audio. It stores and shows it. A link to the call recording is still worth keeping on the trace. We return to that below.
Langfuse voice agent tracing: how the data gets in
For a voice stack, the useful door is OpenTelemetry. This is the core of any Langfuse OpenTelemetry voice setup. The OpenTelemetry integration page describes the endpoint and its limits. As of November 19, 2026:
- The path is
/api/public/otel. The traces path is/api/public/otel/v1/traces. - Langfuse accepts OTLP over HTTP, in both JSON and protobuf form. gRPC is not supported.
- Auth is Basic, built from the base64 of your public and secret keys.
- Regional hosts exist for EU, US and Japan, and a self-hosted option needs v3.22.0 or later.
- Setting the header
x-langfuse-ingestion-version=4makes data appear in real time. Without it, directly ingested data can lag by up to 10 minutes.
The page also says Langfuse "aims to be compliant" with the OpenTelemetry GenAI semantic conventions. It adds that those conventions are still evolving. For what the conventions cover and miss for voice, read the GenAI conventions post.
Several gotchas from that page matter for LLM tracing voice agent calls.
Filter fields must sit on every span. Trace-level filtering by user, session, metadata or tags needs the attribute on every span, not only the root. If you set the call ID once at the top, filters may miss child spans.
A root span is required. Langfuse needs one to build a trace. Dropping spans in an OpenTelemetry Collector can leave traces incomplete.
Timestamps get filled in. If a span lacks a start or end time, Langfuse fills it from the other or from ingest time. For turn timing, send both on every span.
Langfuse attributes win. Its own langfuse.* attributes take precedence over generic conventions. Session ID is langfuse.session.id or session.id. Metadata under langfuse.trace.metadata.* becomes a filterable top-level key. Other attributes land under metadata.attributes and are not filterable.
That last point is easy to miss. A voice field like voice.turn.interrupted sent as a plain attribute is stored. You can read it on a span. You cannot filter on it unless you also place it in a metadata key.
What the docs say about LiveKit and Pipecat
Langfuse documents both frameworks. The two pages describe different shapes, so check which one you use.
Langfuse LiveKit
The LiveKit page says LiveKit Agents has built-in OpenTelemetry support. You create one tracer provider and share it with Langfuse. The Langfuse SDK registers as a span processor. The page's example sets langfuse.session.id to the room name. It also sets should_export_span to pass all spans, because LiveKit emits many internal spans.
The page has a JavaScript warning. Do not pass the metadata option to telemetry.setTracerProvider(). It says that crashes the worker. Attach attributes through a span processor instead.
So the LiveKit shape is: room becomes session. That is the Langfuse LiveKit pattern in one line. For the LiveKit side of this, see LiveKit Agents observability.
Langfuse Pipecat
The Pipecat page describes conversation, turn and service spans for STT, LLM and TTS. It lists time-to-first-byte metrics and usage such as token counts. Each trace is one full conversation. The page says there is "no need to group traces under a session."
You can set conversation_id on the pipeline task. It is optional and auto-generated if omitted. If you want a session ID anyway, the page passes langfuse.session.id through additional span attributes. The Pipecat side is covered in Pipecat observability.
So the Pipecat shape is: conversation becomes trace, turns become spans.
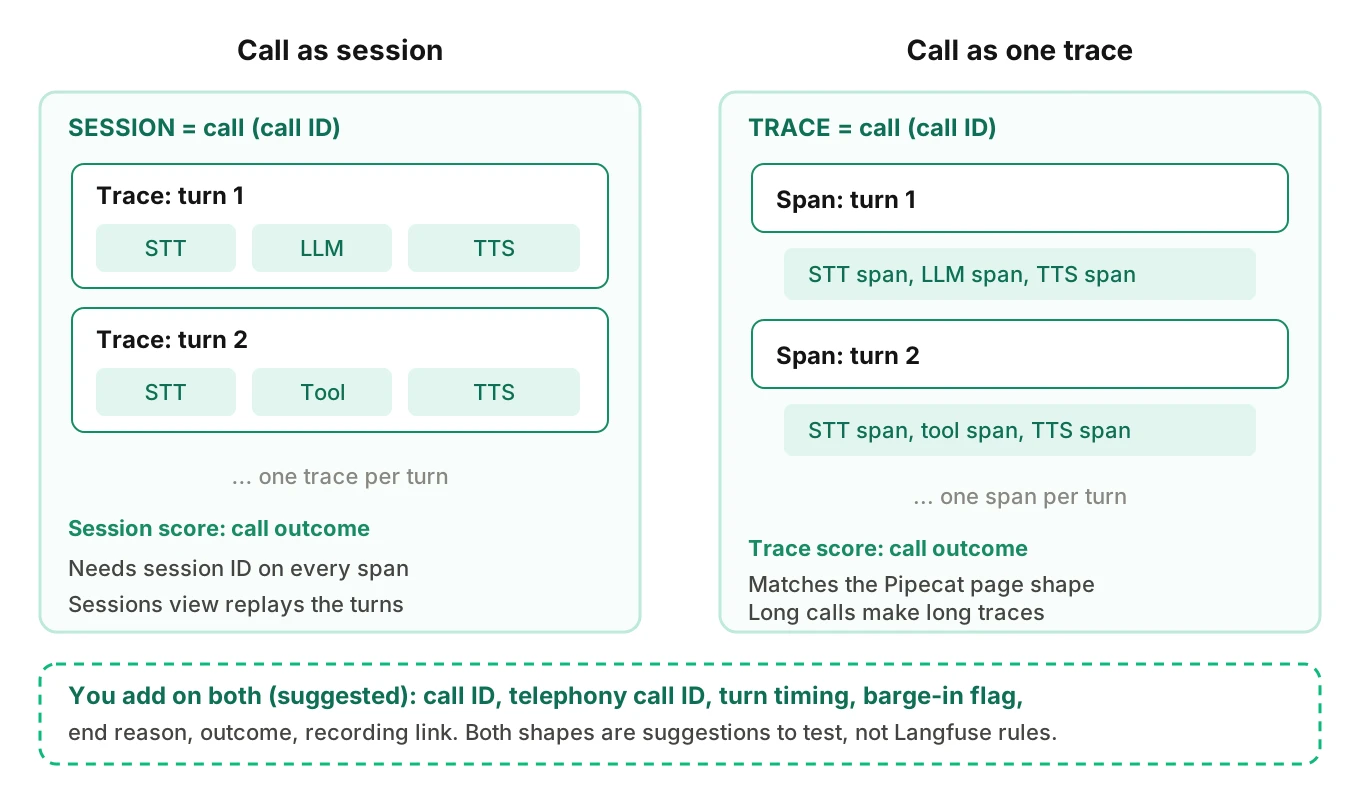
Modelling a call: session of turns, or one trace
Both shapes are valid. Langfuse voice agents teams should pick one on purpose, because it changes what the UI and filters show. These are suggestions for you to test, not Langfuse guidance.
| Choice | Call as session, turns as traces | Call as one trace, turns as spans |
|---|---|---|
| Fits | LiveKit page example (room as session) | Pipecat page (conversation as trace) |
| Call-level view | Sessions view replays all traces in order | One trace tree shows the whole call |
| Per-turn scores | Easy: score each trace | Score an observation; needs trace ID too |
| Per-call score | Session score by session ID | Trace score |
| Risk | Turn traces need the session ID on every span | Very long traces for long calls |
| Filter by call ID | Use session ID | Use trace metadata |
The sessions page adds limits. A session ID can be any US-ASCII string under 200 characters. Longer IDs are dropped. In the Python SDK you wrap code in propagate_attributes(session_id=...). In JS and TS you call propagateAttributes. Set it early so every observation is covered.
Two practical rules follow. Use a call ID you mint, not a free-text string, so it stays ASCII and short. And store the telephony provider's call ID as separate metadata. Do not overload one field with both. Call ID correlation covers the join in detail.
What a trace tool does not know about a call
Langfuse models LLM work. A call is more than LLM work. Langfuse voice agents setups still need the fields below. "Add" means you send it as attributes, metadata or scores. The tool then stores and shows it.
| Gap | What is missing from a model trace | What to add (suggested fields) |
|---|---|---|
| Call-level identity | No phone-call concept; session is a grouping you create | call_id, telephony call ID, tenant, agent version |
| Turn timing | LLM latency is not caller-perceived delay | Speech start and end, response start, time to first audio |
| Interruption | A trace cannot show two parties talking at once | Barge-in flag, agent stop time, overlap length |
| Telephony leg | SIP and carrier events are not LLM calls | Call setup time, end reason, transfer events |
| Call outcome | A trace says the step ran, not that the caller got help | Outcome tag, hang-up party, task completed |
| Cross-call patterns | Traces are inspected one at a time | Failure cluster label, release version |
| Recording | Audio can be attached, but must be linked | Recording URL or media reference, channel layout |
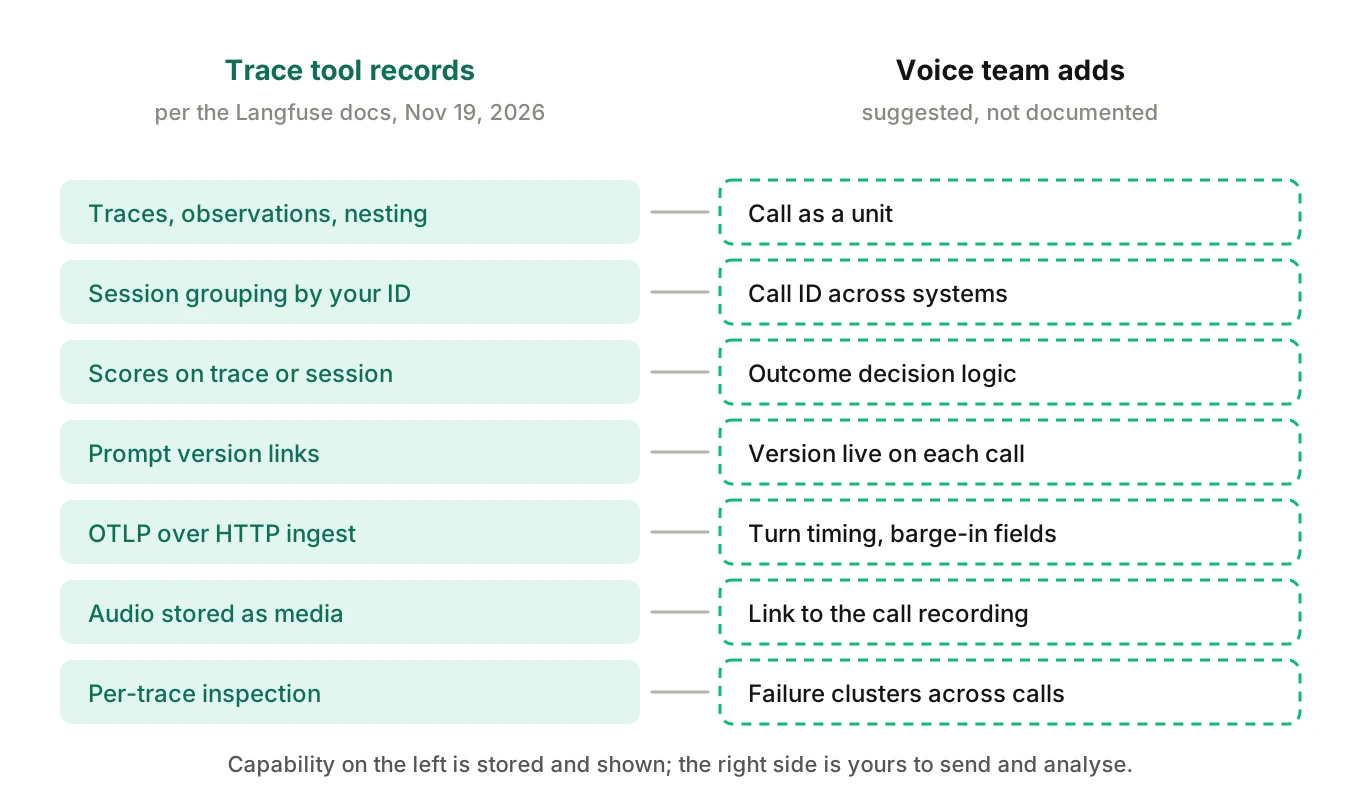
The fields in the middle column are worth reading closely. A generation's latency is how long a model call took. A caller hears something else: the gap between their last word and the agent's first sound. That gap includes endpointing, queueing, speech synthesis and the network. Tools built around the model call do not record those unless you do. See voice agent span attributes for the per-turn fields and what to log on voice agent calls for the full record.
Privacy before you send
Transcripts and tool arguments in traces can hold personal data. Langfuse documents a masking function in its SDK. It applies only to spans exported by that client, per its masking page. Collector-side masking runs after data leaves your app. Where to mask voice agent logs and traces walks through that choice.
Worked example: all spans fine, call failed
This is an illustrative call. It is made up, and every value is an assumption.
A scheduling agent handles a rebooking. The session in your tracing tool shows 11 traces. Each has an STT step, an LLM step and a TTS step. All finished without error. The LLM steps look fast.
The caller hung up at the ninth turn. The agent had kept speaking for part of the caller's question. Nothing in the model traces says so, because speech overlap is not a model event.
Only a few added fields change this. A barge-in flag on turn nine. The agent's stop time after the caller began. A hang-up party tag on the call. With those on the session, you can see the cause: the agent was slow to stop. Without them, all 11 traces look healthy.
That is the core point. A model trace tells you each step worked. A call-level record tells you whether the call worked.
When a trace tool is enough, and when it is not
Langfuse voice agents setups are enough more often than people expect, early on. The table below is a decision aid built from the gaps above.
| Your situation | Trace tool alone | Add call-level analysis |
|---|---|---|
| One agent, low volume, one engineer reads calls | Usually enough | Not yet |
| Debugging a prompt or tool-call bug in one call | Enough, with a call ID | Not needed |
| Need per-turn latency and token cost | Enough with timing fields added | Optional |
| Complaints about talking over callers or dead air | Only if you added turn fields | Yes, to find the pattern |
| Many calls fail, cause unclear | No: you read traces one by one | Yes: cluster by root cause |
| Same issue across many tenants or releases | No | Yes: tie failures to a release |
| Regulated calls needing an evidence trail | Partly | Yes |
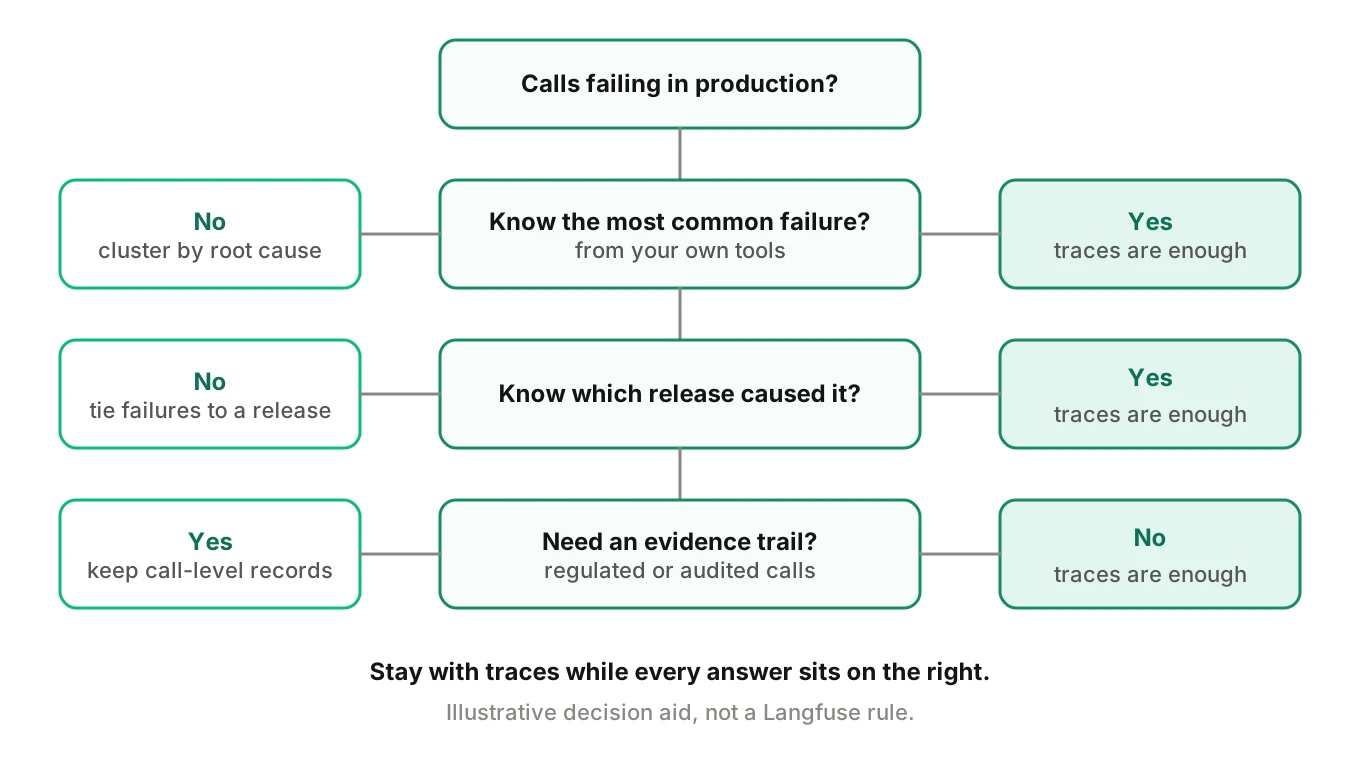
Three signs you have outgrown one-at-a-time reading. You cannot say which failures are most common. A fix ships and you cannot tell which calls it helped. Two people disagree about the cause of the same call.
At that point the work is call-level root cause and failure clustering: trace a failure to the step or handoff that caused it, then group failures by cause. Read voice agent root cause analysis for the argument. How to cluster voice agent failures gives the method, and how to root-cause a bad call in 10 minutes gives the routine for one call.
How to send a voice call's telemetry to Langfuse and keep a call ID joinable
This is a five-step setup for sending a voice call's spans to Langfuse over OpenTelemetry. It is simplified and illustrative. Endpoint, auth and the langfuse.* attribute names are from the Langfuse docs read on November 19, 2026. Names like call_id and voice.* are suggestions. Check the docs before you copy anything.
1. Mint the call ID and pick the shape — Create one ID at call start. Keep it ASCII and under 200 characters. Decide whether the call is a session of turn traces or one trace of turn spans. Store the telephony provider's call ID as a second value.
2. Point an OTLP HTTP exporter at Langfuse — Use the traces path with Basic auth, and set the ingestion version header for real-time data. gRPC will not work.
3. Stamp every span with the call ID — Use a span processor so no span is missed. Put the session ID and a metadata key on each one, because filters need them on every span.
4. Add the voice fields as attributes — Send turn timing, barge-in and end reason on the relevant spans. Mirror the ones you will filter on into a langfuse.trace.metadata.* key.
5. Test with one call and join it — Place a test call. Find its session in Langfuse. Confirm the call ID matches your telephony record and your recording. If you cannot join all three, fix that before you add volume.
# Simplified and illustrative. Check the Langfuse OpenTelemetry page for current settings.
import base64
from opentelemetry import trace
from opentelemetry.sdk.trace import TracerProvider, SpanProcessor
from opentelemetry.sdk.trace.export import BatchSpanProcessor
from opentelemetry.exporter.otlp.proto.http.trace_exporter import OTLPSpanExporter

auth = base64.b64encode(f"{PUBLIC_KEY}:{SECRET_KEY}".encode()).decode()

exporter = OTLPSpanExporter(
    endpoint="https://cloud.langfuse.com/api/public/otel/v1/traces",
    headers={
        "Authorization": f"Basic {auth}",
        "x-langfuse-ingestion-version": "4",
    },
)

class CallStamp(SpanProcessor):
    """Put the call ID on every span, as filters need it on all of them."""
    def __init__(self, call_id, telephony_id):
        self.call_id = call_id
        self.telephony_id = telephony_id
    def on_start(self, span, parent_context=None):
        span.set_attribute("langfuse.session.id", self.call_id)
        span.set_attribute("langfuse.trace.metadata.call_id", self.call_id)
        span.set_attribute("langfuse.trace.metadata.telephony_call_id", self.telephony_id)
    def on_end(self, span): pass
    def shutdown(self): pass
    def force_flush(self, timeout_millis=30000): return True

provider = TracerProvider()
provider.add_span_processor(CallStamp(call_id, telephony_call_id))
provider.add_span_processor(BatchSpanProcessor(exporter))
trace.set_tracer_provider(provider)
A real agent creates one processor per call, or reads the call ID from context. The sketch keeps one for clarity. This is the smallest working shape for Langfuse voice agents telemetry. If your framework already exports OpenTelemetry, such as LiveKit Agents or Pipecat, you add the processor and exporter to its tracer provider instead. Follow the framework pages above for that wiring.
Getting Langfuse data out, and what Evalgent Observe does with it
Two questions come up. Can you get data back out of Langfuse? And can a second tool use it?
On the first, the data platform overview lists the observations and metrics APIs, SDK queries, a one-off export from the UI and a scheduled blob storage export. The blob export page says schedules run every 20 minutes, hourly, daily or weekly. Output formats include Parquet, CSV, JSON and JSONL. Neither page mentions exporting through OpenTelemetry. The OpenTelemetry page describes receiving data, not forwarding it.
So the safest reading, as of November 19, 2026, is this. Langfuse takes OpenTelemetry in. Its documented ways out are APIs and exports. Do not assume an OpenTelemetry stream leaves it.
For Langfuse voice agents, the simplest way to avoid the question is to fork at the source. Your agent sends spans to Langfuse and to another backend at once. An OpenTelemetry Collector or a second span processor does this. Langfuse's own page notes the Collector route for sending data in.
Evalgent Observe is stack-agnostic. It ingests data in OpenTelemetry format from any stack, and there is an upload path for call details. Where your Langfuse data can be exported or forwarded in an OpenTelemetry-compatible form, it can be sent on. Otherwise, use the upload path. We do not claim a Langfuse integration.
What Observe adds is the call-level layer this post described. It traces each failure to the step or handoff that caused it. It clusters failures into root causes. Where the supplied data cannot support a verdict, it says "undetermined" and shows the coverage gap. It never sits in the media path. For calls already in production, Evalgent's call monitoring flags problems such as tool-call failures and latency spikes, with fix recommendations. For the path from a trace to a verdict, see trace a voice call end to end.
Frequently asked questions
Does Langfuse support voice agents?
Langfuse has documented pages for LiveKit Agents and Pipecat, and it accepts OpenTelemetry traces over HTTP. It records traces, observations and sessions for the model and tool work. It has no phone-call concept, so you add call ID, turn timing, telephony and outcome fields yourself.
How do I send voice agent traces to Langfuse?
Use an OpenTelemetry OTLP HTTP exporter pointed at the Langfuse traces endpoint, with Basic auth from your key pair. Langfuse accepts HTTP JSON and protobuf, not gRPC. If you use LiveKit or Pipecat, follow the Langfuse page for that framework, which shares the framework's tracer provider.
Is there a Langfuse LiveKit integration?
Yes. Langfuse has a LiveKit Agents page. LiveKit emits OpenTelemetry spans, and you share one tracer provider with the Langfuse SDK. The page's example sets the session ID to the room name. It also warns about a JavaScript option that can crash the worker.
How does Langfuse Pipecat tracing work?
The Langfuse Pipecat page sets up Pipecat's OpenTelemetry tracing with an OTLP exporter and tracing enabled on the pipeline task. It shows conversation, turn and STT, LLM and TTS service spans. Each trace is one conversation, and a session ID is optional.
Should one call be a Langfuse session or a trace?
Both work. A call as a session with each turn as a trace suits per-turn scoring and the sessions view. A call as one trace with turns as spans matches Pipecat's documented shape. Pick one, set the call ID on every span, and keep it consistent across agents.
Can Langfuse measure voice latency and interruptions?
It records timing on the spans you send, and it computes latency for LLM calls. Caller-perceived delay and interruption are not built-in fields. You must send speech start and end, response start and barge-in events as attributes, then mirror filterable ones into metadata keys.
Can I export Langfuse data to another tool through OpenTelemetry?
The Langfuse docs read for this post describe receiving OpenTelemetry. Their documented export routes are APIs, a UI export and scheduled blob storage export. None is described as OpenTelemetry. To feed a second tool, send spans to both backends at the source, or use an upload path.
When is Langfuse alone not enough for a voice agent?
It stops being enough when you cannot tell which failures are most common, or which release caused them. Reading traces one at a time does not scale. At that point you need call-level root cause: tracing each failure to its step, then clustering failures by cause.
The bottom line
For Langfuse voice agents, tracing records what each model and tool step did and takes your voice spans over OpenTelemetry. It does not know what a call is, so the call ID, turn timing, outcome and failure patterns are yours to add and analyse.
Related Articles

How to automate voice agent testing: synthetic callers vs manual QA
Learn how ai test automation replaces manual QA for voice agents. Compare synthetic callers vs human testers, with a 5-step framework to scale without hiring.
Read more
AI Agent Testing vs Voice Agent Testing: What General Tools Miss for Voice
AI agent testing measures text outputs. Voice agent testing measures behaviour through an acoustic pipeline. Five failure categories general tools miss.
Read more