Open door for builders.
Debugging a LiveKit Latency Issue End to End: Metrics, Waterfalls and Fixes
On this page
Search "livekit latency issue" and you find the same thread written fifty times. Someone's STT, LLM and TTS numbers add up to under a second, yet callers wait three. One community thread is titled exactly that: "ASR+LLM+TTS total <1s, but speech end to reply takes 3-4s." A GitHub issue reports 3,000 to 4,000 ms through Twilio and 6,000 to 7,000 ms through Telnyx.
The fix is rarely a magic setting. It is knowing what each metric starts and stops on, which hops no metric covers, and how to put the pieces back together into one per-turn waterfall. This guide does that from the source code. Every field, default and log line below was checked against `livekit-agents` 1.8.4, the current release on PyPI, plus the LiveKit docs as of October 2026.
If you want a framework comparison, read LiveKit vs Pipecat latency. This post is for teams already on LiveKit who need to find where their milliseconds went.
The per-turn latency chain inside LiveKit Agents
A turn in a cascaded LiveKit agent passes through nine hops. Five of them are timed by the framework. Four are not. Here is each hop, with the mechanism that sets its duration.
1. Uplink. Caller audio travels from the handset through the carrier, into LiveKit SIP (for phone calls) or the WebRTC client, through the SFU and into your agent server. Phone audio arrives as G.711 at 8 kHz unless your trunk supports HD voice. The agent cannot see this hop. Its clock starts when audio reaches it.
2. VAD end of speech. LiveKit's inference VAD declares end of speech after `min_silence_duration` of silence (0.25 s by default in 1.8.4). Then it back-dates the "user stopped speaking" anchor: `speech_end_time = now - silence_duration - inference_duration`. Every later metric is measured from that back-dated anchor, so the VAD's silence window is already inside them.
3. STT final transcript. A turn cannot close without a final transcript. LiveKit's short-utterances guide states that interim transcripts never close a turn. The Deepgram plugin defaults `endpointing_ms` to 25, so finals arrive quickly and LiveKit's own turn logic decides the rest. The gap is `transcription_delay`.
4. Turn detector and endpointing wait. The turn detector predicts whether the user is done. The session then waits `min_delay` (likely done) or `max_delay` (likely not done), counted from the back-dated anchor. With the streaming turn detector, defaults are 0.3 s and 2.5 s. Without it, 0.5 s and 3.0 s. If the detector does not answer within 1.0 s (`DEFAULT_PREDICTION_TIMEOUT` in the source), the turn commits without a prediction and logs `eot prediction timed out, committing without a prediction`.
5. Your hook. `on_user_turn_completed` runs. RAG lookups usually live here. Its duration is `on_user_turn_completed_delay`, and it sits on the critical path every turn.
6. LLM first sentence. The LLM streams tokens. `llm_node_ttft` times the first token. A newer field, `llm_node_ttfs`, times LLM start until the first sentence reaches the TTS provider. It is in the 1.8.4 `MetricsReport` source but not yet in the docs table.
7. TTS first byte. `tts_node_ttfb` times the first audio chunk after text was sent to the provider.
8. Frame push. The first audio frame is pushed to the room track. That instant is `started_speaking_at`. The source notes that for the default room output, `playback_latency` is "self-reported when the frame is pushed to the track, so it doesn't account for network delivery to the client."
9. Downlink and playout. The frame crosses the SFU, the SIP bridge, the carrier, a jitter buffer and the handset speaker. Again, invisible to the agent.
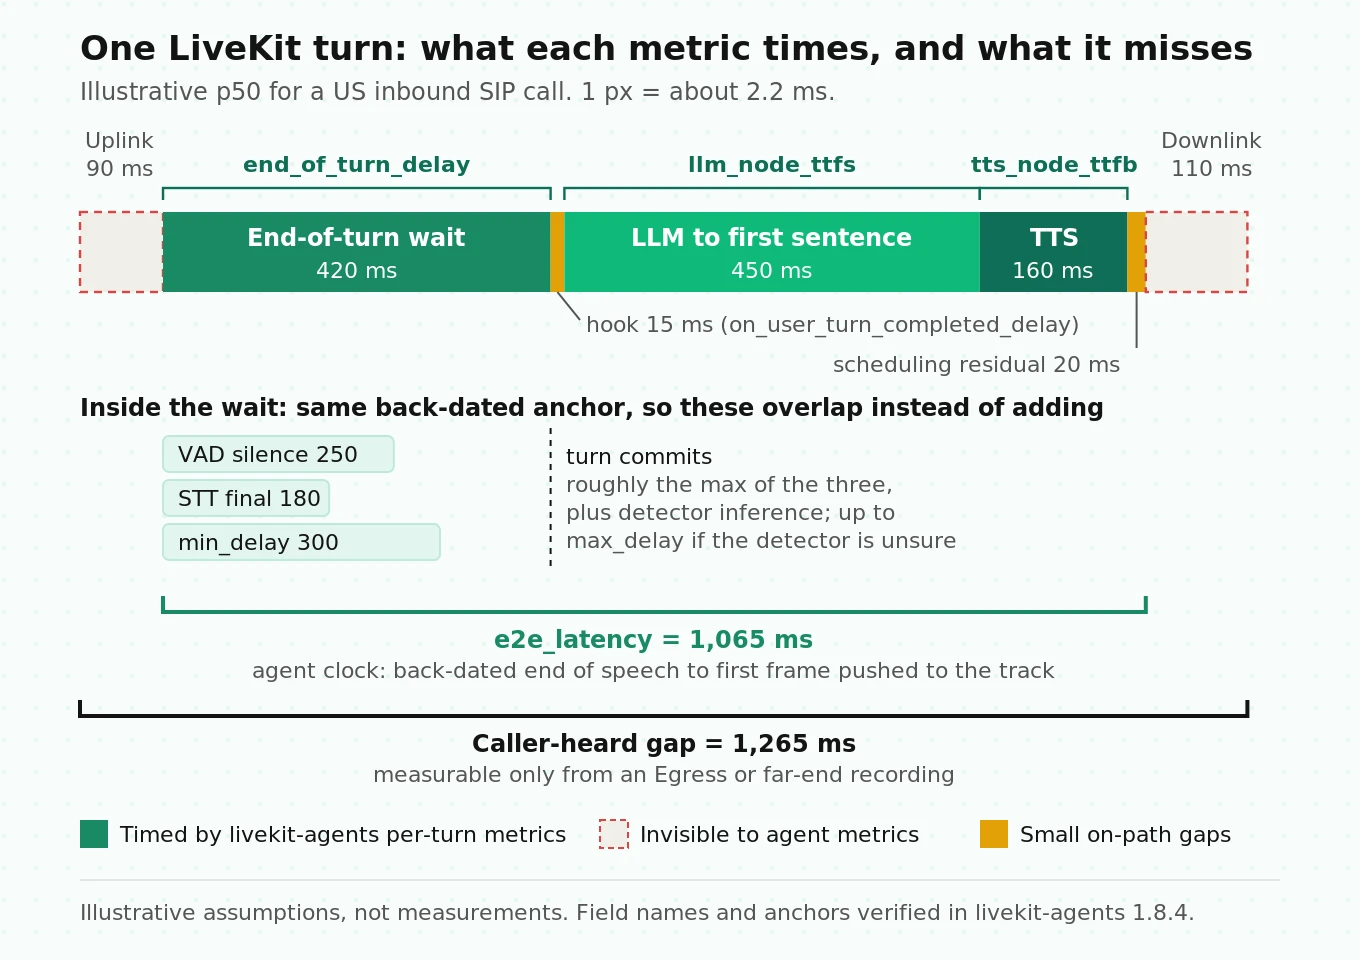
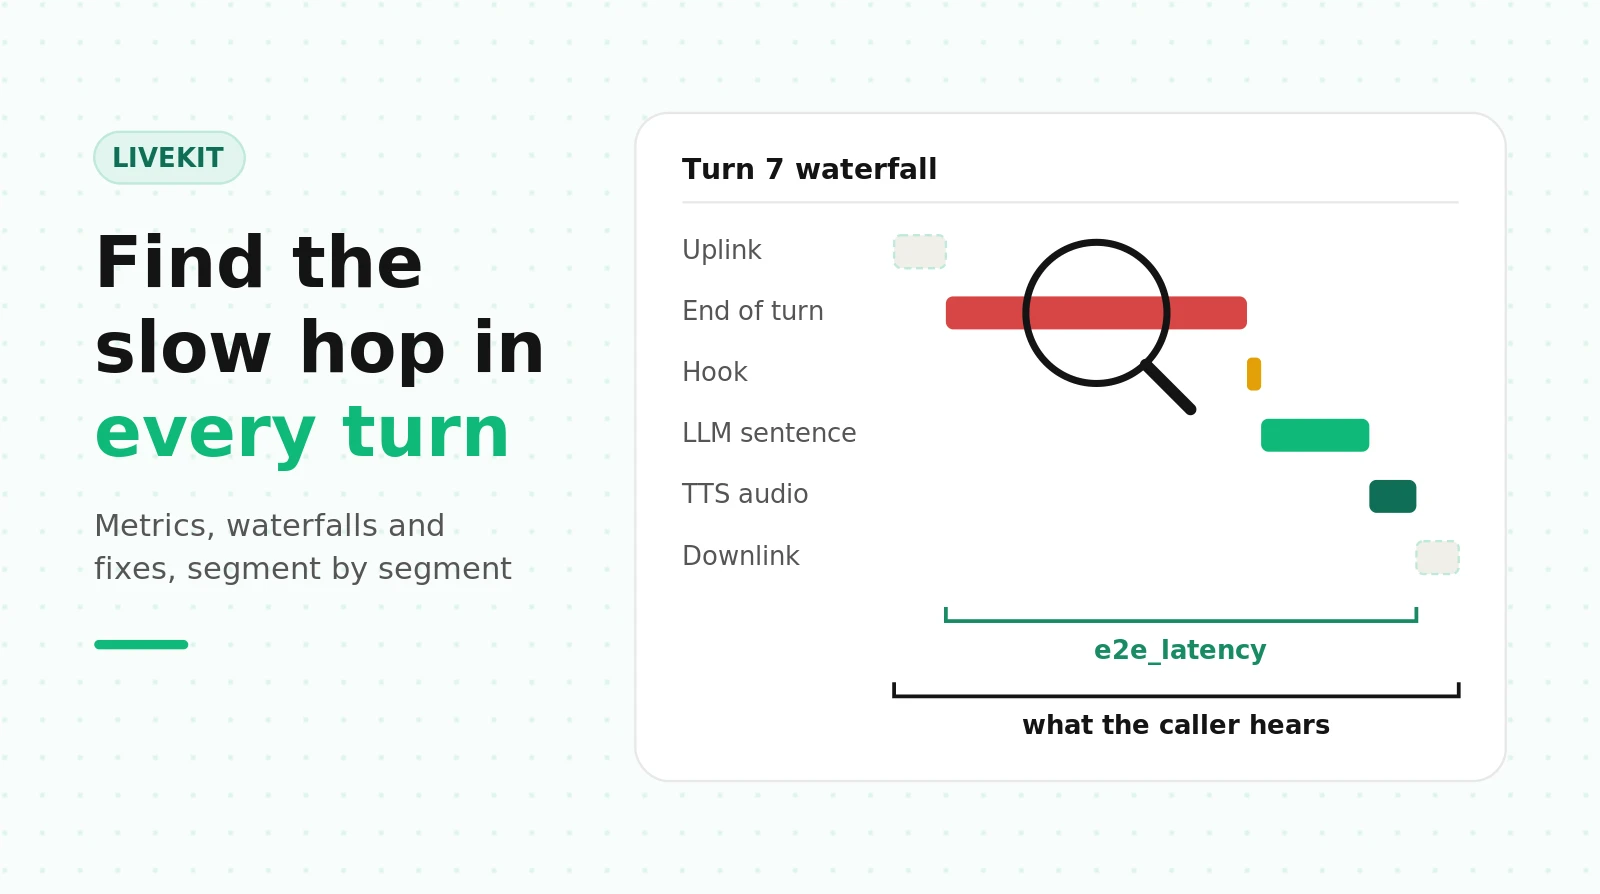
`e2e_latency` is computed as `started_speaking_at - stopped_speaking_at`. Both timestamps are on the agent's clock, so it covers hops 2 through 8 only. The two network legs are excluded by construction.
The end-of-turn wait is a max, not a sum
The single most useful mental model for hop 4 is a max function. Approximately:
`end_of_turn_delay ≈ max(transcription_delay, endpointing_delay, VAD silence + detector inference)`
Each term starts at the same back-dated anchor. So a 250 ms VAD window and a 300 ms `min_delay` do not add to 550 ms; they overlap. But a late STT final pushes the whole turn out, no matter how low you set `min_delay`. That is why `end_of_turn_delay` is never smaller than `transcription_delay`. It is also why raising Deepgram's own endpointing to the 300 ms many guides recommend quietly raises your floor. Our stack guide covers the related trap where STT turn detection stacks `min_delay` on top of the provider's endpointing.
What each LiveKit latency metric measures and what it misses
LiveKit exposes metrics on four surfaces: per-turn `ChatMessage.metrics`, per-plugin `metrics_collected` events, live `session.usage`, and the end-of-session report. The data hooks docs mark the session-level `metrics_collected` event as deprecated. Per-plugin events are not.
The table below is organized by clock: where each timer starts, where it stops, and what it cannot see.
| Field | Surface | Clock starts | Clock stops | Blind to |
|---|---|---|---|---|
| `transcription_delay` | User message | Back-dated VAD end of speech | Last final transcript | Uplink; clamped at 0 |
| `end_of_turn_delay` | User message | Back-dated VAD end of speech | Turn committed | Uplink |
| `on_user_turn_completed_delay` | User message | Hook called | Hook returns | Nothing; it is all yours |
| `llm_node_ttft` | Assistant message | LLM generation start | First token | Preemptive head start |
| `llm_node_ttfs` | Assistant message | LLM generation start | First sentence sent to TTS | Custom `tts_node` (not reported) |
| `llm_node_tps` | Assistant message | First text chunk | Last text chunk | Single-chunk replies |
| `tts_node_ttfb` | Assistant message | Text first sent to provider | First audio chunk | Tokenizer buffering, if custom node |
| `e2e_latency` | Assistant message | Back-dated VAD end of speech | First frame pushed to track | Both network legs, jitter buffer, playout |
| `EOUMetrics.end_of_utterance_delay` | Session event | Same as `end_of_turn_delay` | Same | Writes 0 when the anchor is invalid |
| `LLMMetrics.ttft` | Per-plugin event | Request start | First token | Returns -1 when no tokens |
| `TTSMetrics.ttfb` | Per-plugin event | Text sent | First audio | Returns -1 when no audio |
Three ways the numbers lie
Sentinels and zeros pull averages down. In 1.8.4, `_compute_end_of_turn_metrics` returns `None` when the "stopped speaking" anchor predates the turn's start. That guard exists because of issue #6093, where stale anchors produced 200-second delays. But the `EOUMetrics` event is built with `end_of_turn_delay or 0.0`, and the OpenTelemetry span uses `or 0` too. A turn the framework could not measure becomes a perfect 0 ms turn on any dashboard built on those surfaces. `LLMMetrics.ttft` and `TTSMetrics.ttfb` use -1 for "nothing generated." Average those naively and your mean improves when things break.
Preemptive generation breaks the sum. LiveKit's docs approximate total latency as `eou.end_of_utterance_delay + llm.ttft + tts.ttfb`. That holds only when the LLM starts after the turn commits. Preemptive generation, which is on by default in 1.8.4, starts the LLM earlier. Then `llm_node_ttft` overlaps the end-of-turn wait, and the sum overstates the real gap.
Missing turns hide the worst turns. A user turn that never produced agent audio (interrupted, skipped, or blocked by `min_words`) gets no `e2e_latency`. If your slowest turns are the ones where callers gave up and spoke again, they vanish from the percentile.
The reconciliation check: residual against e2e_latency
Here is an original diagnostic that uses only fields LiveKit already records. For each turn, compute:
`residual = e2e_latency - (end_of_turn_delay + on_user_turn_completed_delay + llm_node_ttfs + tts_node_ttfb)`
Use `llm_node_ttft` in place of `llm_node_ttfs` when the latter is absent. Read the sign:
- Residual near zero (within about 50 ms): the waterfall is complete. Fix the biggest component.
- Residual strongly negative: preemptive generation is working. The magnitude is roughly the head start it bought you. A turn with a large negative residual and a short `end_of_turn_delay` is preemption done right.
- Residual strongly positive: time is being lost between stages. The usual suspects are a tool call (the first LLM pass returned a function call, so speech waited for the tool plus a second LLM pass), speech scheduling behind an uninterruptible utterance, or a blocked event loop.
The positive case is the one teams miss. In the 3-4 s community thread above, the poster's component metrics summed to under a second. A residual computed per turn would have shown immediately whether the gap was inside the agent (positive residual) or outside it (residual near zero, but callers still waiting). The most specific reply in that thread pointed downstream of the agent, at client playout, though the poster never confirmed a root cause.
Code: per-turn waterfalls with p50 and p95
The collector below writes one JSON line per answered user turn, pairing each user message with the assistant message that answered it. It uses `conversation_item_added` and `ChatMessage.metrics`, which are not deprecated. It is illustrative and targets `livekit-agents` 1.8.x; adapt the plumbing to your entrypoint.
# latency_waterfall.py - illustrative, livekit-agents 1.8.x
import json
from livekit.agents import AgentSession, ConversationItemAddedEvent
from livekit.agents.llm import ChatMessage

USER_FIELDS = ("transcription_delay", "end_of_turn_delay", "on_user_turn_completed_delay")
AGENT_FIELDS = ("llm_node_ttft", "llm_node_ttfs", "llm_node_tps",
                "tts_node_ttfb", "playback_latency", "e2e_latency")

def attach_waterfall_logger(session: AgentSession, call_id: str, path: str) -> None:
    state = {"user": None, "turn": 0, "unanswered": 0}
    out = open(path, "a", buffering=1)

    @session.on("conversation_item_added")
    def _on_item(ev: ConversationItemAddedEvent) -> None:
        item = ev.item
        if not isinstance(item, ChatMessage):
            return
        m = dict(item.metrics or {})
        if item.role == "user":
            if state["user"] is not None:
                state["unanswered"] += 1      # caller spoke again before a reply
            state["user"] = {k: m.get(k) for k in USER_FIELDS}
            return
        if item.role != "assistant" or state["user"] is None:
            return                             # greeting or say(): no user turn
        state["turn"] += 1
        row = {"call_id": call_id, "turn": state["turn"],
               "unanswered_before": state["unanswered"],
               **state["user"], **{k: m.get(k) for k in AGENT_FIELDS}}
        out.write(json.dumps(row) + "\n")
        state["user"], state["unanswered"] = None, 0
Per-plugin LLM events add two signals the per-turn report lacks: cache hits and cancelled generations. `LLMMetrics` carries `prompt_tokens`, `prompt_cached_tokens` and a `cancelled` flag. Discarded preemptive generations show up as cancelled requests, which is how you measure what preemption costs.
# attach to the LLM instance you construct, e.g. llm = openai.LLM(...)
def attach_llm_logger(llm, call_id: str, path: str) -> None:
    out = open(path, "a", buffering=1)
    def _on_metrics(m) -> None:                # m is an LLMMetrics
        out.write(json.dumps({
            "call_id": call_id, "speech_id": m.speech_id, "ttft": m.ttft,
            "cancelled": m.cancelled, "prompt_tokens": m.prompt_tokens,
            "cached": m.prompt_cached_tokens}) + "\n")
    llm.on("metrics_collected", _on_metrics)
Then aggregate offline. The script drops `None`, zeros and sentinels from percentiles but counts them, because coverage is a metric in its own right.
# waterfall_report.py - illustrative
import json, numpy as np

rows = [json.loads(l) for l in open("turns.jsonl")]
STAGES = ["end_of_turn_delay", "on_user_turn_completed_delay",
          "llm_node_ttfs", "tts_node_ttfb", "e2e_latency"]
MAX_DELAY = 2.5   # your endpointing max_delay

def clean(vals):
    return np.array([v for v in vals if isinstance(v, (int, float)) and v > 0])

for s in STAGES:
    raw = [r.get(s) for r in rows]
    v = clean(raw)
    cov = len(v) / max(len(raw), 1)
    if len(v):
        p50, p95 = np.percentile(v, [50, 95]) * 1000
        print(f"{s:30s} p50={p50:6.0f} ms  p95={p95:6.0f} ms  coverage={cov:.1%}")

eot = clean([r.get("end_of_turn_delay") for r in rows])
print(f"max-delay rate: {(eot >= 0.8 * MAX_DELAY).mean():.1%}")

resid = []
for r in rows:
    first = r.get("llm_node_ttfs") or r.get("llm_node_ttft")
    parts = [r.get("end_of_turn_delay"), r.get("on_user_turn_completed_delay") or 0,
             first, r.get("tts_node_ttfb")]
    if r.get("e2e_latency") and all(isinstance(p, (int, float)) for p in parts):
        resid.append(r["e2e_latency"] - sum(parts))
resid = np.array(resid) * 1000
print("residual ms p05/p50/p95:", np.percentile(resid, [5, 50, 95]).round())
print("turns > 4 s:", (clean([r.get("e2e_latency") for r in rows]) > 4).mean())
The max-delay rate deserves its own alert. End-of-turn delays are bimodal: they cluster near `min_delay` when the detector is confident and near `max_delay` when it is not. A healthy p50 can sit on top of a p95 made entirely of "detector unsure" turns.
Measure true end to end from the caller side
`e2e_latency` stops when a frame is pushed to the track. Callers start listening for it much later. To measure what they hear, you need audio from beyond the agent.
The cleanest method is a triangulation across three vantage points:
1. Agent metrics. `e2e_latency` per turn, from the collector above.
2. SFU-side recording. A LiveKit Egress track recording captures audio as the room sees it, after the agent has published and before the SIP bridge and carrier.
3. Far-end recording. A recording made at the caller's handset, or at the carrier on a two-channel (stereo) call recording, with caller and agent on separate channels.
Measure the gap from the end of caller speech to the onset of agent speech in recordings 2 and 3, then subtract. Recording 2 minus agent metrics is the agent-to-room cost. Recording 3 minus recording 2 is the SIP bridge, carrier, jitter buffer and playout.
That is exactly the method the reporter of GitHub issue #3685 used informally: comparing an Egress recording against a microphone recording on the phone. The response gap was far larger on the phone side, which pointed at the telephony leg, not the pipeline. A LiveKit team member replied in the thread that the LiveKit-to-Twilio leg "should be around 100-150 ms," with the rest from Twilio to the end user over the PSTN.
For onset detection, use hysteresis rather than a single energy threshold, and require a minimum duration so a click or a breath does not count as speech. This sketch returns per-turn gaps you can line up with the collector's rows by order.
# turn_gaps.py - illustrative onset detection with hysteresis
import numpy as np, soundfile as sf

def active(ch, sr, on=0.03, off=0.015, min_ms=120, hop_ms=10):
    hop = int(sr * hop_ms / 1000)
    n = len(ch) // hop
    rms = np.sqrt((ch[: n * hop].reshape(n, hop) ** 2).mean(axis=1))
    state, run, out = False, 0, np.zeros(n, bool)
    for i, e in enumerate(rms):
        if not state and e > on:
            run += 1
            if run * hop_ms >= min_ms:
                state, run = True, 0
                out[max(0, i - min_ms // hop_ms + 1) : i + 1] = True
        elif state and e < off:
            state = False
        else:
            run = 0 if not state else run
        out[i] |= state
    return out

audio, sr = sf.read("call_stereo.wav")      # ch0 caller, ch1 agent
caller, agent = active(audio[:, 0], sr), active(audio[:, 1], sr)
gaps, i = [], 1
while i < len(caller):
    if caller[i - 1] and not caller[i]:      # caller just stopped
        j = i
        while j < len(agent) and not agent[j] and not caller[j]:
            j += 1
        if j < len(agent) and agent[j]:
            gaps.append((j - i) * 10)        # ms of silence the caller heard
        i = j
    i += 1
print("caller-heard gap p50/p95 ms:", np.percentile(gaps, [50, 95]))
Two cautions. Mid-sentence pauses longer than your endpointing will register as false turn ends, so set `min_ms` and review a sample by ear. And on a carrier recording the agent channel already includes the downlink, but the caller channel has not yet crossed the uplink, so the measured gap understates what the caller heard by roughly one uplink leg. Note which recording you used whenever you report a number.
Region placement and RTT math
Distance is the latency you cannot tune away with settings. LiveKit's own latency guide ranks agent-model co-location as the highest-impact fix.
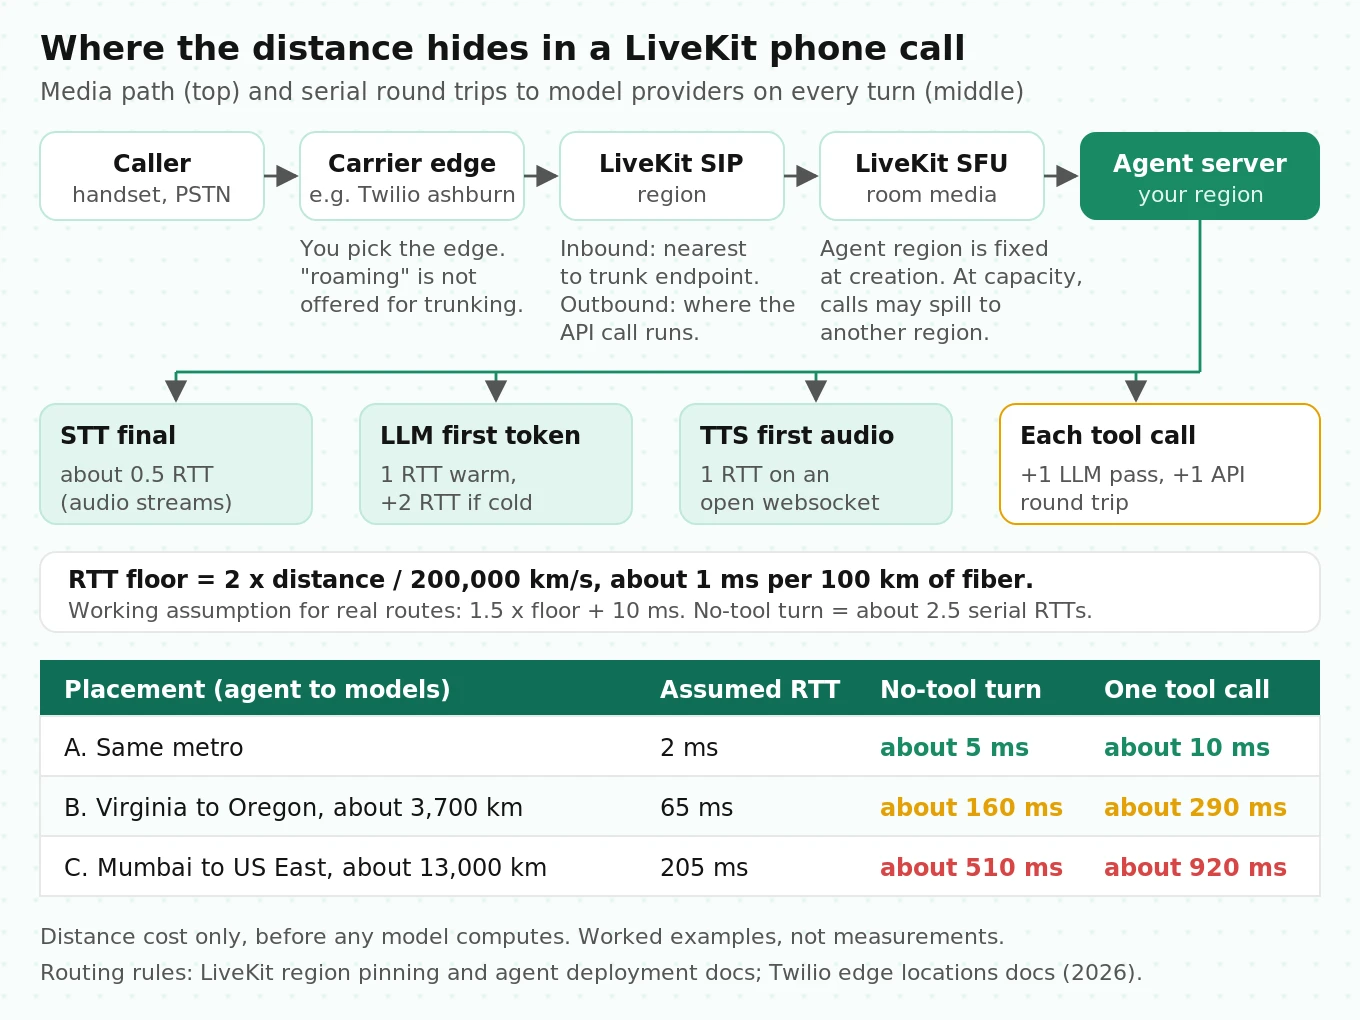
The physics floor is simple. Light in fiber covers about 200,000 km per second, so the minimum round-trip time is:
`RTT_min (ms) = 2 x distance_km / 200` which is about 1 ms per 100 km.
Real routes run longer than the great-circle line. As a working assumption, take 1.5 times the floor plus 10 ms. Then count how many serial round trips a turn makes to each remote party. On warm connections:
| Remote call | Serial round trips per turn | Note |
|---|---|---|
| Streaming STT final | About 0.5 | Audio streams continuously; the final travels one way |
| Cloud turn detector inference | About 1 | Only if the model runs remotely |
| LLM request to first token | 1 | Plus 2 more if the connection is cold (TCP and TLS 1.3) |
| TTS text to first audio | 1 | Websocket already open |
| Each tool call | 1 LLM + 1 API | The extra LLM pass that speaks the tool result |
Now plug in three placements. All numbers are worked examples, not measurements.
- A. Co-located. Agent and model endpoints in one metro, RTT about 2 ms. A no-tool turn spends under 10 ms on distance.
- B. Agent in Virginia, LLM and TTS endpoints in Oregon. About 3,700 km, floor 37 ms, assumed real RTT 65 ms. A no-tool turn pays about 2.5 RTTs (STT, LLM, TTS), around 160 ms. One tool call adds about two more RTTs (the second LLM pass and the API call, if the API is equally far), for roughly 290 ms of pure distance.
- C. Agent in Mumbai, models in US East. About 13,000 km, floor 130 ms, assumed real RTT 205 ms. A no-tool turn pays around 510 ms in distance alone, before any model computes anything. One tool call pushes that past 900 ms.
LiveKit placement rules that surprise people
- Inbound SIP enters near your trunk, not your caller. The region pinning docs say incoming calls route "to the region closest to the SIP trunking provider's endpoint." With Twilio, that endpoint is the edge you configure. Twilio's edge list offers `ashburn`, `umatilla` and others, and states that the `roaming` low-latency edge "isn't available for SIP Domains or Elastic SIP Trunking." You pick the edge, so you pick the path.
- Outbound calls start where your API call runs. The same page: "Outgoing calls originate from the same region where the `CreateSIPParticipant` API call is made." A backend in Europe dialing US numbers sends media through Europe unless you set `destination_country` on the trunk. The issue #3685 thread shows this pattern: calls routed through one region while the carrier used another.
- Agent regions are fixed and can spill. The agent deployment docs say a deployment's region "can't be changed after creation," and that if agents are at capacity, "users may connect to an agent in a different region." A capacity shortfall shows up as a latency tail, not an error.
- Region-pinned SIP endpoints exist. The format is `{sip_subdomain}.{region}.sip.livekit.cloud`, with regions `aus`, `eu`, `india`, `japan`, `sa`, `uk` and `us`.
For context on the phone leg itself, ITU-T G.114 treats 0 to 150 ms of one-way transmission delay as acceptable for most voice applications and 400 ms as the planning limit. Two network legs at 150 ms each already consume 300 ms. Human conversation leaves little room for that: Stivers et al. (PNAS, 2009) found that in all 10 languages studied, the most common turn transition fell between 0 and 200 ms. Our SIP vs WebRTC guide and telephony comparison go deeper on the transport side.
A worked waterfall with p50 and p95 budgets
Here is a budget for a US inbound phone agent with co-located models. Every number is an illustrative target, not a measurement. Replace each with your own percentiles from the report script.
| Segment | Metric | p50 budget (ms) | p95 budget (ms) | Usually blown by |
|---|---|---|---|---|
| Uplink: handset, carrier, SIP, SFU | Recording only | 90 | 160 | Wrong trunk edge, cross-region media |
| End-of-turn wait (includes VAD and STT final) | `end_of_turn_delay` | 420 | 1,250 | Detector unsure, so `max_delay` wins |
| Your hook | `on_user_turn_completed_delay` | 15 | 120 | Synchronous RAG or database call |
| LLM to first sentence | `llm_node_ttfs` | 450 | 1,100 | Long prompt, cache miss, tool call |
| TTS first audio | `tts_node_ttfb` | 160 | 380 | Cold websocket, provider region |
| Scheduling residual | Computed | 20 | 90 | Event-loop stalls |
| Downlink, jitter buffer, playout | Recording only | 110 | 200 | Carrier routing, client playout |
| Agent-side `e2e_latency` | Sum of rows 2 to 6 | 1,065 | see below | |
| Caller-heard | Recording | 1,265 | see below |
At the median the arithmetic is clean: 420 + 15 + 450 + 160 + 20 = 1,065 ms agent-side, plus 200 ms of network for 1,265 ms caller-heard.
At p95 it is not. Summing the p95 column gives 3,300 ms caller-heard, but that number describes a turn where every stage hits its tail at once, which almost never happens. Do not budget p95 by summing p95s. Budget the p95 of the total directly, and use the per-stage p95s to find which stage owns the tail.
Dean and Barroso's "The Tail at Scale" (CACM, 2013) explains why the tail still matters so much. Their example: a server that is slow 1% of the time makes 63% of requests slow once a request touches 100 such servers. A voice turn is a short serial chain, not a 100-way fan-out, but the same arithmetic applies. If each of five stages independently lands in its own slowest 5% on a given turn, the chance a turn hits at least one tail is:
`1 - 0.95^5 = 22.6%`
Nearly one turn in four contains at least one stage tail. In practice that means the p95 turn is usually one stage misbehaving, not all of them. Your waterfall should tell you which one.
The same paper offers a fix that maps directly onto voice: hedged requests. Send a backup request only after the first has been outstanding longer than its p95, and cancel the loser. In their BigTable benchmark, hedging after 10 ms cut 99.9th-percentile latency from 1,800 ms to 74 ms with 2% more requests. LiveKit's `FallbackAdapter` is a simpler cousin: its `attempt_timeout` defaults to 5.0 s, which is too slow for a conversational turn.
Fixes by segment
Endpointing and the turn detector
If `end_of_turn_delay` dominates and the max-delay rate is high, the detector is unsure. Short replies like "yes" and "okay" are the classic case. In a community thread on Agents 1.6.4, every short reply showed `eou_delay = 1.00s`, exactly the configured `max_delay`. The poster reported that switching to `dynamic` endpointing worked better for short utterances.
Dynamic mode adapts the wait using an exponential moving average of the caller's pauses (`alpha` defaults to 0.9). You can also update endpointing at runtime for a known yes/no stretch of the conversation. Do not just crush `max_delay`. LiveKit's short-utterances guide warns that overly aggressive endpointing ends turns early and can attach a final transcript to the wrong turn. Our endpointing comparison covers the trade-off in detail.
Preemptive generation, and the RAG pattern that silently disables it
In 1.8.4, `PreemptiveGenerationOptions` defaults to `enabled: True`, `preemptive_tts: False`, `max_speech_duration: 10.0` and `max_retries: 3`. It fires on each new final or preflight transcript, before the turn is committed, and skips utterances longer than 10 seconds.
Here is the gotcha that is not in the docs. When the turn commits, the framework reuses the preemptive reply only if the transcript, the chat context, the tools and the tool choice are all unchanged after `on_user_turn_completed` runs. The standard RAG pattern adds retrieved context to the turn's chat context inside that hook. That changes the chat context, so every preemptive generation is thrown away. You pay full LLM latency plus the wasted tokens. The framework logs this at warning level. Grep for the stable prefix, because the full message wraps the hook name in backticks:
`preemptive generation invalidated after`
The full warning ends "because the transcript, chat context, tools, or tool choice changed."
When reuse works, the framework logs `using preemptive generation` at debug level with a `preemptive_lead_time` field. Count both lines per session and you have a preemptive hit rate. To keep RAG and preemption together, retrieve during the user's speech (keyed on the interim or preflight transcript) and put the results somewhere that does not mutate the turn context at commit time, or accept the trade-off consciously.
Research shows what a good speculative system buys. Udupa et al. (Interspeech 2026) built a model that forecasts the end of turn up to 2.56 s ahead and starts the LLM and TTS speculatively. Integrated into the Unmute framework, it cut average latency by 505 ms at the cost of 28.4% more speculative computation. That is the right frame for LiveKit too: track latency saved and tokens wasted together, using the negative residual and the `cancelled` flag on `LLMMetrics`.
LLM time to first token and first sentence
TTFT grows with prompt length because the model must process every input token before emitting one. Two levers matter most in voice:
- Keep the prefix cacheable. OpenAI's prompt caching docs say cache reuse "requires the entire rendered prefix to match," with a 1,024-token minimum for GPT-5.6 and later. Put static instructions and tool definitions first. Put the caller's name, today's date and per-call variables last. Watch `prompt_cached_tokens / prompt_tokens` from `LLMMetrics`; a ratio near zero on turn three means something at the top of your prompt changes every request.
- Count tool steps. Each tool call means a second LLM pass before speech. LiveKit's guide recommends limiting `max_tool_steps` and playing a thinking sound. Our post on agents that go silent covers what callers do during that silence.
Then check the retry defaults, because they shape your p99. `APIConnectOptions` defaults to `max_retry=3`, `retry_interval=2.0` and `timeout=10.0`. The first retry waits 0.1 s, later ones 2.0 s. A provider that hangs on connect can hold a turn for tens of seconds before the session sees an error. The OpenAI plugin's HTTP client separately uses a 15 s connect timeout and a 5 s read timeout. For a conversation, set tighter values through `SessionConnectOptions(llm_conn_options=...)` and fail over to a second model faster.
TTS streaming and sentence chunking
`llm_node_ttfs` exists because the first audio cannot start until a first sentence reaches the TTS. LiveKit's default blingfire sentence tokenizer uses `min_sentence_len=20`: spans shorter than 20 characters merge into the next sentence. So a reply that opens with "Sure!" does not ship "Sure!" early. It waits for the next sentence to finish. A first clause of 20 to 60 characters ships fastest. You can steer that with one line in your prompt.
Plugin choices change this too:
- Non-streaming TTS runs through `StreamAdapter`, which synthesizes one whole sentence at a time, so its first-byte time includes synthesizing that full sentence. In one community thread, a poster stuck at 3 seconds per turn reported about 1 second after switching TTS providers, while one other TTS model stayed at three seconds. The thread does not pin down the cause, but provider choice was the variable that moved.
- ElevenLabs: the plugin uses `auto_mode` with a sentence tokenizer by default. Passing `chunk_length_schedule` turns `auto_mode` off, and the provider then buffers text per that schedule before generating. The plugin documents `[120, 160, 250, 290]` characters as the schedule's defaults, so the first audio waits for about 120 characters of LLM output.
- Custom `tts_node`: `tts_node_ttfb` falls back to timing from the first input token, so tokenizer buffering is counted as TTFB and `llm_node_ttfs` is not reported.
See our low-latency TTS guide and time to first audio explainer for provider-side detail.
Cold starts and prewarm
The first turn of a call pays costs later turns do not. In 1.8.4, `AgentServer` keeps `num_idle_processes` warm: 0 in dev mode, `ceil(cpu_count)` in production. Load VAD weights in a setup function (`server.setup_fnc = prewarm`) so jobs do not load them on pickup. The LLM's `prewarm()` resolves DNS and opens the TLS connection, and the source says it "is called automatically when an `AgentSession` is constructed and when an agent activity starts." LiveKit's guide adds that Build-plan projects get several-second cold starts once all sessions end. Report first-turn latency separately so it does not pollute steady-state percentiles.
Event-loop stalls
A voice pipeline runs VAD, playout and every provider stream on one asyncio loop. Any synchronous call, such as a blocking HTTP client inside a tool, stalls all of them. Version 1.8.4 ships a loop monitor that logs `event loop blocked for {N}ms` at a 100 ms warning threshold and 500 ms error threshold. You can change them with `LIVEKIT_AGENTS_LOOP_BLOCK_WARN_MS` and `LIVEKIT_AGENTS_LOOP_BLOCK_ERROR_MS`. The session span carries `lk.blocking.count`, `lk.blocking.total_duration` and `lk.blocking.max_duration`, and each stall span includes a sampled stack. If `lk.blocking.cpu_time` is near zero, the process was not running at all, which points at CPU quotas or burstable instances rather than your code. Load-dependent stalls show up only under concurrency, so pair this with stress testing.
Symptom to segment to fix: a LiveKit latency runbook
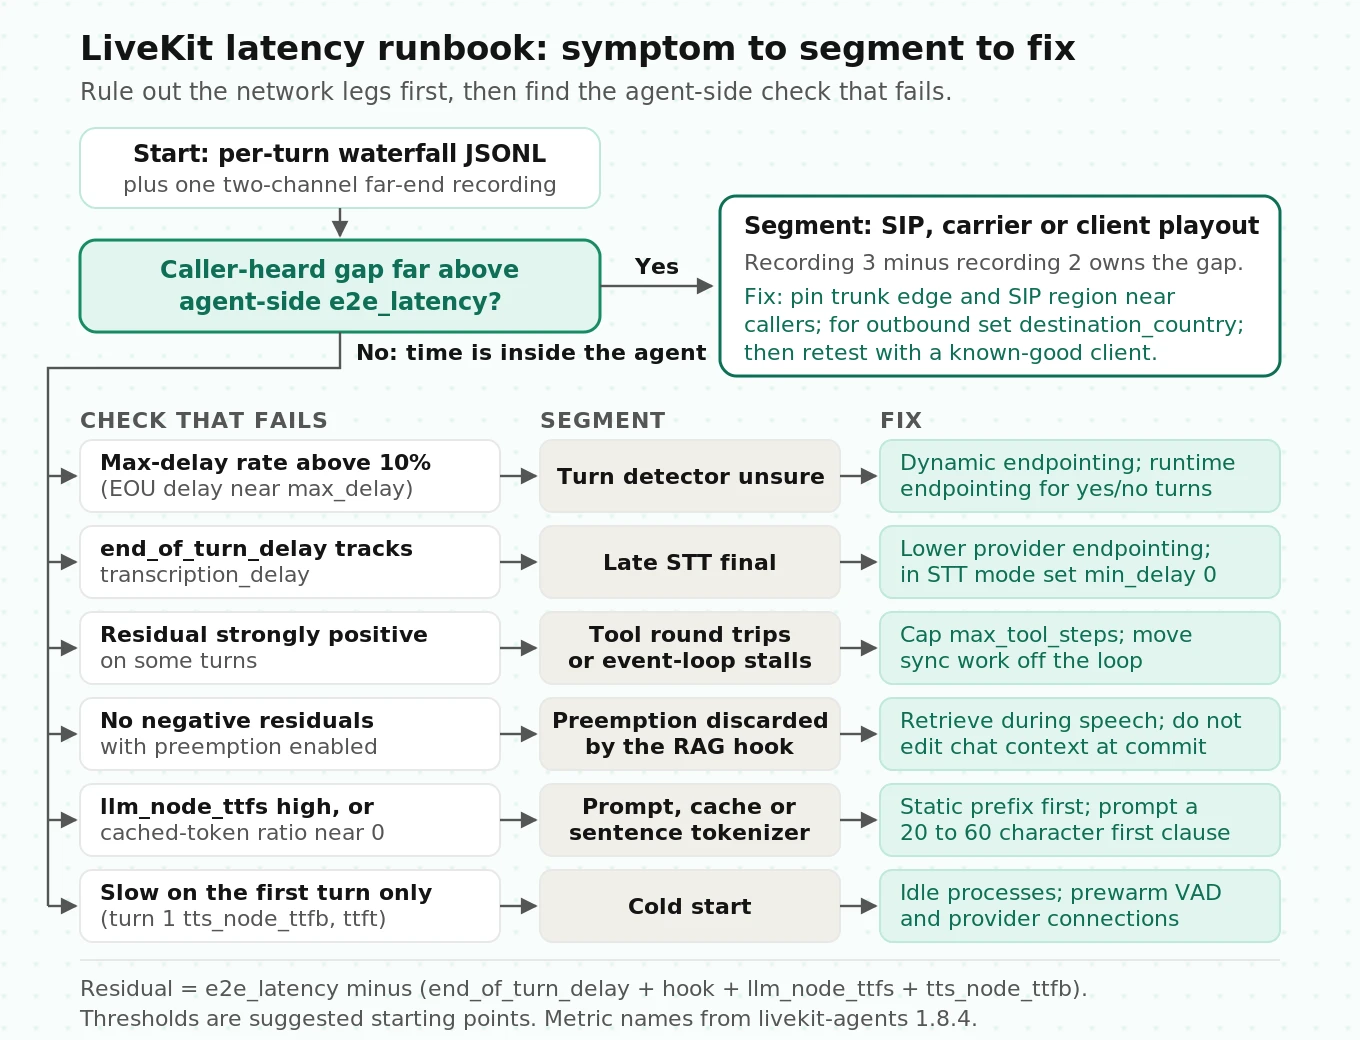
| Symptom | Check first | Likely segment | Fix |
|---|---|---|---|
| Fast in browser, slow on phone | Recording 3 minus recording 2 | SIP and PSTN legs | Pin trunk edge and LiveKit SIP region near callers; set `destination_country` for outbound |
| Metrics sum under 1 s, callers wait 3 s | Residual near zero, recordings | Downlink or client playout | Test with a known-good client; inspect custom player buffering |
| Short replies wait exactly `max_delay` | Max-delay rate | Turn detector unsure | Dynamic endpointing; runtime endpointing for yes/no prompts |
| `end_of_turn_delay` never below about 0.5 s | `transcription_delay` | STT final arrives late | Lower provider endpointing; in STT mode set `min_delay` to 0 |
| Strongly positive residual on some turns | Tool calls per turn | Tool round trips | Cap `max_tool_steps`; consolidate APIs; thinking sound |
| No negative residuals at all | Grep "preemptive generation invalidated" | Preemption discarded | Move RAG out of the chat-context mutation in the hook |
| `llm_node_ttft` creeps up over a call | `prompt_cached_tokens` ratio | Prompt growth, cache miss | Static prefix first; trim or summarize history |
| `llm_node_ttfs` far above `llm_node_ttft` | First sentence length | Sentence tokenizer | Prompt a 20 to 60 character opening clause |
| High `tts_node_ttfb` on first turn only | Turn index | Cold connection | Rely on prewarm; keep a session-level TTS instance |
| Random 1 to 10 s spikes | `event loop blocked` logs, retry logs | Loop stall or provider retry | Move sync work off-loop; tighten `SessionConnectOptions` |
| Latency rises with call volume | p95 by concurrency | CPU or region spill | Compute-optimized instances; capacity per region |
| First turn of every call slow | First-turn p50 | Process or model cold start | Idle processes; prewarm VAD; paid plan |
How to test LiveKit latency before every release
A latency fix that is not measured the same way twice is a guess. This protocol produces numbers you can compare across builds.
1. Pin the environment. Record the `livekit-agents` version, turn detector version, endpointing mode and values, preemptive options, model names and regions. A change to any of them is a new baseline. Our LLM update regression guide applies equally to framework upgrades.
2. Build a scripted turn set. Use at least 40 calls of 10 to 12 turns each, so 400 or more answered turns. Mix short replies ("yes", a ZIP code), long multi-clause requests, turns that trigger a tool, and turns that do not. Use synthetic callers so the same script runs every time.
3. Run each set under four conditions. WebRTC and SIP; single call and your target concurrency. Keep first turns in a separate bucket.
4. Collect three vantage points. The waterfall JSONL, an Egress recording, and a two-channel far-end recording for at least a subset of calls.
5. Compute the report. Per-stage p50 and p95, metric coverage, max-delay rate, residual distribution, preemptive hit rate, cancelled-token share, loop stalls, and caller-heard p50 and p95 from audio.
6. Apply pass thresholds. These are starting points we suggest, not an industry standard. Tune them to your use case.
| Check | Pass threshold |
|---|---|
| Agent-side `e2e_latency` p50 / p95 | 1,000 ms / 1,800 ms or better |
| Caller-heard p50 / p95 (SIP) | 1,300 ms / 2,200 ms or better |
| Turns above 4 s caller-heard | 1% or fewer |
| Metric coverage on answered turns | 97% or more |
| Max-delay rate | 10% or less |
| Preemptive hit rate (if enabled) | 60% or more |
| Loop stalls above 500 ms | 0 per 100 turns |
The 4-second line is anchored in research: Maslych et al. (CUI 2025) found that response latency above 4 seconds degraded quality of experience in conversations with LLM-powered agents, while natural conversational fillers improved perceived response time.
7. Size the sample for the tail. A p95 from 100 turns is close to noise. Using the binomial approximation, the rank of the true p95 falls within `n x 0.95 ± 1.96 x sqrt(n x 0.95 x 0.05)`. For n = 100 that is ranks 91 to 99, so your "p95" could be anywhere from the 91st to the 99th percentile. For n = 400 it is ranks 372 to 389, roughly the 93rd to the 97th percentile. Turns within one call are correlated, so spread them across many calls.
8. Compare builds on distributions. Bootstrap the difference in p95 between the old and new build (resample whole calls, 2,000 iterations) and ship only if the 95% interval excludes a regression larger than your tolerance, say 150 ms.
Where independent evaluation fits
Everything above works with your own tooling, and you should run it. The gap is coverage. Engineering teams test the paths they wrote, from the network they sit on, on the build they just changed. Caller-heard latency on real carrier routes, at production concurrency, across every prompt and model update, is the part that slips.
That is where Evalgent fits. We run independent, scripted test calls through your actual phone numbers and SIP trunks, score caller-heard latency per turn alongside conversational quality, and flag regressions between releases. Teams use it for a pre-launch audit, for comparing STT, LLM and TTS vendors on the same scripted calls, and as a release gate. It does not replace your LiveKit metrics. It tells you whether the number your callers experience matches the one in your logs. For what to capture on every call, see what to log on voice agent calls, and for the broader test plan, our LiveKit testing guide.
Frequently asked questions
Why do LiveKit metrics say 900 ms when callers hear 2 seconds?
`e2e_latency` runs from the back-dated end of user speech to the moment the agent pushes its first audio frame to the room. It never sees the uplink, the downlink, the SIP bridge, the carrier, the jitter buffer or the handset. Measure from a far-end recording and subtract to find the gap.
What does end_of_turn_delay include?
It runs from the back-dated VAD end of speech to the moment the turn commits. That window already contains the VAD silence, the wait for the STT final transcript and the endpointing delay. Those overlap rather than add, so it behaves roughly like the maximum of the three.
Why is my LiveKit EOU delay always exactly max_delay?
The turn detector judged the turn likely incomplete, so the session waited the full `max_delay`. Short replies like "yes" trigger this often. Try dynamic endpointing, update endpointing at runtime for yes/no stretches, and track the share of turns that hit 80% or more of `max_delay`.
Is preemptive generation on by default in LiveKit?
In `livekit-agents` 1.8.4, yes. `PreemptiveGenerationOptions` defaults to enabled for the LLM, with `preemptive_tts` off, a 10-second speech cap and three attempts per turn. It is discarded if `on_user_turn_completed` changes the transcript, chat context, tools or tool choice.
What is llm_node_ttfs in LiveKit?
It is the time from LLM generation start until the first sentence reaches the TTS provider, as segmented by that TTS. It appears in the 1.8.4 `MetricsReport` source alongside `llm_node_tps`. It captures sentence-tokenizer buffering that `llm_node_ttft` misses, and it is not reported with a custom `tts_node`.
Does LiveKit SIP add latency?
LiveKit's guide says SIP's impact is generally limited to round-trip time plus small jitter and transcoding allowances, unless routing adds distance. Inbound calls enter near your trunk provider's endpoint and outbound calls start where you call `CreateSIPParticipant`, so trunk edge and API region choices decide that distance.
How many test turns do I need to trust a p95?
At least 400 answered turns spread across 40 or more calls. With 400 samples the measured p95 sits roughly between the true 93rd and 97th percentiles. With 100 samples it could be anywhere from the 91st to the 99th, which is too wide to catch a regression.
Should I average LiveKit latency metrics?
No. Some surfaces record unmeasurable turns as 0 and failed generations as -1, which pulls averages down exactly when things break. Report p50 and p95, exclude sentinels from percentiles, and track metric coverage as its own number.
The bottom line
A LiveKit latency issue is almost always one segment, and you can find it by rebuilding each turn's waterfall from `ChatMessage.metrics`, checking the residual against `e2e_latency`, and comparing against what a recording says the caller heard. Fix the segment that owns your p95, then lock the result in with a fixed test protocol so the next prompt, model or framework upgrade cannot quietly undo it.
Related Articles
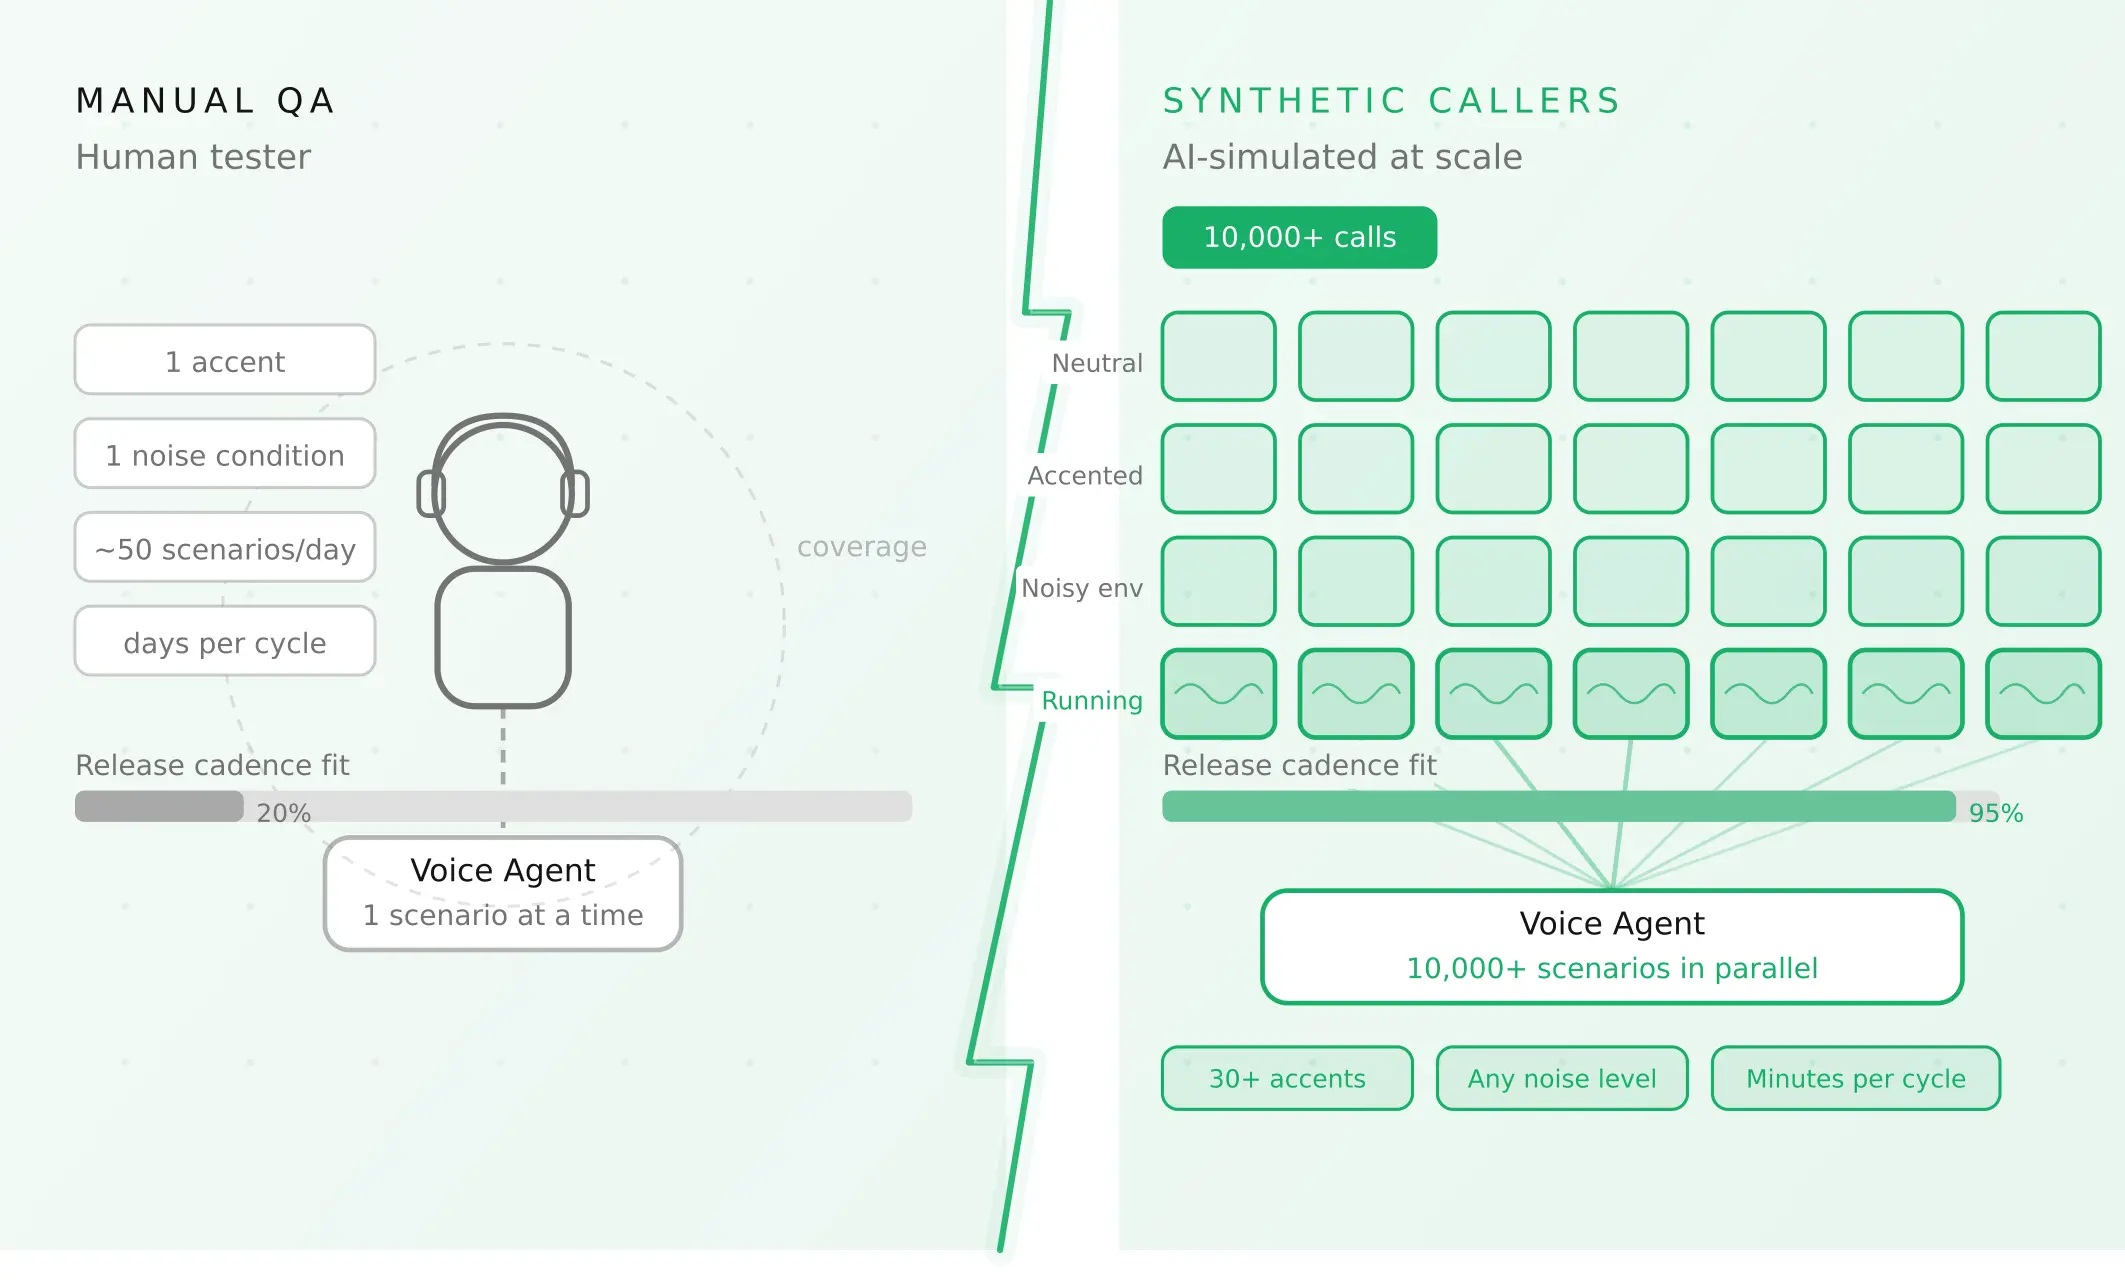
How to automate voice agent testing: synthetic callers vs manual QA
Learn how ai test automation replaces manual QA for voice agents. Compare synthetic callers vs human testers, with a 5-step framework to scale without hiring.
Read more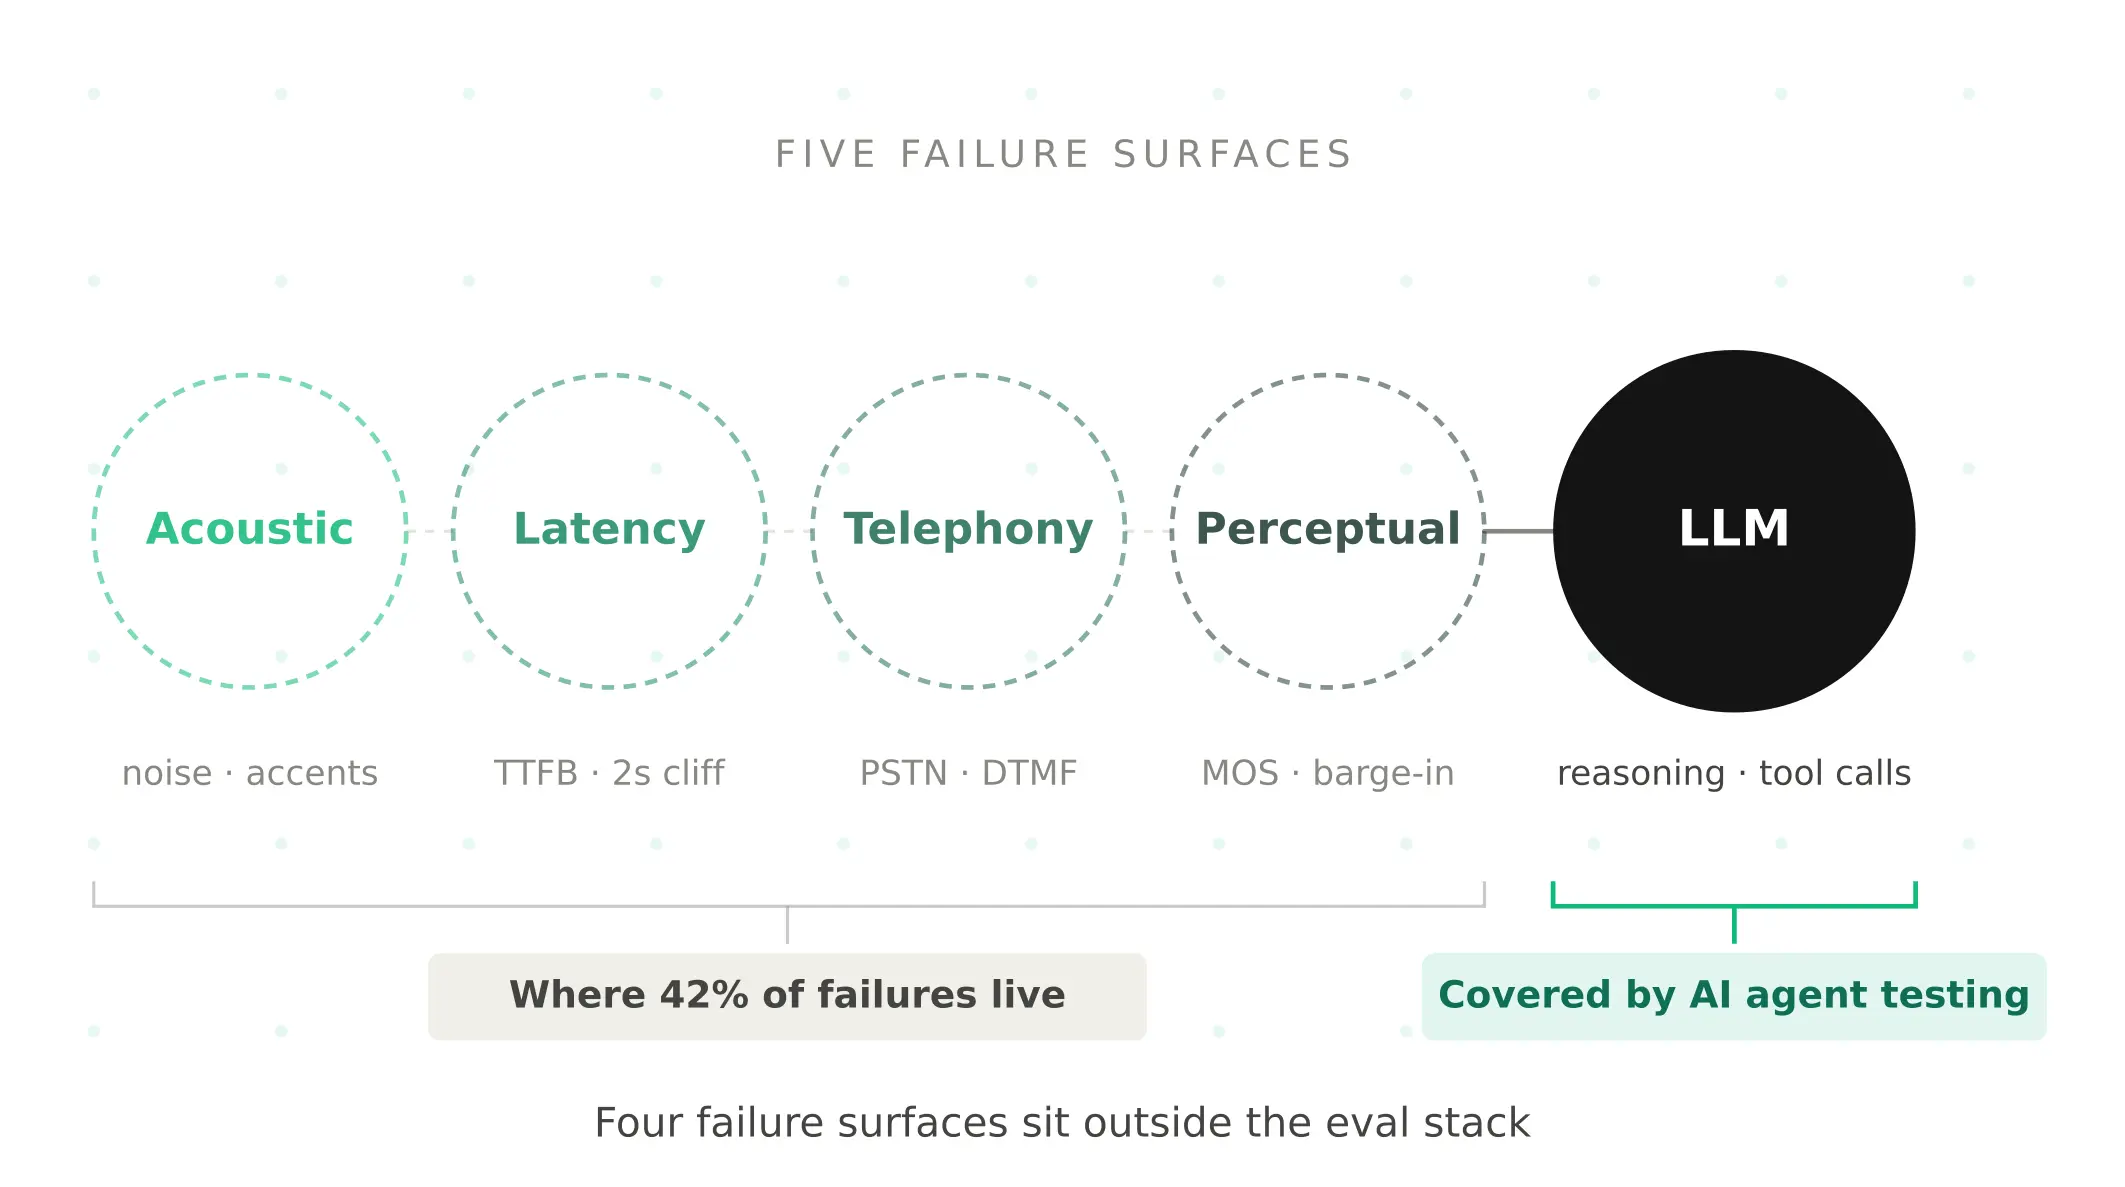
AI Agent Testing vs Voice Agent Testing: What General Tools Miss for Voice
AI agent testing measures text outputs. Voice agent testing measures behaviour through an acoustic pipeline. Five failure categories general tools miss.
Read more