Voice Agent Latency You Can Feel: Which Clock to Measure and Why a Good p99 Can Still Feel Slow
On this page
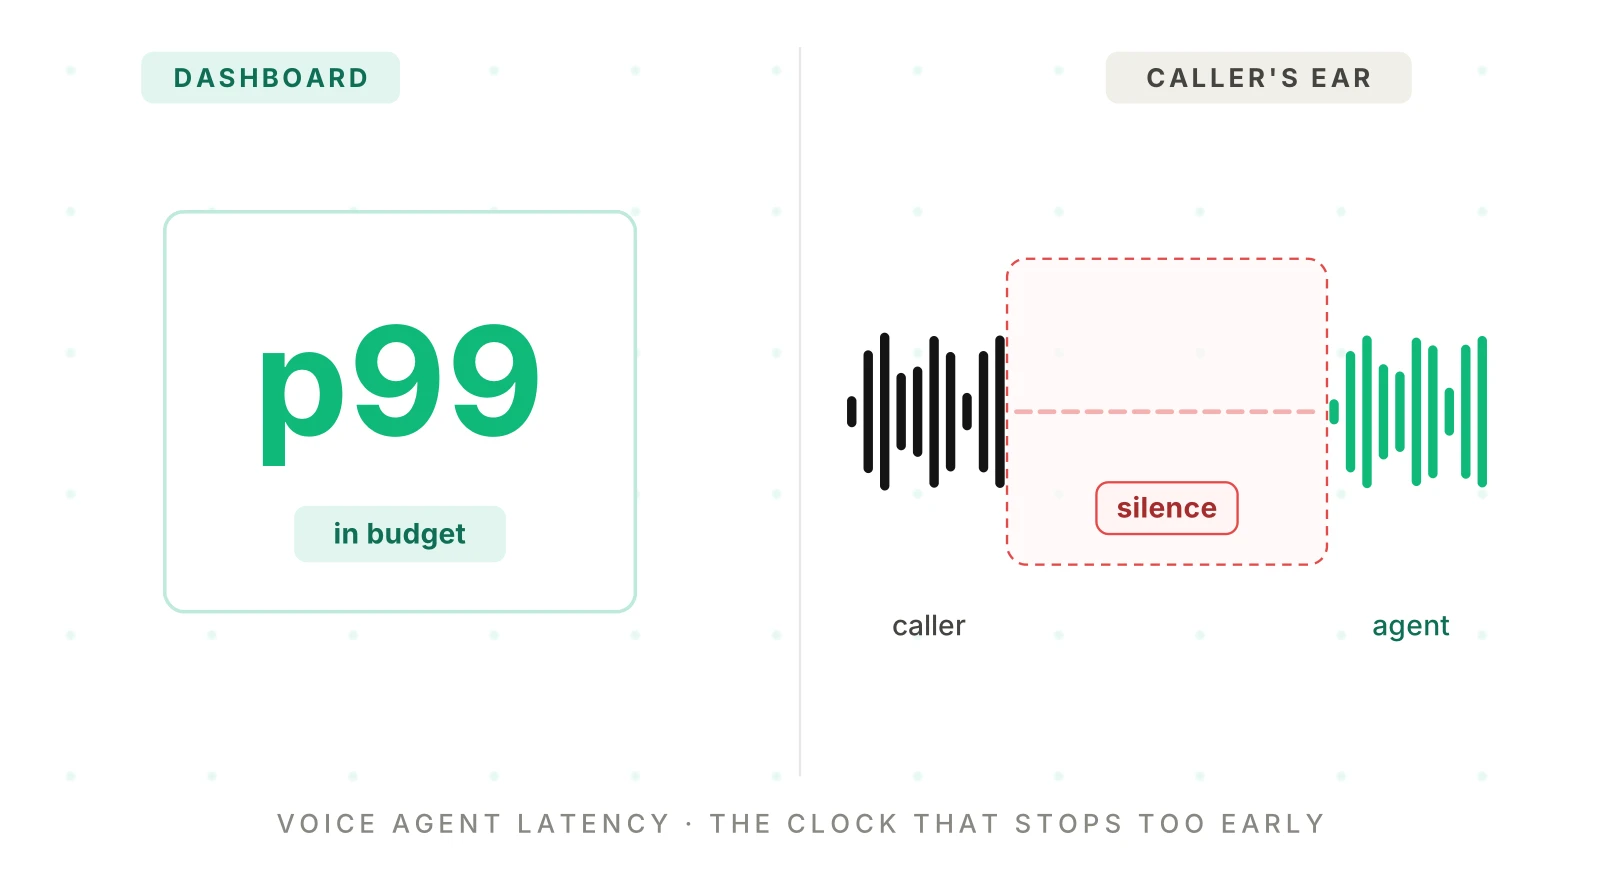
A team looks at its dashboard and sees a tight tail. The p99 is inside budget. Then a caller says the agent "takes forever." Both statements can be true, because the dashboard and the caller are timing different things.
This post is vendor-neutral. It defines each clock, shows where common tools start and stop theirs, and explains what p50, p95 and p99 can and cannot tell you. It ends with a perceived latency voice agent test plan. It gives no target, because we have no original benchmarks.
For framework internals, see measuring Pipecat latency and debugging LiveKit latency. For the money side, read the cost of latency. This post sits above them.
Why "voice agent latency" needs a definition
Ask five engineers "what is voice agent latency" and you get five clocks. One means the time to the first LLM token. One means TTS startup. One means the gap on a call recording.
Each answer fits its own purpose. None is "the" latency. So name the clock, the start line and the stop line.
Two rules keep the numbers honest.
Rule one: start every cumulative clock at the same place. Use the end of the caller's speech. The final transcript and the turn commit are events inside the agent. They happen after the caller has gone quiet.
Rule two: separate stage durations from cumulative marks. "LLM time to first token" is a stage duration. It starts when the request is sent. "End of speech to first token" is a cumulative mark. It includes the endpointing wait, the transcript and everything before the request. Mixing the two is the most common source of "the numbers add up to 900 ms but callers wait three seconds."
What the research and the AAIF post actually say
Two sources get cited in most latency posts. It is worth reading what each one says, and what it does not.
The AAIF measurement split
The Agentic AI Foundation, part of the Linux Foundation, published Where voice agents fail in production, part 1 on October 27, 2026. Its author is Steve Kearns. As of November 18, 2026, the post recommends splitting latency into six measurements:
| AAIF measurement | What it can reveal, per the post |
|---|---|
| End of speech to turn committed | Delay from endpointing and turn detection |
| End of speech to final transcript | Speech recognition finalization delay |
| Model request to first output | Initial model inference delay |
| Tool start to tool result | External dependency latency |
| Speech synthesis request to first audio | Synthesis startup delay |
| End of speech to playback begins | User-visible response-onset delay |
Note the shape. Three rows start at end of speech. Three start at a stage boundary. That is rule two in practice. The post also says average latency alone hides trade-offs, and it recommends tracking tail response times and attributing the slow interactions to individual stages. It does not name p50, p95 or p99, and it gives no target numbers.
Levinson and Torreira on turn gaps
The AAIF post cites a review of human turn-taking. The primary paper is Levinson and Torreira, "Timing in turn-taking and its implications for processing models of language," Frontiers in Psychology, 2015. What it reports:
- Gaps between turns average around 200 ms.
- The great proportion of turn transitions fall between -100 and 500 ms. Negative values are overlaps.
- Across the corpora they analyze, 51 to 55 percent of transitions happen in under 200 ms.
- Naming a single picture takes an estimated 600 ms. Describing a pictured scene with a sentence takes about 1,500 ms before speech starts, in laboratory tasks.
- Their conclusion is that listeners must predict the end of the current turn and start preparing a reply before it ends.
Two cautions. First, this is human-to-human conversation, not a service target. AAIF itself frames it as context. Second, the 1,500 ms figure comes from picture-description experiments. It is not a measure of conversational timing.
For agent work, the useful reading is narrower. People expect fast replies because other people start planning theirs early. A cascaded agent cannot plan during your sentence the same way. So it is, by construction, slower than the human norm, and the question is how much slower callers tolerate for your use case. Only your own tests can answer that.
The six clocks of voice agent latency
Here is the set we use. Every cumulative clock starts at T0, the last sample of caller speech. Clocks one, two and five come straight from the AAIF split. Clocks three and four restate AAIF's stage durations as cumulative marks. Clock six goes past AAIF and is the one callers experience.
| Clock | Start | Stop | Who usually reports it |
|---|---|---|---|
| 1. Turn committed | T0 | The agent decides the turn is over | Endpointing or turn detector logs |
| 2. Final transcript | T0 | Final STT text arrives | STT provider metrics |
| 3. First token | T0 | First token from the LLM | LLM metrics, plus the wait before the request |
| 4. First audio | T0 | First audio sample from TTS | TTS metrics, plus everything before |
| 5. Playback begins (agent edge) | T0 | Agent starts sending audio out | Framework observer |
| 6. Caller hears | T0 | Sound reaches the caller's ear | Only a far-end recording or handset |
Clock six is voice-to-voice latency in its strictest form. People use that phrase loosely, so say which end you mean. Voice-to-voice measured at the agent edge is clock five. Voice-to-voice measured at the caller is clock six.
Time to first audio has the same ambiguity. The TTS-stage version runs from request sent to first audio byte. That is a stage duration. If you want the caller-facing version, use end of speech to first audio, which is clock four. Our low-latency TTS post covers the stage version.
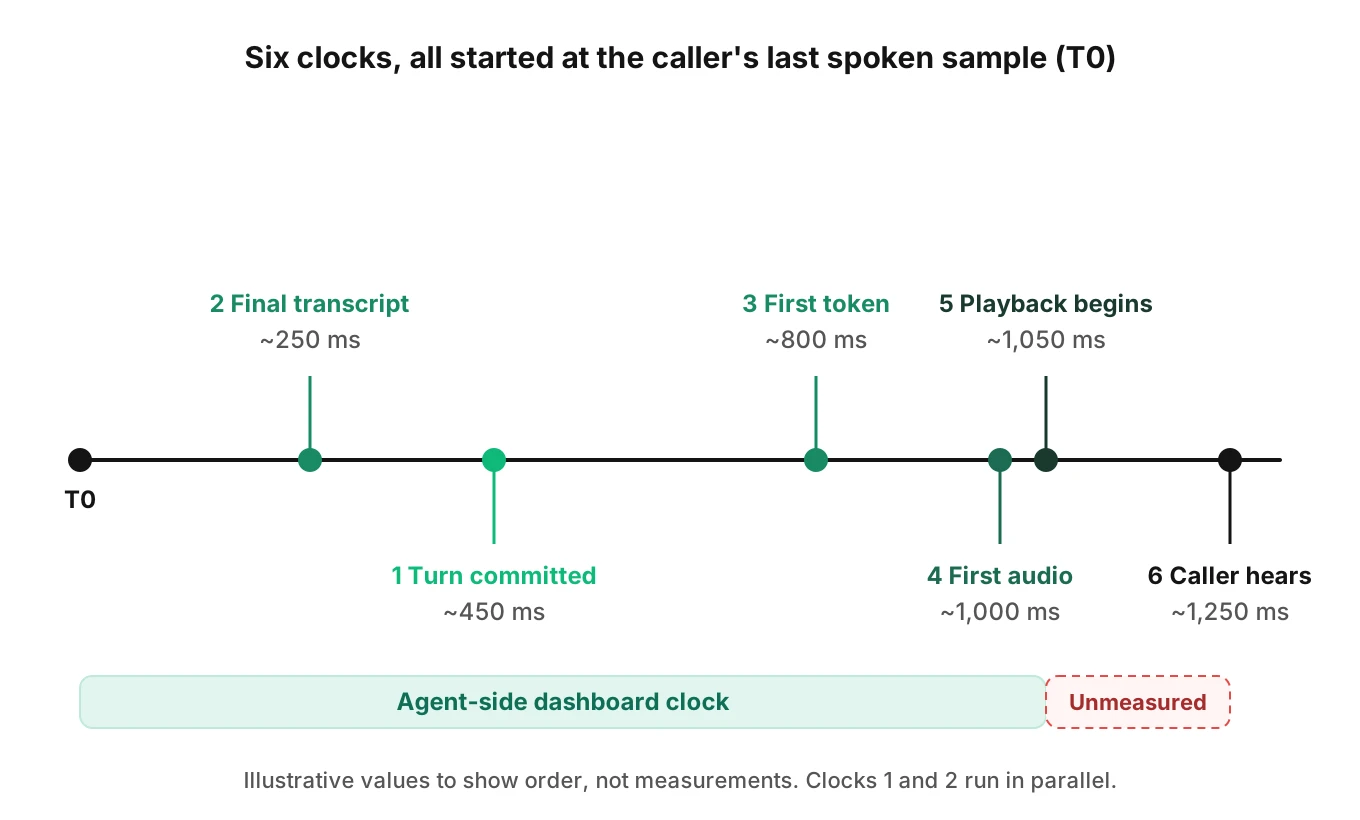
The timeline uses illustrative values. Order matters more than the numbers. Clocks one and two run in parallel, and either can finish first. Do not add the clocks together. Each one is already measured from T0.
Where common voice agent latency metrics start and stop
Check the definition in every tool you use. Two examples from current documentation, read on November 18, 2026:
- LiveKit Agents. In the Python metrics reference,
end_of_utterance_delayis "the amount of time between the end of speech from VAD and the decision to end the user's turn." That is clock one.transcription_delayis the time to obtain the transcript after the end of the user's speech. The LLM metricttftis time to first generated token. That one is a stage duration, measured from the request, so it is not clock three. - Pipecat. The UserBotLatencyObserver starts from
VADUserStoppedSpeakingFrame, accounting for the VADstop_secsdelay, and stops atBotStartedSpeakingFrame. That is clock five. Its breakdown splits the interval into named contributions that sum to the total.
Neither one reaches clock six. A per-turn waterfall sums the stages, yet a reply in a LiveKit community thread about a 3 to 4 second gap puts it plainly: the metrics stop at the agent's push_frame, and client receive and playout sit downstream. The thread records no confirmed root cause. The lesson is general. An agent-side clock cannot see the network, the buffer or the handset.
If you run Twilio Media Streams, the mark message gives a partial view of the far end. Per Twilio's WebSocket message docs, Twilio sends the mark back when the media message before it has finished playing. That is a playback-complete signal. For a first audio chunk it overstates the onset by the chunk's duration. Use it as an upper bound, not as clock six.
p50, p95 and p99: what each one tells you
This is tail latency reporting. A p95 latency voice agent number only helps if you know what it summarizes.
A percentile answers one question: what share of turns finished at or under this value? Read them like this.
- p50 is the typical turn. It is the closest number to what a caller feels most of the time. If your p50 is slow, every call feels slow.
- p95 is the bad turn you hit in a longer call. One in twenty turns is slower than this.
- p99 is the rare turn. One in a hundred is slower. It is the right number for an alert and a weak number for the caller's overall impression.
The p95 vs p99 choice depends on sample size and use. For paging an on-call engineer, p99 on a short window is noisy. For release gating, p95 is stabler. Neither replaces p50.
What a p99 needs to be trustworthy
An observed p99 rests on the slowest one percent of your samples. With 200 turns, that is the two slowest turns. One outlier moves it. As a rule of thumb, you want at least ten observations beyond the percentile before you trust it. That is about 200 turns for p95 and about 1,000 for p99. This is arithmetic, not a standard. If your test set is 60 turns, report p50 and the maximum, and say so.
Report the count next to every percentile. "p95 1.4 s (n = 212)" is a claim. "p95 1.4 s" is a rumor.
Percentiles are per turn, callers live per call
Callers do not experience your per-turn distribution. They experience one call with several turns. The chance that a call contains at least one turn slower than a given percentile is 1 - q^n, where q is the percentile (0.95 or 0.99) and n is the number of turns. This assumes turns are independent. Real turns correlate within a call, so treat it as a first approximation.
| Turns in the call | At least one turn above p95 | At least one turn above p99 |
|---|---|---|
| 5 | 22.6% | 4.9% |
| 10 | 40.1% | 9.6% |
| 20 | 64.2% | 18.2% |
| 30 | 78.5% | 26.0% |
| 50 | 92.3% | 39.5% |
Dean and Barroso make the same point for fan-out requests in The Tail at Scale. If one server in a hundred is slow, a request that waits on 100 servers is slow about 63 percent of the time. A call is the same shape in time. A 20-turn call will, more often than not, contain a p95 turn.
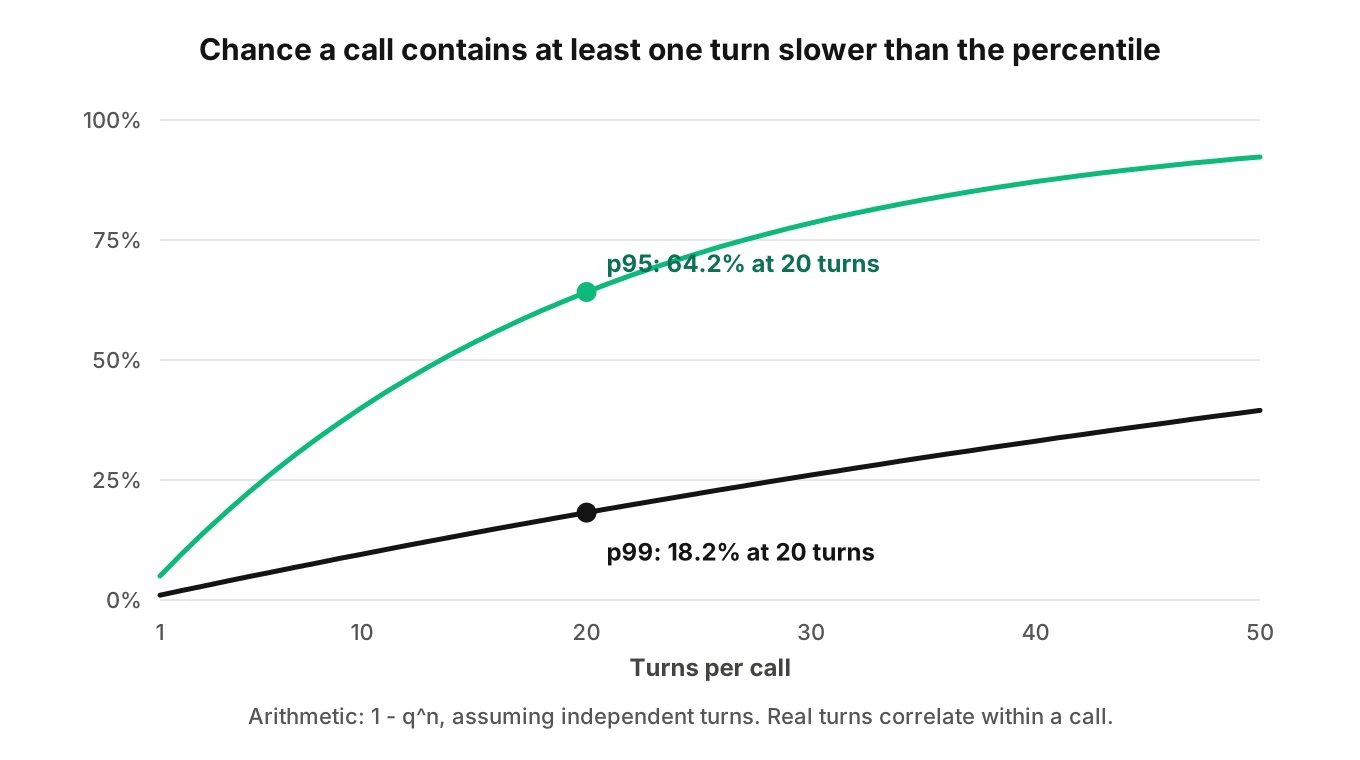
So report two call-level numbers beside the turn-level ones: the share of calls with at least one turn over your budget, and the worst turn per call.
Why a good p99 dashboard can still feel slow
Here are six mechanisms, in the order we would check them. Some come from tool docs. Others are inferences from how the clocks work.
1. The dashboard stops before the caller. The agent clock ends at the agent edge. The caller adds the network, the playout buffer and the handset. Illustrative example: the agent reports a p50 of 900 ms at clock five, and the call recording shows 1,150 ms at clock six. The 250 ms residual never appears on a dashboard. Measure it per call, because it should be stable. If it swings, look at carrier routing and region.
2. The metric counts only turns that got an answer. The Pipecat observer, as documented, captures a measurement when the bot starts speaking. A turn where the agent never answers has no latency row. Check whether yours does. A dashboard built from answered turns cannot show silence. That is survivorship bias. Add a count of turns with no reply inside a window.
3. Fast can mean wrong. An aggressive endpoint commits the turn early, which makes clock one look excellent. If the caller was only pausing, the agent talks over them. The latency chart improves while the call gets worse. Always read latency next to interruption and cut-off counts. See our posts on endpointing choices and end-of-turn detection.
4. The pool hides the turn type. A greeting, a yes or no, a long address and a tool lookup are different turns with different latency. Pooled into one histogram, they hide which one hurts. Illustrative example: 3 percent of turns are database lookups at about 2.5 s. A pooled p95 sits at the plain-turn value and looks fine. The p99 shows the lookup, but not why. Split by turn type, and AAIF's "tool start to tool result" clock explains it.
5. "First audio" may not be sound. The first audio chunk from a TTS engine can carry leading silence or a breath. A clock that stops at the first byte can stop before anything audible. Detect onset by energy on the recording, not by the first frame at the agent. Check whether your engine does this.
6. The median is slow for the use case. A p99 inside budget says nothing about the p50. Callers compare the agent to the pace of a human reply, which averages around 200 ms in the Levinson and Torreira corpora. If your p50 is far above that, callers feel the lag on most turns, however tidy the tail.
A perceived latency voice agent check you can run in a day
Put the numbers next to what people hear. The turn gap on the recording is only a proxy for what people felt. Take 30 recorded turns, with a spread of turn types and a spread of measured clock-six gaps. Have two reviewers listen blind and mark each turn "natural," "noticeable pause" or "too slow." Then compare their marks to the measured gaps.
You are looking for disagreements. A turn measured fast but marked slow points to a bad onset detector, leading silence or a cut-off. A turn measured slow but marked natural points to a caller who was still thinking, or a filler that masked the wait. This small test usually shows which clock to trust more than any dashboard does.
How to test perceived latency before a release
This is how to measure voice agent latency in a repeatable test, with a per-turn latency table at the end. It works on simulated calls before release and on recorded calls afterward.
1. Fix the definitions — Write down the six clocks, with T0 as the last caller speech sample. Pin the versions of your STT, turn detector and TTS, because upgrades move the clocks without changing the experience.
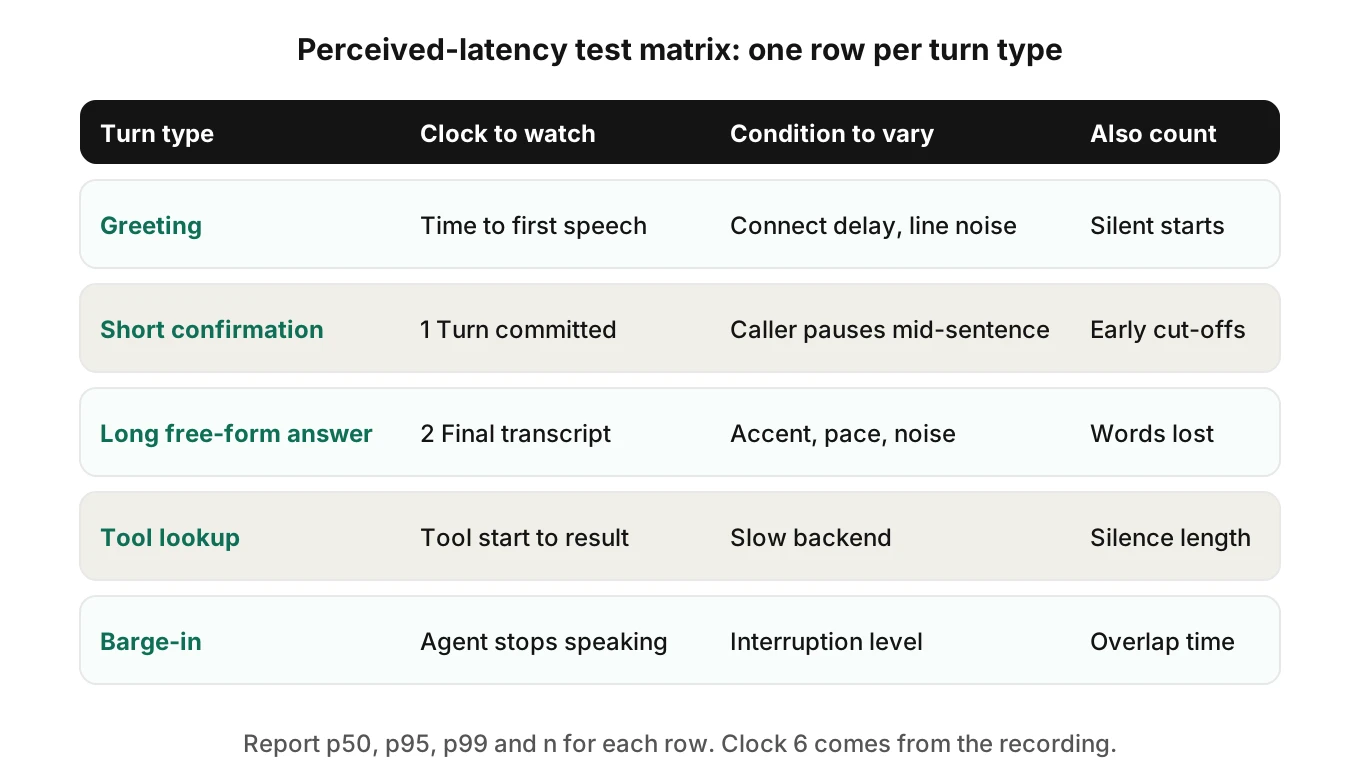
2. List turn types — Greeting, short confirmation, long free-form answer, tool lookup, correction, and barge-in. Tag every scripted turn with its type. Each type gets its own percentiles.
3. Vary the caller — Change the caller response delay, speech pace, accent and background noise. A caller who pauses mid-sentence tests the endpoint. Noise and phone codecs test the transcript clock.
4. Record at the caller's edge — Capture two-channel audio as close to the far end as you can: simulator side or carrier recording. Derive clock six from the audio, with an energy-based onset detector, not from agent logs.
5. Compute per turn, then per call — Report p50, p95 and p99 with n for each turn type. Add the worst turn per call, the share of calls with a turn over budget, and the count of no-reply and overlap turns.
6. Listen to a sample — Review a sample of calls by ear, as in the check above. Log every disagreement between metric and ear.
7. Gate on regression — Compare each release to the previous one on the same scenarios. Fail the build when a percentile moves beyond the run-to-run spread you measured by repeating the baseline.
The matrix below shows how the plan maps turn types to the clock to watch and the condition to vary.
Code: per-turn-type percentiles and per-call worst turn
This sketch is simplified and illustrative. It assumes you already extracted one gap per turn from the recording, in milliseconds, with None for a turn that got no reply.
# turn_report.py - simplified: percentiles per turn type and per call
import numpy as np
from collections import defaultdict

# rows: (call_id, turn_type, clock6_gap_ms or None)
rows = [
    ("c1", "confirm", 820), ("c1", "lookup", 2310), ("c1", "confirm", 790),
    ("c2", "confirm", 905), ("c2", "free_form", None), ("c2", "confirm", 860),
]
BUDGET_MS = 1500  # your own number, set from your own baseline

by_type, by_call, no_reply = defaultdict(list), defaultdict(list), defaultdict(int)
for call, ttype, gap in rows:
    if gap is None:
        no_reply[ttype] += 1
        continue
    by_type[ttype].append(gap)
    by_call[call].append(gap)

for ttype, gaps in by_type.items():
    p50, p95, p99 = np.percentile(gaps, [50, 95, 99])
    print(f"{ttype:10s} n={len(gaps):4d} p50={p50:.0f} p95={p95:.0f} "
          f"p99={p99:.0f} no_reply={no_reply[ttype]}")

worst = {c: max(g) for c, g in by_call.items()}
over = sum(w > BUDGET_MS for w in worst.values()) / len(worst)
print(f"calls with a turn over {BUDGET_MS} ms: {over:.0%}")
With only a handful of turns the percentiles are meaningless. The point is the shape of the report: per turn type, with counts, plus the per-call view. Treat the budget constant as a placeholder and derive it from your own baseline and from your own callers.
Where Evalgent fits
Evalgent measures latency, interruptions, talk share and turn count from the audio itself, on simulated calls and on production calls. A scenario can set the caller's response delay and background noise, so the same turn is tested clean and under stress. Percentiles are reported per scenario, which gives you the turn-type split above. Humans review the verdicts, which covers the ear check. We do not publish latency benchmarks, and we would not trust a universal one. The number that matters is your agent's, on your callers, against your last release.
Our voice agent testing checklist and transcript versus audio evaluation explain why the audio is the right source. For turning a measured baseline into a commitment, see voice agent SLOs.
Where the other latency posts fit
| If your question is | Read |
|---|---|
| Which clock, and how do I test what callers hear | This post |
| What does latency cost in hang-ups and handle time | The cost of latency |
| Where do milliseconds go in LiveKit | Debug LiveKit latency |
| Where do milliseconds go in Pipecat | Measure Pipecat latency |
| Does the framework matter | LiveKit vs Pipecat latency |
| How do I cut the STT stage | Reduce STT latency |
| How do I cut the TTS stage | Low-latency TTS |
| How do I set my own targets | Voice agent metric benchmarks |
Frequently asked questions
What is voice agent latency?
Voice agent latency is the delay between the caller finishing a sentence and the agent responding. It is several clocks, not one: turn committed, final transcript, first token, first audio, playback begins and what the caller hears. Always state the start line and the stop line before comparing numbers.
What is time to first audio?
Time to first audio is how long a speech engine takes to produce its first audio, either from the synthesis request or from the caller's end of speech. The first is a TTS stage duration. The second, end of speech to first audio, is the version callers feel. Say which one you mean.
What is voice-to-voice latency?
Voice-to-voice latency is the time from the caller's last speech to the agent's first audible speech. Measured at the agent edge it is clock five. Measured at the caller's ear it is clock six, which adds network, buffering and playout. Use the caller-side number when judging experience.
How do I measure voice agent latency?
Record both sides of a call in separate channels, ideally at the far end. Detect the end of caller speech and the onset of agent speech by energy, then subtract. Compare the result against agent-side logs. The difference is the cost your dashboard does not see. Report percentiles per turn type, with counts.
p95 vs p99 latency: which should I report?
Report both, plus p50. p50 describes the typical turn, p95 the bad turn that appears in longer calls, and p99 the rare one. Without roughly a thousand turns, a p99 rests on too few samples to trust. Always show the sample count beside it.
Why does my voice agent feel slow when my p99 looks fine?
Usually the dashboard stops before the caller, drops turns with no reply, pools different turn types, or hides a slow median behind a tidy tail. A fast endpoint can also hide interruptions. Check clock six on a recording, count no-reply turns and compare p50 against the human norm.
How do I test perceived latency?
Combine measurement with listening. Record calls at the caller's edge, compute gaps per turn type, and have reviewers rate a sample as natural, noticeable or too slow. Then study the disagreements between the rating and the measurement. Repeat on every release with the same scenarios.
What latency do callers expect from a voice agent?
Human turn gaps average around 200 ms according to Levinson and Torreira, but that is a human norm, not a target for agents. No source we opened gives a verified acceptable band for voice agents. Measure your own callers' reactions and set the budget from that baseline.
The bottom line
Voice agent latency is a set of clocks that all start at the caller's last word, and the one that matters is the one that ends at the caller's ear. A good p99 only means something when it is measured on that clock, per turn type, with a sample size beside it and a listening check behind it.
Related Articles

How to automate voice agent testing: synthetic callers vs manual QA
Learn how ai test automation replaces manual QA for voice agents. Compare synthetic callers vs human testers, with a 5-step framework to scale without hiring.
Read more
AI Agent Testing vs Voice Agent Testing: What General Tools Miss for Voice
AI agent testing measures text outputs. Voice agent testing measures behaviour through an acoustic pipeline. Five failure categories general tools miss.
Read more