Voice Agent Provider Monitoring: Detect STT, LLM and TTS Outages Before Callers Do
On this page
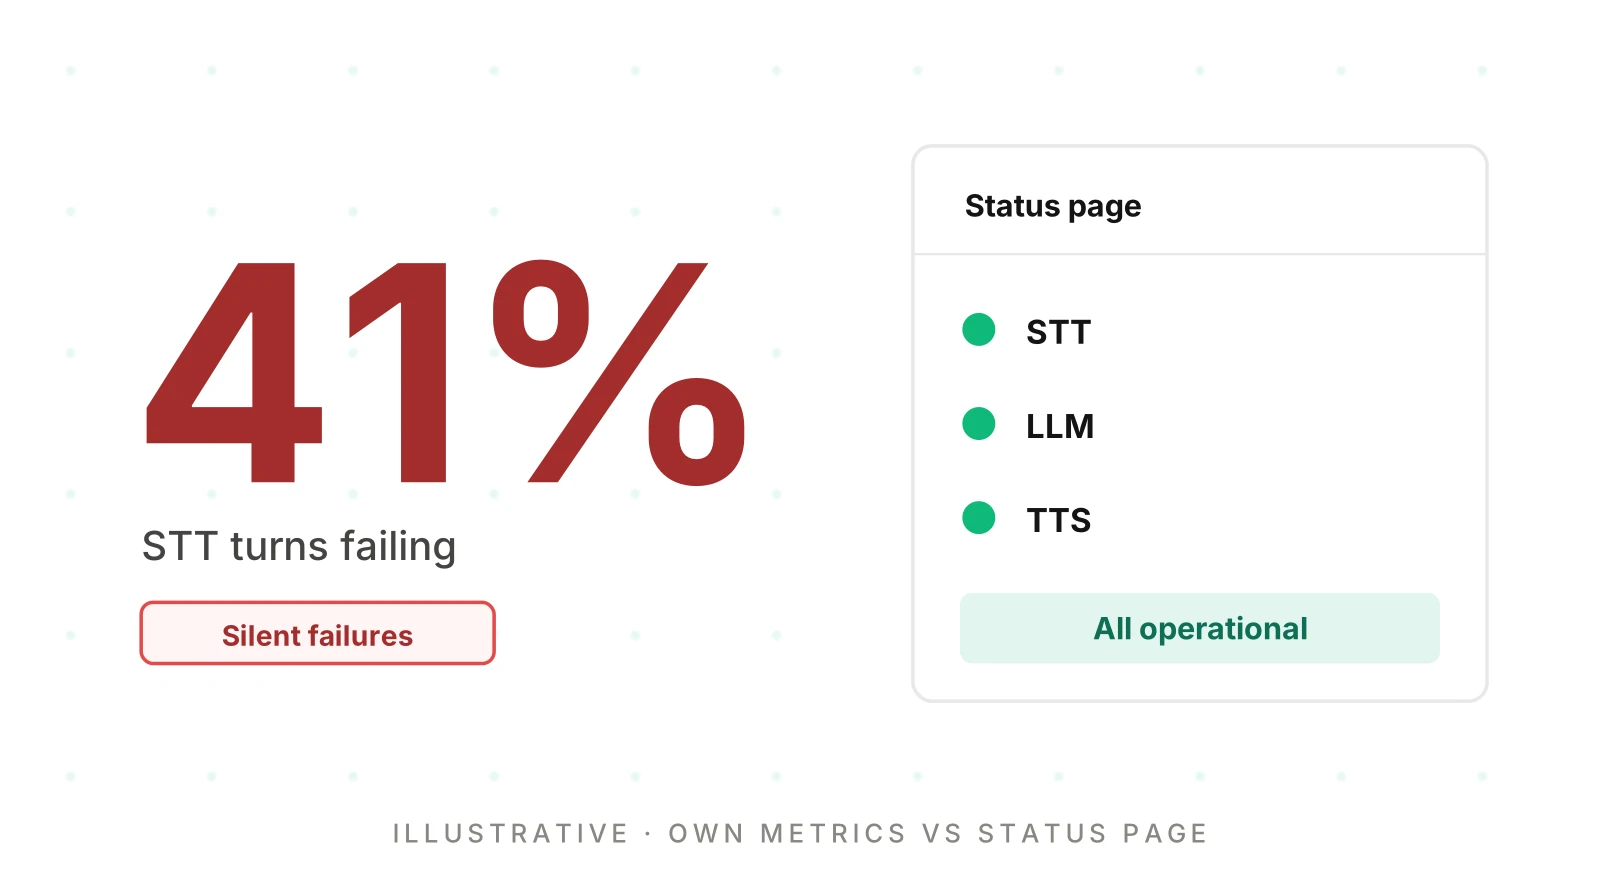
Your caller never sees which provider failed. They hear silence, a repeated greeting or a voice that cuts out. Your first report is often a complaint. This post covers the detection half of voice agent provider monitoring: how a team learns that an STT, LLM, TTS or telephony provider is degrading before callers say so. For the response half (fallback adapters, timeouts, standby providers), read the provider outage and failover guide.
Good voice agent provider outage detection rests on checked facts. Provider facts below were read from the providers' own pages on November 21, 2026. Worked examples are labelled illustrative. Your numbers must come from your own traffic.
Three signal sources, three different clocks
Each source sees part of an incident and goes blind elsewhere. Google's SRE book separates black-box monitoring, "testing externally visible behavior as a user would see it", from white-box monitoring, which uses metrics "exposed by the internals of the system". You need both, plus the provider's own word.
| Source | Sees | Blind to | Clock |
|---|---|---|---|
| Status page or status API | What the provider posted | Unposted impact; your region or voice | A person decides |
| Per-provider metrics from live calls | Real errors on real traffic | Quiet hours; silent failures | Needs enough calls |
| Synthetic probe calls | The full path, even with no callers | Rare intents; narrow slices | The probe interval |
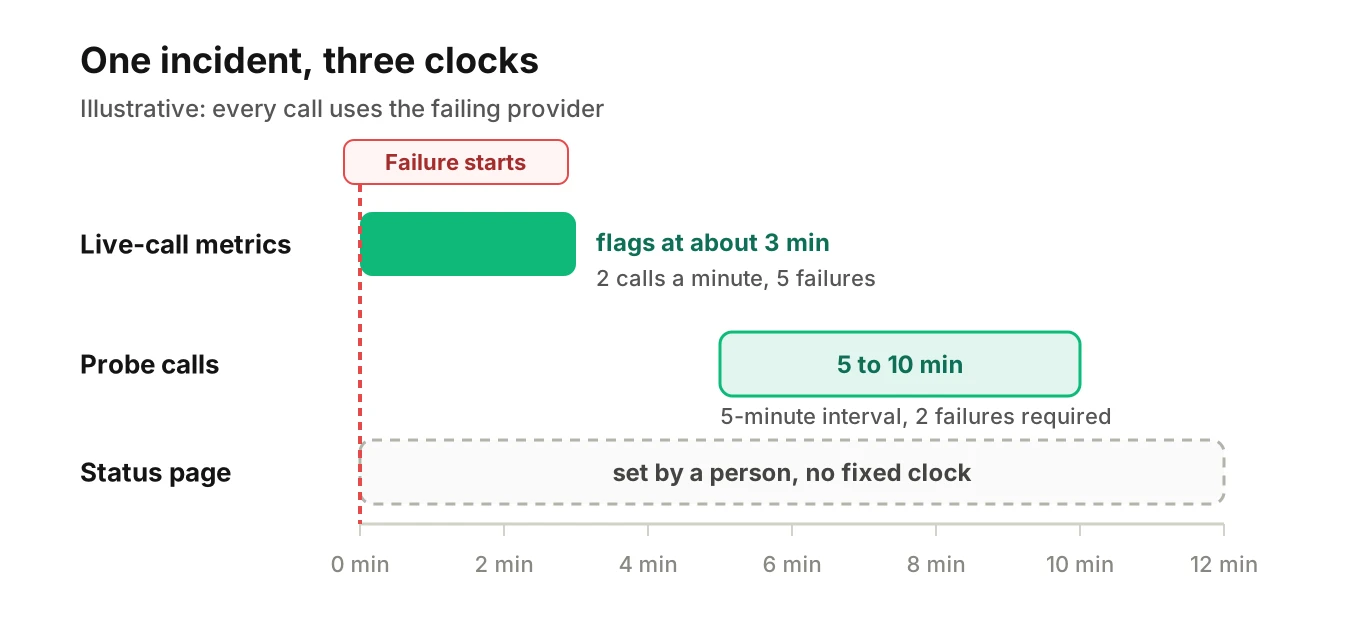
Probes are covered in synthetic monitoring for voice agents. Live metrics are covered in monitoring voice agents in production. Here the question is narrower: which source tells you first, and what does each miss?
Status pages and status APIs
Provider status page monitoring is cheap, so do it. As of November 21, 2026, the footers of Deepgram's status page and Anthropic's status page say "Powered by Atlassian Statuspage". Both offer email, SMS, Slack and webhook subscriptions, plus Atom and RSS feeds. The webhook covers incident creation, updates, resolution and component status changes.
Atlassian documents the read-only JSON endpoints on its own page, bitbucket.status.atlassian.com/api: summary.json, status.json, components.json and incidents/unresolved.json. The status.json indicator is none, minor, major or critical. Component states are operational, degraded_performance, partial_outage and major_outage. I could not open Deepgram's JSON endpoint, so confirm the shape on each page you rely on.
OpenAI's status page and ElevenLabs' status page say "Powered by incident.io". I did not see a JSON feed described there, so check their subscription options. ElevenLabs links regional pages for Global (United States), EU, India and Singapore, and marks the last three Enterprise-only. Watch the page for your region and plan.
Why status pages lag, and what they cannot say
A status page is a statement, not a sensor. Atlassian's create an incident page describes a manual flow: a user opens Incidents, clicks Create incident and fills in a form. The creator picks the affected components and whether to notify subscribers. The page describes no automatic poster. So the page changes when a person decides it should.
I did not measure how long any provider takes to post, and I will not guess. OpenAI's December 11, 2024 write-up gives an internal timeline. Alerts fired at 3:13 pm PST, impact began at 3:16 pm, and maximum impact came at 3:40 pm. It does not say when the public page changed. So log the gap yourself: for each incident, note when your signal fired and when the page posted. After five incidents you have your own lead time.
Short incidents are the other trap. Deepgram's page lists "Elevated API errors" on November 16, 2026, from 16:08:11 to 16:08:24 UTC. That is 13 seconds in which new connections to api.deepgram.com could not be established. A five-minute status poll would likely miss it. A caller who dialled in that window would not.
The component model also limits what a page can say. Atlassian's component documentation defines partial outage as "completely broken for a subset of customers". It cannot say whether you are in the subset.
Partial outages: one region, one model, one voice
Real incidents are often narrow. The same pages show it.
- One model. Deepgram's November 5-6 entry covered Flux streaming STT and Voice Agent sessions at the US endpoint. Voice Agent sessions using a Flux listen model could fail to start.
- One endpoint and call type. Deepgram lists separate components for its Global, AU, EU and IN APIs, each split by STT, TTS and Voice Agent. A November 17 entry covered Aura-2 TTS, where some /v1/speak requests may have failed with HTTP 400 between 00:13 and 00:27.
- One country or number set. Twilio groups Programmable Voice by US1, AU1 and IE1. Its November entries include failures from "a Subset of Twilio Philippines Phone Numbers" and "Silent and One-Way Audio from Colombia". Neither shows as an outage for a US-only agent.
- One named model. Anthropic's incident titles name models, such as "Elevated errors for Claude Sonnet 5.5 and Claude Fable 5.2" on November 16.
An aggregate rate hides all of this. Take illustrative traffic: 600 STT turns an hour, with 8% routed through one region that is fully down.
- Failing turns: 600 x 0.08 = 48.
- Provider-wide error rate: 48 / 600 = 8%.
- Error rate inside the region: 48 / 48 = 100%.
A rule that pages at 10% provider-wide never fires. The same data split by region shows total failure. Slice every provider metric along the lines providers fail: endpoint or region, model, voice, call type, and for telephony, destination country and number. Keep slices few enough that each has traffic. Anomaly detection for voice agent metrics covers baselines per slice.
Rate limit errors versus outages
A 429 is not an outage, yet it ruins calls just the same. It needs a different fix. Mixing the two sends on-call to the wrong dashboard.
RFC 6585 defines HTTP 429 Too Many Requests. The response MAY include a Retry-After header, and the RFC does not define how a server counts requests. It also says servers are not required to use 429 at all. So a throttle can arrive under another code, with no Retry-After. Provider docs add detail:
| Docs read Nov 21, 2026 | Signal | What the docs say |
|---|---|---|
| OpenAI rate limits | 429, slow_down | Rate rose too fast, even within RPM and TPM limits |
| OpenAI rate limits | 503, server_is_overloaded | Temporary model overload, not a rate limit |
| Anthropic errors | 429, rate_limit_error | Includes a spend cap, which "has no retry-after header and keeps failing until access resumes" |
| Anthropic errors | 529, overloaded_error | "The API is temporarily overloaded" |
| Deepgram errors | 429, TOO_MANY_REQUESTS | Requests exceeded rate limits |
| ElevenLabs errors | 429, concurrent_limit_exceeded | Too many requests at once |
| ElevenLabs errors | 429, system_busy | "The system is currently busy" |
Two lessons follow. First, a 429 can be your own growth. OpenAI and Anthropic both document throttling after a fast ramp. Check your concurrency and request rate before you open a vendor ticket. The API rate limits guide has the concurrency math.
Second, a 429 can be the provider's problem. Deepgram's November 18 entry, "Intermittent connection timeouts", blames a network issue at a US data center and says it produced 429 and 503 errors. The code alone did not say which case callers were in. Check breadth: if every slice sees 429s while your request rate is flat, suspect the vendor. If only your busiest tenant does, suspect your ramp.
Quota errors are a third class. A 402, or a spend-cap 429, will not clear with retries. OpenAI's guide says not to retry errors that need action. Send those to a person with account access.
Error-class breakdown per provider
Record one class per provider attempt, not only a status code. This sketch is illustrative:
// Illustrative: map one provider attempt to a class for your own metrics.
type ErrorClass = "auth" | "billing" | "rate" | "provider" | "timeout" | "empty" | "ok";

function classify(status: number | null, gotFirstByte: boolean, gotPayload: boolean): ErrorClass {
  if (status === null) return gotFirstByte ? "provider" : "timeout"; // no HTTP response at all
  if (status === 401 || status === 403) return "auth";
  if (status === 402) return "billing";
  if (status === 429) return "rate";
  if (status >= 500) return "provider"; // includes 503 and Anthropic's 529
  if (status === 200 && !gotPayload) return "empty"; // connected, nothing useful came back
  return "ok";
}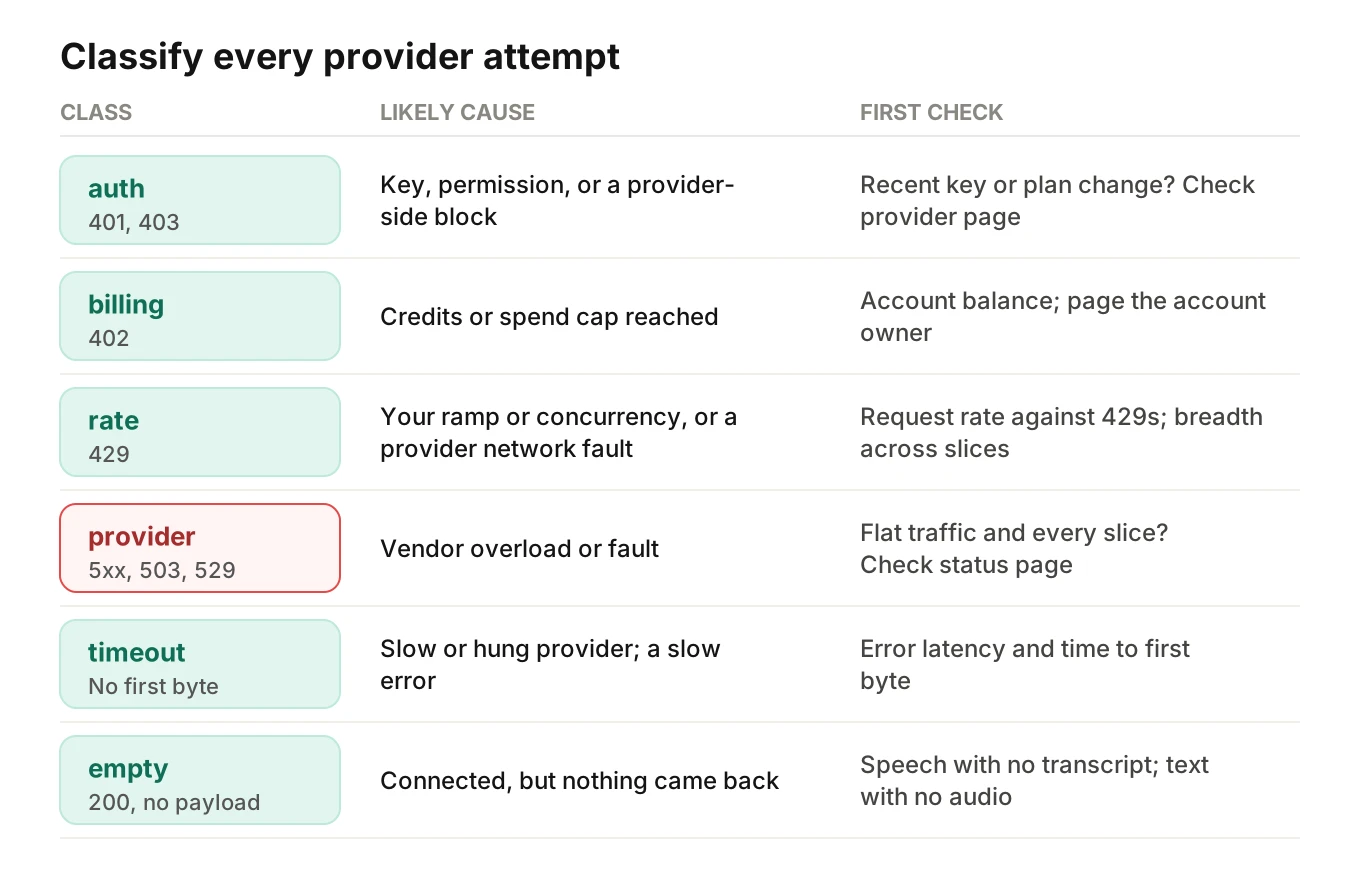
Tag each attempt with provider, region, model, voice, release version and tenant. Then read the classes this way:
- Auth and billing step up at one moment and stay up. Suspect a key rotation, plan change or unpaid balance. A provider can also cause auth-looking errors: Twilio's page lists "Subset of API Requests Blocked with 403 Response" on November 20.
- Rate rises with your own traffic. Compare it to your request rate and concurrency.
- Provider (5xx, 503, 529) rising across slices on flat traffic points at the vendor.
- Timeout and empty are the quiet ones. The SRE book warns that "a slow error is even worse than a fast error" and says to "track error latency, as opposed to just filtering out errors". A WebSocket that connects and returns no transcript raises no HTTP error. Count turns with caller speech and no transcript, and TTS turns with text and no audio. See going silent mid-call.
Track time to first byte per provider as a distribution, not an average. The SRE book's four golden signals map directly: latency and errors per provider, traffic per provider, and saturation as concurrency against your plan limit. This is the core of LLM provider outage monitoring, and the same shape serves STT outage detection and TTS provider monitoring.
Provider trouble or your own deploy? Use a release marker
Many "provider outages" are your own change. Longer context in a new prompt, a changed request parameter or a rotated key can all produce provider-side errors. Put a release marker on every provider chart: a vertical line for each deploy, prompt, model and config change.
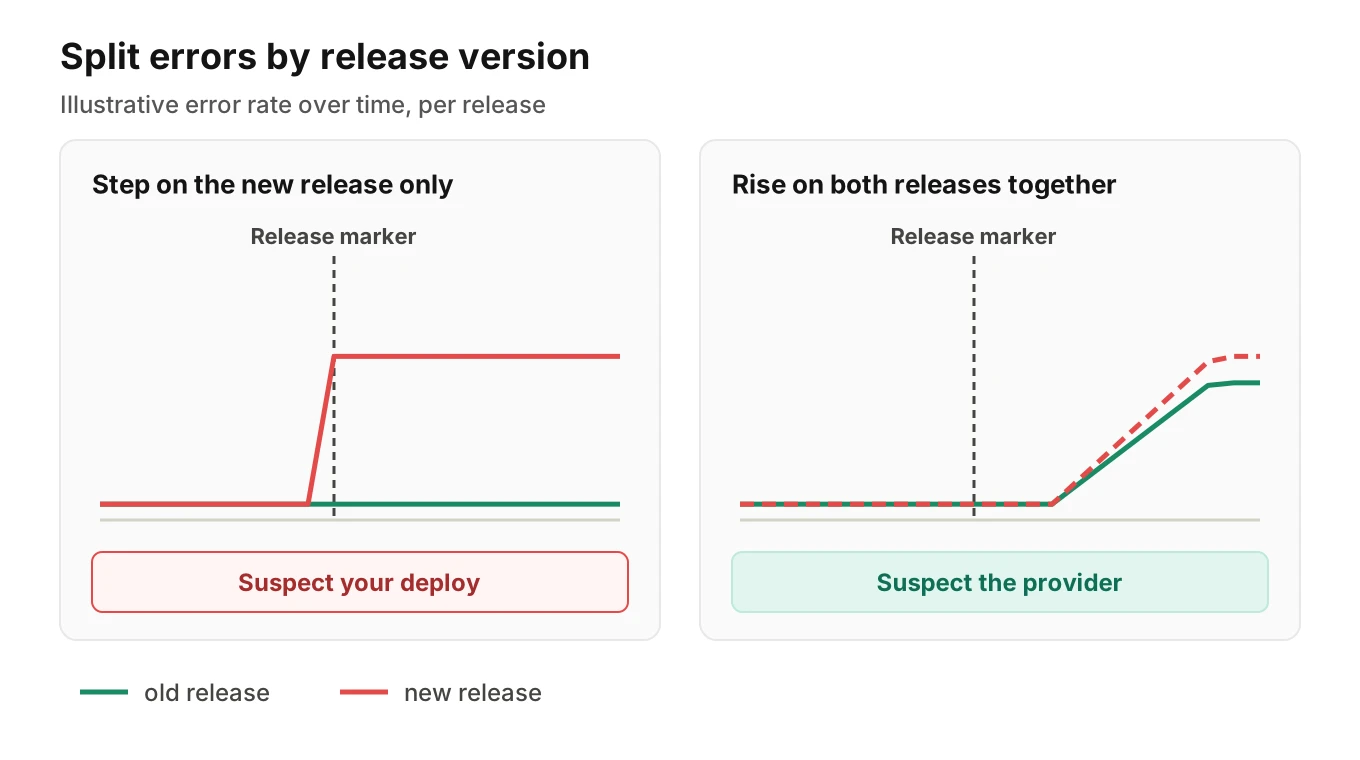
Then ask three questions in order.
1. Does the rise start at the marker? A step within minutes of a release is your deploy until proven otherwise.
2. Does it hit old and new versions together? If calls still on the old version fail too, the cause is shared. This is the concurrent-control logic from canary releases for voice agents.
3. Does a direct provider probe pass? Send one minimal request with a separate client and key, outside your release. If it passes while live calls fail, look at your code path.
If your change is the cause, the kill switch guide covers rollback.
What to page on and what to ticket
Page on caller harm happening now. Ticket what needs a person but not tonight. General tiering lives in voice agent alerting, and targets belong in voice agent SLOs. All thresholds are yours to set from your baseline.
| Signal | Tier | Why |
|---|---|---|
| Provider-class errors or timeouts rising on a busy slice, flat request rate | Page | Callers hear it now |
| Speech with no transcript, or text with no audio, sustained on one provider | Page | Silent failure, no error code |
| Probe calls failing on consecutive runs | Page | Path broken, even at zero traffic |
| Status page posts an incident on a component you use | Notify; page if your signals agree | Corroboration, not proof of impact |
| Auth or billing class errors | Page the account owner | Retries will not fix it |
| Rate class errors near your plan limit | Ticket; page if sustained | Capacity work |
| Slow creep in time to first byte | Ticket | Drift; see metric drift |
A per-provider watch sheet
Fill one row per vendor. The facts come from the pages I opened. The last column is yours.
| Layer (example) | Status source | Slice by | Expect | Probe checks |
|---|---|---|---|---|
| STT (Deepgram) | Components per endpoint and product | Endpoint, model | 429, 503, 402; connect, no transcript | Short utterance returns text |
| LLM (OpenAI, Anthropic) | OpenAI: Chat Completions, Responses, Audio, Realtime. Anthropic: Claude API | Model, account | 429, 503, 529; error after a 200 | First token in budget |
| TTS (ElevenLabs) | Regional pages | Voice, endpoint | 429 (system_busy, concurrency), 402 | Audio bytes arrive |
| Telephony (Twilio) | Region (US1, AU1, IE1) and product | Region, country, number | Failures, one-way audio | Call connects, audio both ways |
Anthropic documents that an error inside a server-sent stream after a 200 skips standard error handling, so streams need their own check. For model changes, see swapping voice agent providers.
How to set up voice agent provider outage detection
Build in this order. Each step adds a signal and removes a blind spot.
1. List every provider and its host - STT, LLM, TTS, telephony and tool APIs. Note region, plan and shared upstreams.
2. Subscribe to each status source - use a webhook or feed, and route it to a channel, not a pager. Log each posted incident next to your own signal time.
3. Emit one record per provider attempt - provider, region, model, voice, release, tenant, error class, time to first byte, error latency. Count speech with no transcript as a failure.
4. Compute rates per slice - size the window to traffic. At 2 calls a minute, five failures arrive in about 2.5 minutes. At 6 calls an hour, they take about 50 minutes, so quiet hours need probes.
5. Add probe calls on a schedule - one full-path journey plus one direct request per provider. At a 5-minute interval with two consecutive failures required, detection lands 5 to 10 minutes after onset.
6. Overlay release markers - split by release version so "your deploy or their outage" is answerable on one screen.
7. Rehearse in staging - break a provider and check that the right signal fires first. After each real incident, ask what the status page added.
Where Evalgent fits
Evalgent is a testing, evaluation and monitoring platform for voice agents. Monitor is live. It works on production call data your team sends, through OpenTelemetry or an upload path, and flags problems such as tool-call failures, latency spikes, PII leakage and policy failures, with fix recommendations. It shows reliability and cost by vendor at headline level, which helps you see that one provider's calls are the ones in trouble. Native connectors for ElevenLabs, Vapi and Retell are planned, not live. Findings come from traces and call data, and Evalgent stays out of the media path.
On the testing side, Evalgent can measure uptime and latency percentiles, and its call simulator reaches an agent over phone, SIP or WebRTC. It is not your always-on probe scheduler, so do not assume a built-in one. Your pager, thresholds and release markers stay in your stack. Evalgent works with teams to set up evals and monitoring for a first agent, and you can book a short call to talk through your provider mix.
Frequently asked questions
How do I detect a voice agent provider outage before callers complain?
For voice agent provider outage detection, combine three signals: the provider's status page or feed, your own error and latency metrics split by provider, and scheduled probe calls. Live metrics fire first on busy traffic. Probes cover quiet hours. The status page confirms and explains. Alert on caller impact, such as speech with no transcript, not only on HTTP errors.
Why are provider status pages slow to show an outage?
A status page is a statement. Atlassian's Statuspage documentation describes a manual flow in which a person creates the incident and picks affected components. The page changes when someone decides to post. Short or narrow incidents may never appear. Record how long each provider takes on your own incidents instead of assuming.
Can I poll a status API instead of watching the page?
Often yes. Atlassian documents JSON endpoints such as status.json and components.json on its own page, and several providers use Atlassian Statuspage. Confirm your provider exposes them. Prefer a webhook or feed over polling, and treat the result as a hint, since it shows only what was posted.
How do I tell an outage from rate limit errors?
Look at breadth and traffic. Provider-class errors (5xx, 503, 529) across all slices on flat traffic point at the vendor. A 429 that follows your own ramp or one busy tenant points at limits. HTTP 429 can also come from an outage, as in Deepgram's November 18 entry, so check both.
What is a partial outage for STT, LLM or TTS?
A partial outage breaks one slice: a region, model, voice, endpoint or set of numbers. Atlassian defines it as a component completely broken for a subset of customers. Your overall error rate can stay low while one slice fails fully. Split metrics by region, model and voice so it stands out.
How often should synthetic probe calls run?
Choose the interval from how fast you need to know. At a 5-minute interval with two consecutive failures required, detection lands 5 to 10 minutes after onset. Shorter intervals detect sooner but cost more and add noise. Run probes at least through quiet hours, when live traffic cannot alert you.
How do I know it is my deploy and not the provider?
Mark every release on your charts and split errors by release version. A step at the marker on the new version only points to your change. A rise on old and new versions together points to the provider. A direct one-request probe outside your release settles most cases quickly.
What should I page on, and what should I ticket?
Page on caller harm now: provider errors or timeouts rising on a busy slice, sustained silence with no transcript or audio, and consecutive probe failures. Ticket slow drift, rate errors near your plan limit and status notices your signals do not confirm. Auth and billing errors need the account owner, not retries.
The bottom line
Voice agent provider outage detection starts with your own per-provider metrics and probe calls, because callers feel trouble before a status page posts it. Split every metric by region, model and voice, separate rate limit errors from real outages, and check the release marker before you blame the vendor.
Related Articles

How to automate voice agent testing: synthetic callers vs manual QA
Learn how ai test automation replaces manual QA for voice agents. Compare synthetic callers vs human testers, with a 5-step framework to scale without hiring.
Read more
AI Agent Testing vs Voice Agent Testing: What General Tools Miss for Voice
AI agent testing measures text outputs. Voice agent testing measures behaviour through an acoustic pipeline. Five failure categories general tools miss.
Read more