Open door for builders.
Measuring Pipecat Latency Stage by Stage: Metrics, Observers and the Numbers That Lie
On this page
Every Pipecat latency thread reads the same way. Someone runs a Twilio bot, the logs show STT, LLM and TTS TTFBs that add up to under a second, and callers still wait two or three. One GitHub issue reports a 4 to 5 second greeting on a telephony pipeline, with mid-conversation turns at 1 to 2 seconds. An older one traced a full extra second to an undocumented aggregation timeout default.
Pipecat now ships better instruments than it did when most of those threads were written. The catch is that each number starts and stops on a different clock, and a few of them quietly disappear when the turn goes badly. This guide reads them from the source. Every class, default and event name below was checked against `pipecat-ai` 1.12.0, the current release on PyPI (September 26, 2026).
If you run LiveKit instead, the companion piece is debugging LiveKit agent latency. For a framework comparison, read LiveKit vs Pipecat latency. This post is for teams already on Pipecat who need to know where each turn's milliseconds went.
Turn on the instruments: what each switch does
Pipecat has three layers of latency data. Services emit `MetricsFrame`s. Observers watch frames and turn them into events. OpenTelemetry tracing wraps it all in spans. None of the useful parts are on by default.
| Switch | Where | Default | What you get |
|---|---|---|---|
| `enable_metrics` | `PipelineParams` | `False` | TTFB, TTFA, TTFAT, text aggregation and processing `MetricsFrame`s; also unlocks the observer's breakdown |
| `enable_usage_metrics` | `PipelineParams` | `False` | LLM tokens, TTS characters, STT audio seconds |
| `report_only_initial_ttfb` | `PipelineParams` | `False` | When `True`, each service reports only its first TTFB of the session |
| `enable_turn_tracking` | `PipelineWorker` | `True` | A `TurnTrackingObserver` that numbers turns |
| `enable_tracing` | `PipelineWorker` | `False` | Conversation, turn, `stt`, `llm` and `tts` spans; needs OpenTelemetry installed and turn tracking on |
| `UserBotLatencyObserver` | `observers=[...]` | Off unless tracing | `on_latency_measured`, `on_latency_breakdown`, `on_first_bot_speech_latency` |
| `ServiceMetricsObserver` | `observers=[...]` | Off | One record per service metric via `on_service_latency` and `on_service_usage` |
Three version notes matter if you copied code from an older tutorial. `PipelineTask` became `PipelineWorker` and `PipelineRunner` became `WorkerRunner` in 1.3.0; the old names still work with a deprecation warning. `UserBotLatencyLogObserver`, which many forum answers still recommend, was removed in 1.0.0. And the part of `UserBotLatencyObserver` that this guide leans on, `LatencyBreakdown.contributions`, only arrived in 1.9.0 on September 10, 2026.
Tracing has a silent failure mode. `PipelineWorker` sets tracing to `enable_tracing and is_tracing_available()`, so if the OpenTelemetry packages are missing, the flag is quietly false. If you turn off turn tracking, the tracing observers are never created at all. Once it works, the turn span carries one latency attribute, `turn.user_bot_latency_seconds`, and the child spans carry `metrics.ttfb`. The per-stage breakdown never reaches the trace unless you put it there yourself. The official OpenTelemetry guide covers exporter setup.
The anatomy of one Pipecat turn
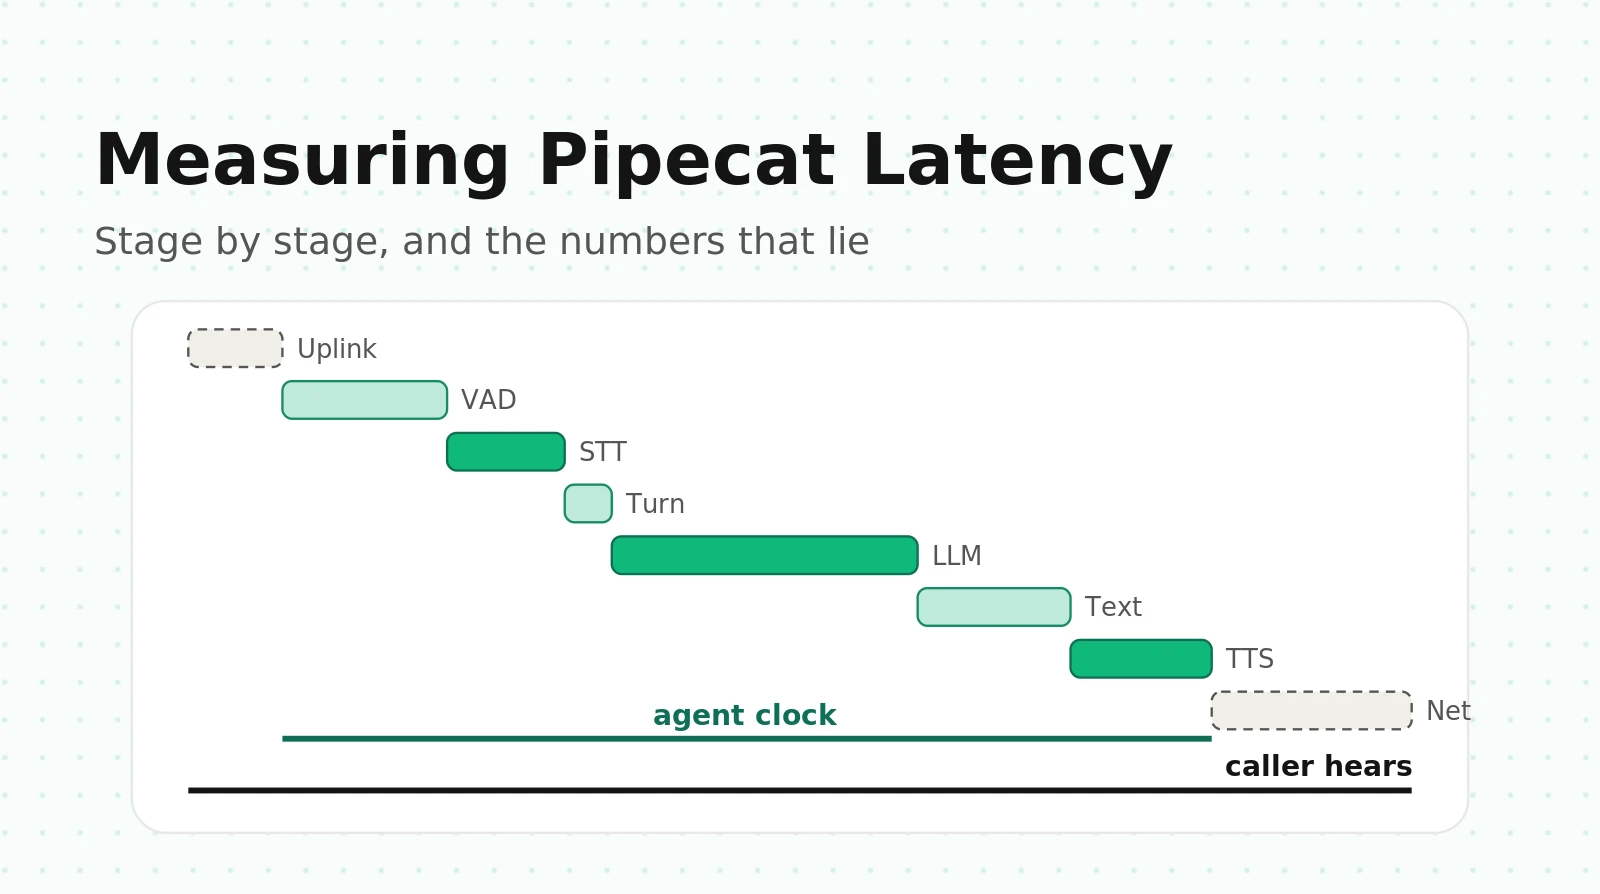
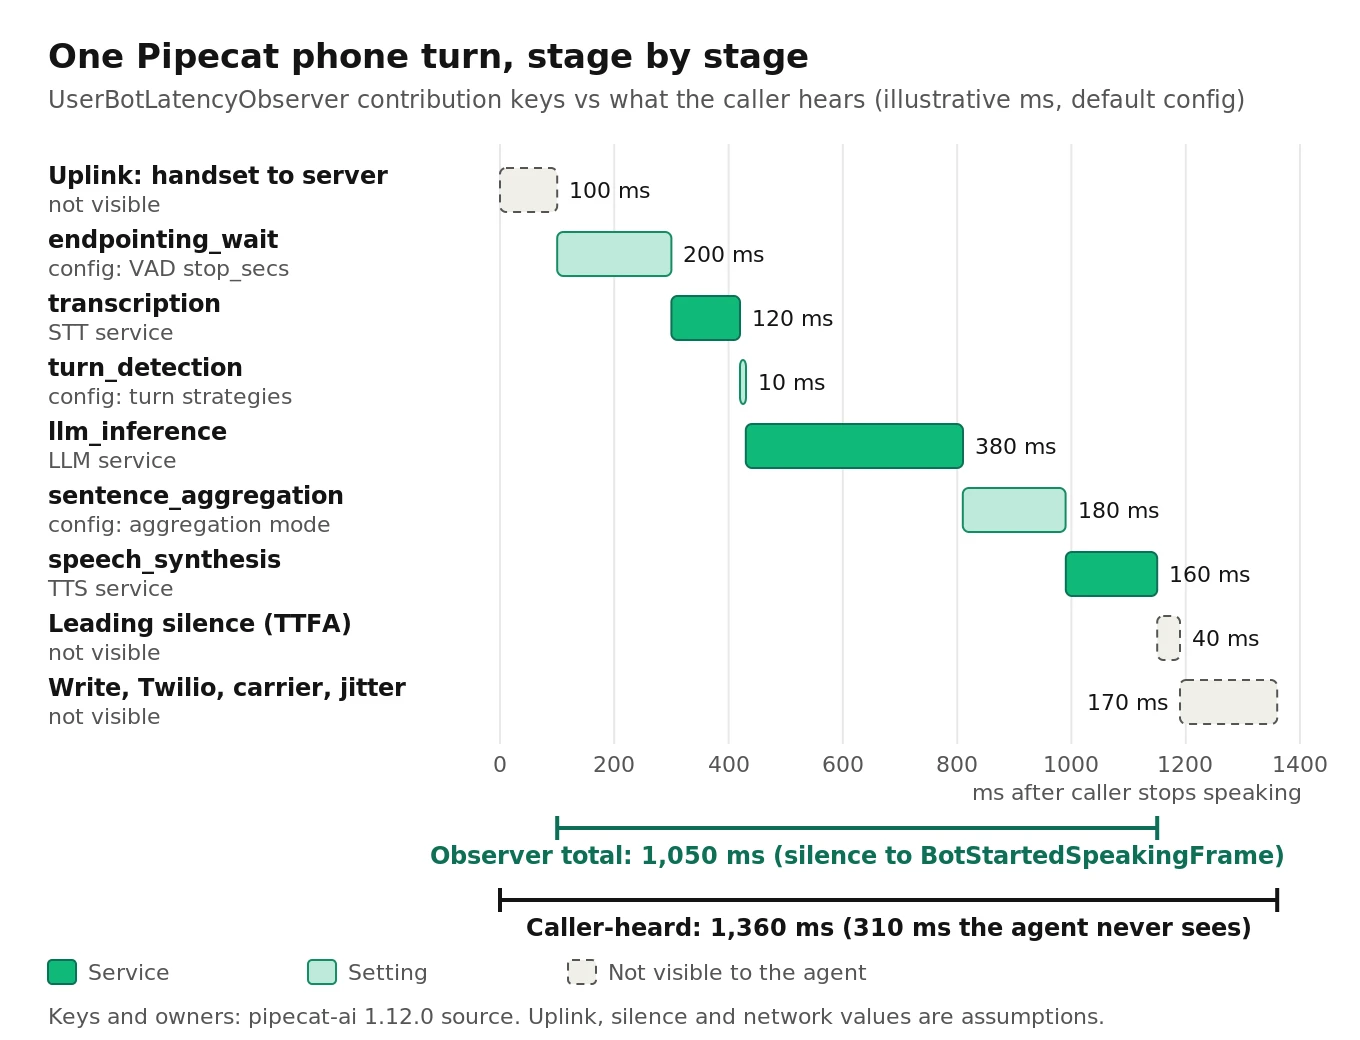
`UserBotLatencyObserver` is the most useful latency tool in Pipecat today, because it does not just report a total. It records "moments" as frames pass, then names the span between each pair of adjacent moments. The spans tile the interval, so the contributions always sum to the total. Anything it cannot name lands in a single `pipeline` entry, which makes gaps visible instead of hiding them.
Here are the moments, in the order a normal turn hits them, and the contribution key each span gets:
1. Silence. The user's last audio. It is not observed; it is back-dated as `VADUserStoppedSpeakingFrame.timestamp - stop_secs`.
2. VAD stop. The VAD has heard `stop_secs` of silence. The span from silence to here is `endpointing_wait`, owned by `config: VAD stop_secs`.
3. Transcript. The last `TranscriptionFrame` before the LLM is asked. Span: `transcription`, owned by the STT service.
4. LLM request. `LLMFullResponseStartFrame`. Span: `turn_detection`, owned by `config: user turn strategies`. This is where Smart Turn verdicts and STT safety-net waits show up.
5. LLM chunk. Derived from the LLM's own TTFB metric. Span: `llm_inference`.
6. Function handlers, if any. Spans: `llm_tool_call` and `function_handler`. Concurrent handlers are merged and named for the slowest.
7. First text. First `LLMTextFrame`.
8. Sentence. Derived from `TextAggregationMetricsData`. Span: `sentence_aggregation`, owned by `config: text_aggregation_mode`.
9. First audio. First `TTSAudioRawFrame`. Span: `speech_synthesis`.
10. Bot speaking. `BotStartedSpeakingFrame`. Span: `output_transport`.
Each contribution carries an `owner_kind` of `service`, `setting`, `bot` or `pipeline`. That one field answers the first triage question without string matching: is this turn slow because of a vendor, a config value, your own code, or Pipecat itself?
Where the clock starts
The start line is back-dated. When Silero declares end of speech, it has already heard `stop_secs` of silence, 0.2 seconds by default. The observer subtracts that so the measurement begins when the user actually stopped. This is the right anchor, but note two consequences. First, the VAD silence window is inside every total, as `endpointing_wait`. Second, the anchor is "when the user's last audio reached the VAD," which is after the phone network's uplink. Nothing on the agent clock knows how long the caller's voice took to arrive.
Where the clock stops
The finish line is `BotStartedSpeakingFrame`. In 1.12.0 the output transport emits it in `_handle_frame`, when its audio task dequeues the first TTS chunk, before that chunk is written to the WebSocket. So the observer ends before the network write, before Twilio's media server, before the carrier, and before the handset's jitter buffer. It also ends before any leading silence the TTS padded onto its first chunk, because a silent chunk still counts as "speaking" on the TTS path.
The default output chunk is 40 ms (`audio_out_10ms_chunks=4`). The WebSocket transport paces writes on a simulated clock, but the first chunk of a reply goes out with no sleep, so pacing does not delay first audio. It does mean audio already handed to Twilio keeps playing after an interruption until a `clear` message lands.
What each Pipecat TTFB measures
A TTFB is supposed to be "request sent to first byte back." In Pipecat, only one of the three main services fits that definition. The table is the single most useful thing to keep next to your dashboard.
| Metric | Clock starts | Clock stops | What it excludes |
|---|---|---|---|
| STT `TTFBMetricsData` | Back-dated speech end (`VAD timestamp - stop_secs`) | Finalized transcript, or the last transcript seen before `stt_ttfb_timeout` (2.0 s) expires | Nothing before speech end; skipped entirely if `stop_secs` is 0 |
| LLM `TTFBMetricsData` | Just before the chat-completions call | First streamed chunk with choices | Sentence aggregation, TTS |
| LLM `TTFATMetricsData` | Same as LLM TTFB | First answer token, after any reasoning | Only reported by text LLMs |
| `TextAggregationMetricsData` | First LLM token | First complete sentence | Only the first measurement per turn is kept |
| TTS `TTFBMetricsData` | Audio context created for the first aggregated sentence | First audio chunk dequeued | Sentence aggregation before it |
| TTS `TTFAMetricsData` | Same as TTS TTFB | First audible sample (RMS onset) | Reports `leading_silence` separately |
| `TurnMetricsData` | VAD speech-to-silence transition | Turn analyzer verdict | Reports `is_complete` and `probability` |
The STT row surprises people. The docstring says it plainly: STT receives continuous audio, so Pipecat measures "from when the user stops speaking to when the final transcript arrives." It is closer to a time-to-final-segment than a TTFB, and it overlaps the `endpointing_wait` and `transcription` contributions. Do not add it to them.
The TTS row has its own trap. TTS TTFB starts only after sentence aggregation hands it a full sentence. A team that sees a 150 ms TTS TTFB and a 900 ms gap often blames the network, when the missing time is `sentence_aggregation`: the LLM streamed a long first clause and the default `TextAggregationMode.SENTENCE` waited for the period. The source's own docstring for that mode estimates the cost at roughly 200 to 300 ms per sentence.
TTFA, added in 1.5.0, closes another gap. Many TTS providers pad the start of a response with silence. TTFA adds that `leading_silence` to TTFB, so comparing the two shows how much of the "speech synthesis" time is the caller hearing nothing. Our time to first audio guide covers why first audible sample, not first byte, is the number callers feel.
The numbers that lie
Each of these comes from reading the 1.12.0 source or the changelog. None is a bug report; they are measurement behaviors you need to account for.
1. The STT p99 tax on every turn
This is the most expensive misunderstanding in Pipecat latency, and it is invisible unless you read the turn stop strategy.
The default stop strategy is `TurnAnalyzerUserTurnStopStrategy` with `LocalSmartTurnAnalyzerV3`. When Smart Turn says the turn is complete, the strategy still waits for text. It releases the turn immediately only if the transcript arrives marked `finalized`. Otherwise it waits for a safety-net deadline: speech end plus the STT service's `ttfs_p99_latency`. A transcript that arrives early but unfinalized does not release the turn early. The turn waits out the p99.
Which services mark transcripts finalized depends on whether the provider confirms a finalize request. In 1.12.0, Deepgram (it sends `Finalize` on VAD stop and checks `from_finalize`), AssemblyAI, Azure, Google, Speechmatics, Soniox, Sarvam and several others do. Every segmented STT (Whisper-style, one request per utterance) marks its single transcript finalized. Some streaming services do not, including `CartesiaSTTService`, `GladiaSTTService`, `AWSTranscribeSTTService` and `OpenAIRealtimeSTTService`.
Pipecat publishes the deadlines in `stt_latency.py`, all measured with `stop_secs=0.2`:
| Service | Built-in `ttfs_p99_latency` | Marks finalized in 1.12.0 |
|---|---|---|
| Deepgram (Nova) | 0.35 s | Yes |
| Soniox | 0.35 s | Yes |
| AssemblyAI | 0.42 s | Yes |
| Speechmatics | 0.74 s | Yes |
| Cartesia (streaming STT) | 0.81 s | No |
| Gladia | 1.49 s | No |
| OpenAI Realtime STT | 1.66 s | No |
| AWS Transcribe | 1.90 s | No |
So with a non-finalizing service, the `turn_detection` contribution is roughly the p99 minus whatever came before it, on every single turn. With OpenAI Realtime STT that means the LLM is not asked until about 1.66 seconds after the caller stopped talking, even when the transcript was ready at 500 ms. The STT latency tuning docs explain the trade-off: too low and the bot answers incomplete text, too high and it waits. What they do not spell out is that for non-finalizing services this value is not a cap. It is the floor.
The fix is to measure your own TTFS with Pipecat's `stt-benchmark` tool at your region and VAD settings, pass it as `ttfs_p99_latency`, and prefer a service that confirms finalization. If you change `stop_secs`, Pipecat logs a warning that the built-in values no longer apply. For a wider view of the STT side, see how to reduce STT latency.
2. The turn wait is trimodal
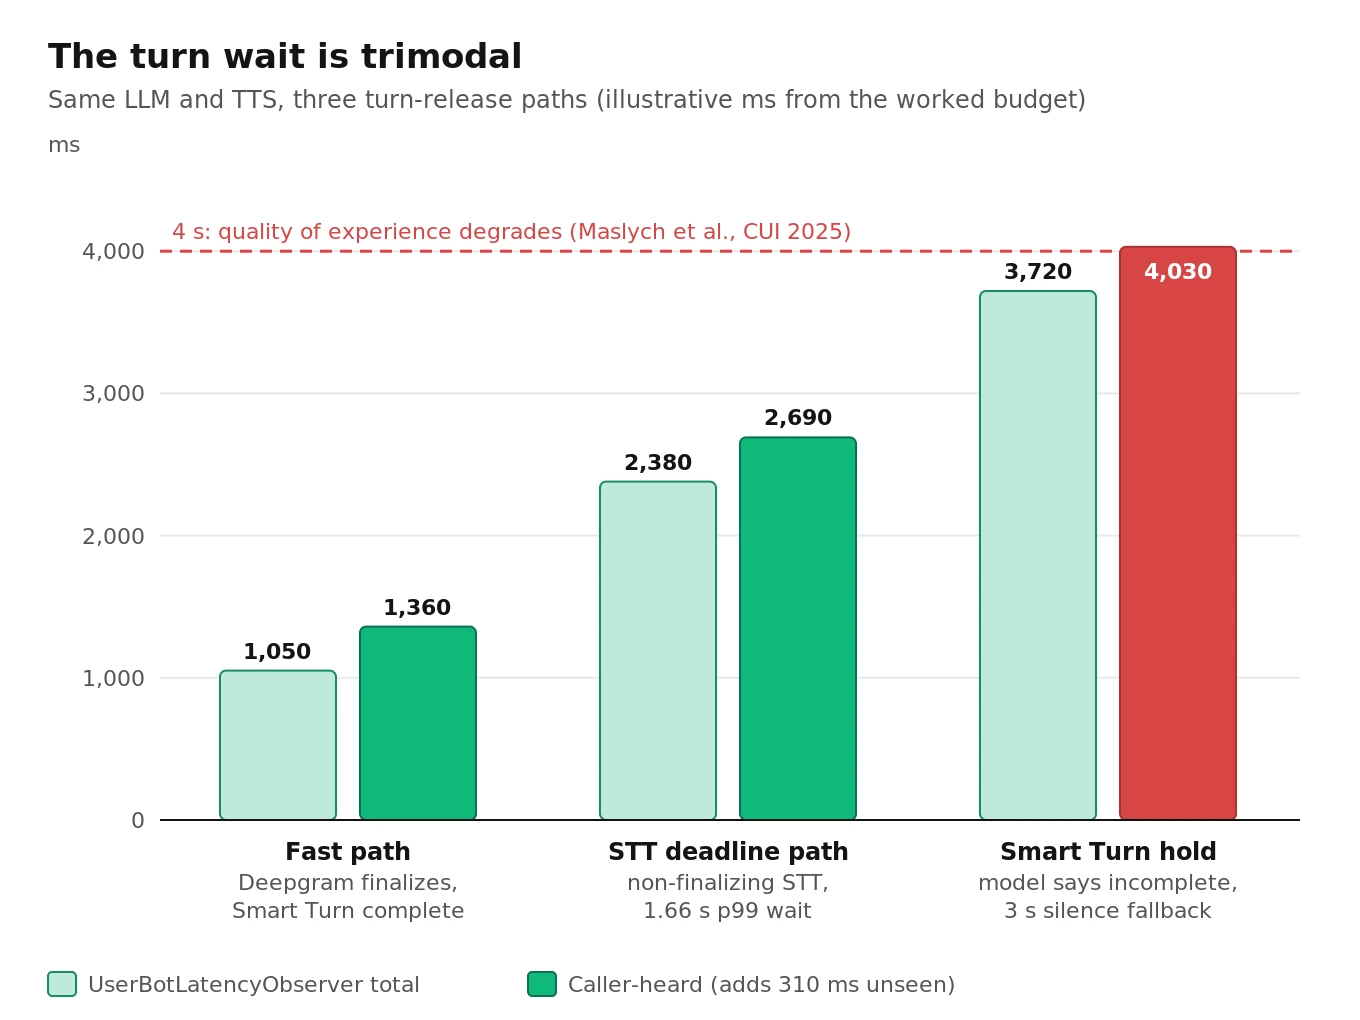
Averages hide this completely. A Pipecat turn release lands in one of three clusters:
- Fast path. Smart Turn says complete, transcript finalized. The release follows VAD stop by a finalize round trip.
- Hold path. Smart Turn says incomplete. The analyzer waits for its own `stop_secs`, 3 seconds of silence by default, before closing the turn.
- Fallback path. No stop strategy fires, often because no transcript arrived. `user_turn_stop_timeout` closes the turn after 5.0 seconds.
A healthy p50 can sit on top of a p95 made entirely of hold-path turns. Short answers like "yes," a ZIP code or a name are classic hold-path triggers. Track the share of turns with `turn_detection` above 2.5 seconds as its own metric. Our Smart Turn interruption strategy guide covers tuning that model, and end-of-turn detection compared covers alternatives such as Flux.
3. The STT TTFB often arrives after the bot spoke
For a service that does not finalize, the STT TTFB metric is held until `stt_ttfb_timeout` (2.0 s by default) expires, then measured to the last transcript seen. If the bot started speaking before then, the observer has already emitted its breakdown and reset. The STT entry is missing from `breakdown.ttfb`. Count it from `ServiceMetricsObserver` records instead, which arrive whenever the metric does.
4. Bad turns vanish
The observer measures a turn only when `BotStartedSpeakingFrame` arrives. An `InterruptionFrame` resets its accumulators. So a turn where the caller gave up and spoke again, or where the bot never answered, produces no latency row. Your slowest turns are disproportionately these.
The research literature has the same blind spot, and it labels it. Full-Duplex-Bench (Lin et al., 2025), a benchmark for turn-taking in spoken dialogue models, computes response latency "only when TO equals 1," meaning only when the model actually took the turn, and reports the takeover rate separately. That is the right design for Pipecat too: report latency over answered turns and an unanswered-turn rate next to it. One without the other can improve while the experience gets worse.
5. Upgrades move the numbers without changing the latency
The 1.8.0 changelog fixed LLM TTFB consistency. Before it, `AnthropicLLMService` and `AWSBedrockLLMService` stopped the clock when the stream was created, before any model output, and `GoogleLLMService` stopped on a first chunk that could carry only usage metadata. After it, TTFB ends at the first byte of model output, and for thinking models, that is the first reasoning token. The same release removed processing metrics from 22 streaming STT services, and stopped `WebsocketTTSService` subclasses from reporting a processing time that had been zero on every turn.
So an upgrade across 1.8.0 can raise your LLM TTFB chart with no change in what callers hear. Pin the Pipecat version in every latency report, and re-baseline after upgrades.
6. `report_only_initial_ttfb` and the greeting
With `report_only_initial_ttfb=True`, each service reports one TTFB per session and then goes quiet. It is a cost-saving switch for dashboards, not a measurement mode. Separately, the observer times the first bot utterance from "pipeline ready with a client connected," not from user silence, and labels it `measured_from: client_connected`. Keep greetings in their own bucket. Issue #2957's 4 to 5 second greeting next to 1 to 2 second turns is a different problem (cold processes and first connections) from mid-call latency, and a maintainer's reply there recommends keeping a warm reserve agent.
Reconstructing a per-turn waterfall
The plan: one JSON line per answered turn, with every contribution by key, every service TTFB, tool timings, and enough context to compute coverage. Then a second script turns that file into p50 and p95 per segment.
The exporter below wires three observers. It is illustrative and targets `pipecat-ai` 1.12.x; adapt the plumbing to your bot file. Every class and event name was checked in the 1.12.0 source.
# turn_latency_export.py - illustrative, pipecat-ai 1.12.x
import json
from pipecat.observers.user_bot_latency_observer import (
    UserBotLatencyObserver, LatencyBreakdown,
)
from pipecat.observers.turn_tracking_observer import TurnTrackingObserver
from pipecat.observers.service_metrics_observer import ServiceMetricsObserver


def latency_observers(call_id: str, path: str) -> list:
    latency = UserBotLatencyObserver()
    turns = TurnTrackingObserver()
    services = ServiceMetricsObserver()
    out = open(path, "a", buffering=1)
    state = {"turn": 0}

    def emit(row: dict) -> None:
        out.write(json.dumps({"call_id": call_id, **row}) + "\n")

    @turns.event_handler("on_turn_started")
    async def _turn_started(_obs, turn_number):
        state["turn"] = turn_number

    @turns.event_handler("on_turn_ended")
    async def _turn_ended(_obs, turn_number, duration, was_interrupted):
        emit({"type": "turn_end", "turn": turn_number,
              "duration_s": duration, "interrupted": was_interrupted})

    @latency.event_handler("on_latency_breakdown")
    async def _breakdown(_obs, b: LatencyBreakdown):
        parts, owners, kinds = {}, {}, {}
        for c in b.contributions:
            parts[c.key] = parts.get(c.key, 0.0) + c.duration_secs
            owners[c.key] = c.owner
            kinds[c.key] = c.owner_kind.value
        emit({
            "type": "latency",
            "turn": state["turn"],
            "anchor": b.measured_from.value if b.measured_from else None,
            "total_s": b.total_secs,
            "user_turn_s": b.user_turn_secs,
            "parts_s": parts,
            "owners": owners,
            "owner_kinds": kinds,
            "ttfb_s": {t.processor: t.duration_secs for t in b.ttfb},
            "text_agg_s": b.text_aggregation.duration_secs if b.text_aggregation else None,
            "tools": [{"name": f.function_name, "s": f.duration_secs}
                      for f in b.function_calls],
        })

    @services.event_handler("on_service_latency")
    async def _service(_obs, rec):
        emit({"type": "service", "turn": state["turn"], **rec.model_dump(mode="json")})

    return [latency, turns, services]


# In your bot:
# from pipecat.pipeline.worker import PipelineWorker, PipelineParams
# worker = PipelineWorker(
#     pipeline,
#     params=PipelineParams(enable_metrics=True, enable_usage_metrics=True,
#                           audio_in_sample_rate=8000, audio_out_sample_rate=8000),
#     observers=latency_observers(call_sid, "/var/log/agent/turns.jsonl"),
# )
The `service` rows matter because of lie number 3. They carry the STT TTFB that arrives after the breakdown, plus TTFA with `leading_silence_secs` and TTFAT with `thinking_time_secs`. Join them to latency rows on `call_id` and `turn`.
Now the report. It computes per-segment percentiles over user-anchored turns only, the hold-path rate, the unanswered-turn rate, and how much time Pipecat could not name.
# turn_latency_report.py - illustrative
import json, sys
from collections import defaultdict
import numpy as np

rows = [json.loads(l) for l in open(sys.argv[1])]
lat = [r for r in rows if r["type"] == "latency" and r["anchor"] == "user_silence"]
ends = [r for r in rows if r["type"] == "turn_end"]

def pct(xs, qs=(50, 95)):
    xs = np.asarray([x for x in xs if x is not None and x >= 0]) * 1000
    return np.percentile(xs, qs).round() if len(xs) else None

print(f"answered turns: {len(lat)}  turns ended: {len(ends)}")
print("unanswered or interrupted:",
      round(sum(e["interrupted"] for e in ends) / max(len(ends), 1), 3))
print("total ms p50/p95:", pct([r["total_s"] for r in lat]))

seg = defaultdict(list)
for r in lat:
    for k, v in r["parts_s"].items():
        seg[k].append(v)
for k, v in sorted(seg.items(), key=lambda kv: -np.median(kv[1])):
    print(f"{k:24} n={len(v):4}  p50/p95 ms: {pct(v)}")

hold = [r for r in lat if r["parts_s"].get("turn_detection", 0) > 2.5]
print("hold-path rate (turn_detection > 2.5 s):", round(len(hold) / max(len(lat), 1), 3))
unnamed = [r["parts_s"].get("pipeline", 0) / r["total_s"] for r in lat if r["total_s"]]
print("pipeline (unnamed) share p95:", round(float(np.percentile(unnamed, 95)), 3))
Read it top down. The segment with the largest p95 owns your problem. If `pipeline` is more than a few percent of a turn, something between frames is slow: an event loop blocked by synchronous code in a handler is the usual cause. If `turn_detection` p50 sits near your STT's `ttfs_p99_latency`, you are paying lie number 1.
Measure what the caller hears
The observer stops at the first chunk dequeued. Callers stop waiting when sound reaches their ear. To close that gap you need vantage points beyond the agent, and each one covers a different stretch of the path.
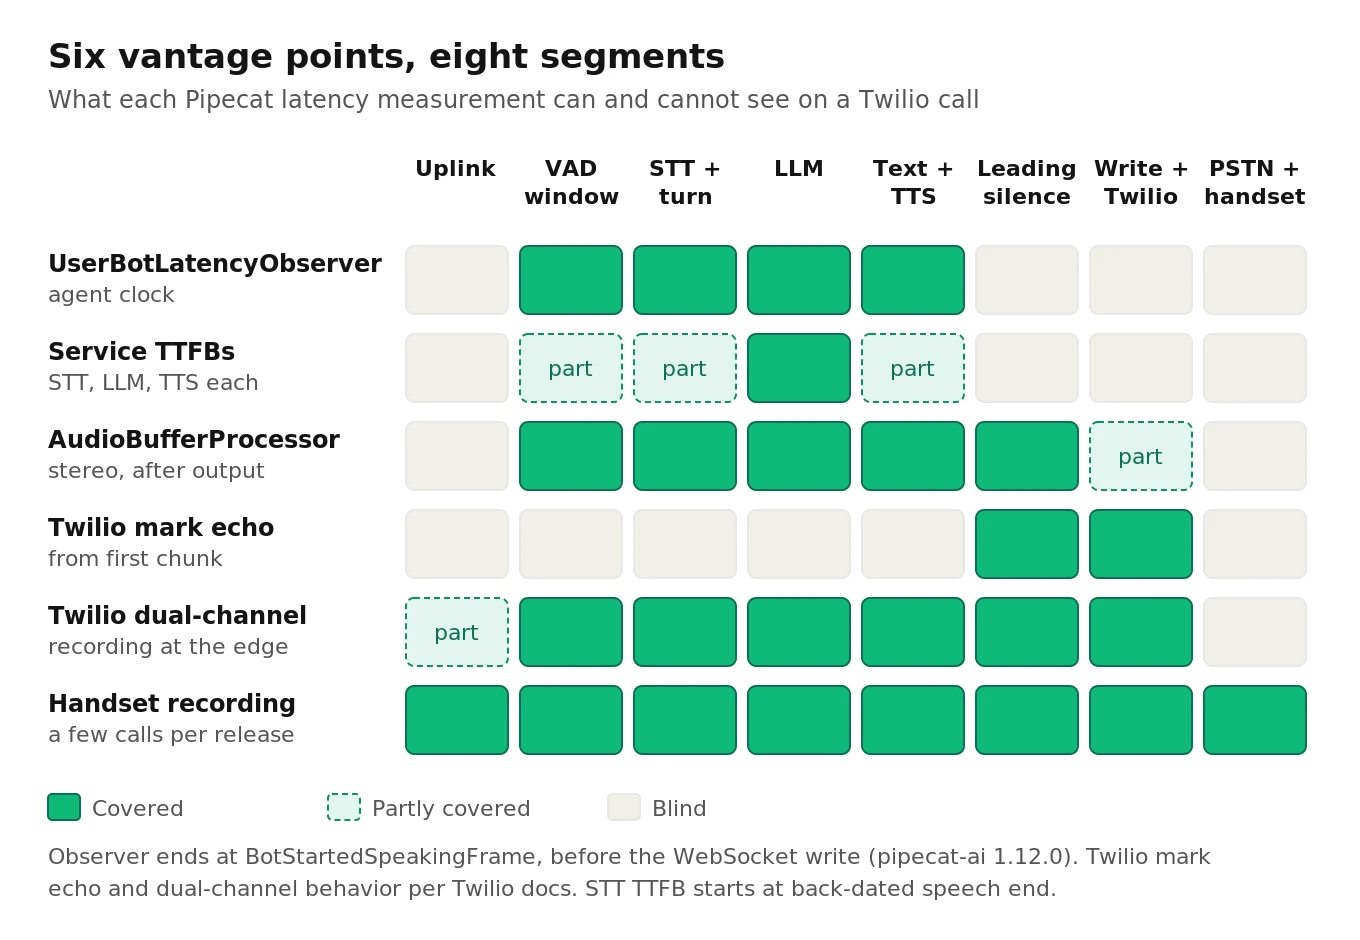
AudioBufferProcessor in stereo. Placed after `transport.output()` with `num_channels=2`, it records user audio on the left and bot audio on the right, inserting silence for wall-clock gaps. It sees what the pipeline sent, so it agrees with the observer plus leading silence. It is a sanity check, not a caller view.
Twilio mark echo. Twilio Media Streams support a `mark` message on bidirectional streams. Per Twilio's docs, you send a mark after media, and Twilio sends back a mark with the same name when the media before it has finished playing. Send `{"event": "mark", "streamSid": "...", "mark": {"name": "t12-first"}}` right after a turn's first audio chunk, and the echo time minus `BotStartedSpeakingFrame` time is the cost of the WebSocket path and Twilio's playout buffer plus that chunk's duration. Pipecat's `TwilioFrameSerializer` in 1.12.0 sends `clear` messages but not marks, so this needs a small custom serializer or transport hook.
Twilio dual-channel recording. Twilio now stores call recordings dual-channel by default, each call leg on its own channel. This is the closest cheap view of what the caller heard, because both channels are captured at Twilio's edge. It still misses the PSTN legs and the handset, so it understates the caller's wait by roughly one uplink plus one downlink.
A handset recording. For a handful of calls per release, record on a real phone. It is the only measurement that includes everything.
The onset detector below works on any two-channel WAV, including a Twilio recording at 8 kHz. It uses an adaptive noise floor, because phone channels carry line noise that a fixed RMS threshold misreads, and it requires a minimum run so clicks and breaths do not count. It is illustrative.
# caller_heard_gaps.py - illustrative onset detection on a 2-channel recording
import numpy as np, soundfile as sf

HOP_MS = 10

def speech_mask(x, sr, open_db=12, close_db=6, min_on_ms=120, min_off_ms=250):
    hop = sr * HOP_MS // 1000
    n = len(x) // hop
    frames = x[: n * hop].reshape(n, hop)
    db = 20 * np.log10(np.sqrt((frames ** 2).mean(axis=1)) + 1e-9)
    floor = np.percentile(db, 10)                    # adaptive noise floor
    on, off = db > floor + open_db, db > floor + close_db
    mask, active, run = np.zeros(n, bool), False, 0
    for i in range(n):
        if not active:
            run = run + 1 if on[i] else 0
            if run * HOP_MS >= min_on_ms:
                active, run = True, 0
                mask[i - min_on_ms // HOP_MS + 1 : i + 1] = True
        else:
            run = 0 if off[i] else run + 1
            if run * HOP_MS >= min_off_ms:
                active, run = False, 0
        mask[i] |= active
    return mask

audio, sr = sf.read("call.wav")                      # ch0 = caller leg, ch1 = agent leg
caller, agent = speech_mask(audio[:, 0], sr), speech_mask(audio[:, 1], sr)
gaps, no_reply = [], 0
ends = np.flatnonzero(caller[:-1] & ~caller[1:]) + 1  # caller stops
for e in ends:
    window = slice(e, min(e + 5000 // HOP_MS, len(agent)))
    starts = np.flatnonzero(agent[window] & ~caller[window])
    resumed = np.flatnonzero(caller[window])
    if len(starts) and (not len(resumed) or starts[0] < resumed[0]):
        gaps.append(starts[0] * HOP_MS)
    elif not len(resumed):
        no_reply += 1                                 # silence for 5 s
print("caller-heard gap p50/p95 ms:", np.percentile(gaps, [50, 95]).round())
print("turns with no reply inside 5 s:", no_reply)
Three cautions. A caller's mid-sentence pause longer than `min_off_ms` registers as a turn end, so review a sample by ear before trusting a run. Turns where the caller resumes speaking before the agent answers are dropped, which is the same survivorship as lie number 4, so report them. And line up the audio gaps with observer rows by order within a call, then compute `caller_gap - observer_total` per turn. That residual is your network, buffer and leading-silence cost, and it should be stable. If it swings by hundreds of milliseconds between calls, look at carrier routing and region placement, which our Pipecat Twilio and Telnyx guide covers.
What the research says about gaps and thresholds
Three findings set the targets and one sets the statistics.
Humans answer fast, and not evenly. Stivers et al. (PNAS, 2009) measured question-response timing across 10 languages. Every language showed a unimodal distribution with a mode between 0 and 200 ms, an overall mode of 0 ms, and medians from 0 ms to 300 ms. Even a well-tuned cascaded phone agent at 1 second caller-heard is several times slower than the human norm. Callers notice, and the target should be the tightest p50 you can reach without cutting people off.
Gap distributions are skewed, so means mislead. Heldner and Edlund (Journal of Phonetics, 2010) analyzed pauses, gaps and overlaps across three conversational corpora and argued that turn-taking is less precise than often claimed, with methodological consequences for how such distributions are treated statistically. For agent work that translates directly: report percentiles, not averages, and do not compare a mean against a human median.
There is a cliff. Maslych et al. (CUI 2025) studied response delays with LLM-powered virtual agents and found that latency above 4 seconds degraded quality of experience, while natural conversational fillers improved perceived response time, especially at high delays. Pipecat's hold path (3 s plus LLM and TTS) and fallback path (5 s) both put turns at or past that line.
Tails compound across a call. Dean and Barroso's The Tail at Scale (CACM, 2013) showed that when one request fans out to many servers, rare slow responses become common at the request level. A call is the same shape in time. If each turn independently has a 5% chance of exceeding your p95, the chance a 10-turn call contains at least one such turn is `1 - 0.95^10 = 40.1%`. At 20 turns it is 64.2%. Your p95 turn is something most long calls will experience.
A worked latency budget for an 8 kHz phone call
Here is one Pipecat turn on a Twilio call, with the default VAD and Smart Turn. Every per-hop number is an illustrative assumption, not a measurement; replace each with your own p50 from the report above. The config values (0.2 s VAD, 3 s Smart Turn hold, the STT p99s) are the 1.12.0 defaults.
| Segment | Observer key | Scenario A: Deepgram, fast path | Scenario B: non-finalizing STT | Scenario C: Smart Turn hold |
|---|---|---|---|---|
| Uplink, handset to your server | not visible | 100 ms (assumed) | 100 ms | 100 ms |
| VAD silence window | `endpointing_wait` | 200 ms (config) | 200 ms | 200 ms |
| Finalize round trip | `transcription` | 120 ms (assumed) | folded into wait | 120 ms |
| Turn release | `turn_detection` | 10 ms (assumed) | to 1,660 ms after speech end (p99 deadline) | to 3,000 ms after speech end (hold) |
| LLM first chunk | `llm_inference` | 380 ms (assumed) | 380 ms | 380 ms |
| First sentence | `sentence_aggregation` | 180 ms (assumed) | 180 ms | 180 ms |
| TTS first chunk | `speech_synthesis` | 160 ms (assumed) | 160 ms | 160 ms |
| Observer total | sum | 1,050 ms | 2,380 ms | 3,720 ms |
| Leading silence | not visible (TTFA) | 40 ms (assumed) | 40 ms | 40 ms |
| Write, Twilio, carrier, jitter buffer | not visible | 170 ms (assumed) | 170 ms | 170 ms |
| Caller-heard | 1,360 ms | 2,690 ms | 4,030 ms |
Scenario B's arithmetic: with OpenAI Realtime STT's built-in p99 of 1.66 s, the LLM request cannot start before 1,660 ms after speech end. Add 380 + 180 + 160 = 720 ms and the observer reads 2,380 ms. Scenario C: a 3,000 ms hold plus the same 720 ms gives 3,720 ms. Add the 310 ms the agent cannot see and the caller waits just over 4 seconds, past the Maslych threshold.
Two 8 kHz details belong in the budget. `PipelineParams` defaults to 16 kHz in and 24 kHz out. On a Twilio call the serializer converts to and from 8 kHz mu-law with a stream resampler, so the TTS synthesizes three times the samples the caller can hear, and the resampler runs on every chunk. Setting `audio_in_sample_rate=8000` and `audio_out_sample_rate=8000` asks the TTS for phone-rate audio directly. And Smart Turn's analyzer is fed at your input rate; check that your turn model behaves at 8 kHz on real phone audio before trusting its verdicts. The low-latency TTS guide covers provider-side output formats.
Symptom to segment to fix
| Symptom | Segment to check | Likely cause | Fix |
|---|---|---|---|
| Every turn waits about the same long time | `turn_detection` p50 near STT p99 | Non-finalizing STT safety-net deadline | Measure TTFS with stt-benchmark and set `ttfs_p99_latency`; switch to a finalizing STT |
| p50 fine, p95 near 3.5 to 4 s | `turn_detection` hold-path rate | Smart Turn says incomplete on short answers | Tune the turn model or strategy for yes/no and digit turns |
| Rare 5 s turns | `turn_detection`, no transcript | `user_turn_stop_timeout` fallback | Check STT connection, keepalive and mute strategies |
| Low TTS TTFB, slow turns | `sentence_aggregation` | Long first clause in SENTENCE mode | Prompt a short opening clause; test `TextAggregationMode.TOKEN` |
| LLM TTFB jumped after upgrade | `llm_inference`, Pipecat version | 1.8.0 TTFB definition change | Re-baseline; compare caller-heard instead |
| Thinking model feels slow | TTFAT `thinking_time` | Reasoning tokens before the answer | Lower reasoning effort or route simple turns to a faster model |
| High `pipeline` share | `pipeline` contribution | Blocked event loop, slow custom processor | Move synchronous work off the loop |
| Turns with tools are slow | `llm_tool_call`, `function_handler` | Tool latency plus a second inference | Speak a filler first; cache; parallelize tools |
| Observer fine, callers complain | caller-heard minus observer | Leading silence, region, carrier | Check TTFA; co-locate bot near Twilio edge and model regions |
| First turn of every call slow | `measured_from: client_connected` | Cold process or first connections | Warm reserve agents; pre-connect services |
For deployment-side fixes such as warm pools and region placement, see deploying Pipecat in production.
p50, p95 and how many turns you need
Percentiles from small samples are noisy, and voice turns are not independent. Two pieces of math decide how many test calls a release gate needs.
Order-statistic uncertainty. The rank of the true p95 in a sorted sample of n turns is approximately normal with mean `0.95n` and standard deviation `sqrt(n x 0.95 x 0.05)`. The 95% band for where your measured p95 really sits:
| Answered turns (n) | Rank band | Percentile band |
|---|---|---|
| 100 | 91 to 99 | 91st to 99th |
| 200 | 184 to 196 | 92nd to 98th |
| 400 | 371 to 389 | 93rd to 97th |
| 1,000 | 936 to 964 | 94th to 96th |
For p99, n = 400 gives ranks 392 to 400, so the "p99" is pinned against the maximum. Do not report p99 below roughly a thousand turns.
Turns within a call are correlated. The same caller, network path and context make turns in one call alike. The design effect is `1 + (m - 1) x rho`, with m turns per call and rho the intra-call correlation. As an illustrative assumption, take m = 10 and rho = 0.3: the design effect is 3.7, so 400 turns from 40 calls carry the information of about 108 independent turns. That is why the protocol below asks for many calls rather than many turns per call, and why comparisons should bootstrap whole calls.
How to test Pipecat latency before every release
A latency number is only useful if you measure it the same way twice. This protocol produces comparable numbers across builds.
1. Pin the stack. Record the `pipecat-ai` version, VAD params, stop strategy and turn model, each service's `ttfs_p99_latency`, text aggregation mode, model names, regions and sample rates. Any change is a new baseline.
2. Build a scripted turn set. At least 50 calls of 8 to 12 turns, so 400 to 600 answered turns. Mix one-word answers, digits and names (hold-path triggers), long multi-clause requests, tool-calling turns and plain turns. Pipecat's own scripted scenarios can drive this in audio mode; their `within_ms` budgets are anchored at the moment the turn's input was sent, so set them as utterance length plus your target. Our Pipecat testing guide covers the rest of the harness.
3. Run over the real phone path. Place the calls through your Twilio or Telnyx number, not just a local WebRTC client. Run once at single-call load and once at target concurrency. Keep greeting turns in their own bucket.
4. Collect four vantage points. The observer JSONL, service records, the Twilio dual-channel recording for every call, and handset recordings for five calls.
5. Compute the report. Per-segment p50 and p95, unanswered-turn rate, hold-path rate, `pipeline` share, TTFA leading silence, caller-heard p50 and p95, and the caller-minus-observer residual.
6. Apply thresholds. These are starting points we suggest, not an industry standard. Tune them to your use case.
| Check | Pass threshold |
|---|---|
| Observer total, user-anchored, p50 / p95 | 1,100 ms / 1,900 ms or better |
| Caller-heard (Twilio recording) p50 / p95 | 1,400 ms / 2,300 ms or better |
| Caller-heard turns above 4 s | 1% or fewer |
| Hold-path rate (`turn_detection` above 2.5 s) | 8% or less |
| Unanswered or interrupted turn rate | Report it; investigate any rise above baseline |
| `pipeline` share of a turn, p95 | 5% or less |
| Caller-minus-observer residual, p95 minus p50 | 150 ms or less |
| Metric coverage (answered turns with a breakdown) | 97% or more |
7. Compare builds on distributions. Bootstrap the difference in caller-heard p95 between baseline and candidate by resampling whole calls, 2,000 iterations. Ship only if the 95% interval excludes a regression larger than your tolerance, for example 150 ms.
Store each run's JSONL next to its recordings. Our guide on call recording metrics for LiveKit and Pipecat and what to log on every voice agent call cover retention and fields.
Where independent evaluation fits
Everything above runs on your own infrastructure, and you should run it. The weak spot is coverage. A team tests the paths it just changed, from its own network, at low load, with callers who speak the way the team does. The hold-path short answer from a real caller, the carrier route that adds 300 ms, and the model update that quietly lengthened first sentences are what slip.
That is where Evalgent fits. We place independent, scripted calls through your actual phone numbers, measure caller-heard response time per turn from the recording, and score the same calls for conversational quality, so a faster agent that interrupts more does not pass as an improvement. Teams use it for a pre-launch audit, for comparing STT, LLM and TTS vendors on identical scripted calls, and as a regression gate between Pipecat releases. It does not replace your observers. It tells you whether the number in your logs is the number your callers live with.
Frequently asked questions
Why do Pipecat TTFBs add up to less than the response time?
They start on different clocks and skip stretches. STT TTFB runs from speech end, LLM TTFB from the request, TTS TTFB from the first full sentence. The VAD window, turn-detection wait, sentence aggregation and leading silence sit between or outside them. Use UserBotLatencyObserver contributions, which tile the whole interval instead.
What does UserBotLatencyObserver measure in Pipecat?
It measures from the back-dated moment the user stopped speaking (VAD timestamp minus stop_secs) to BotStartedSpeakingFrame, when the output transport dequeues the first audio chunk. With enable_metrics on, its on_latency_breakdown event splits that interval into named contributions that sum to the total, available since 1.9.0.
What does Pipecat STT TTFB actually measure?
It measures from when the user stopped speaking, back-dated by VAD stop_secs, to the finalized transcript. If the service does not mark transcripts finalized, Pipecat waits stt_ttfb_timeout (2.0 seconds by default) and measures to the last transcript seen. It is skipped entirely when stop_secs is zero.
Why does my Pipecat bot always wait over a second before answering?
Check the turn_detection contribution. With the default Smart Turn stop strategy, a streaming STT that does not mark transcripts finalized makes every turn wait until speech end plus the service's ttfs_p99_latency, for example 1.66 seconds for OpenAI Realtime STT. Measure your real p99 and set it, or use a finalizing STT.
Is enable_turn_tracking on by default in Pipecat?
Yes. In pipecat-ai 1.12.0, PipelineWorker defaults enable_turn_tracking to True and enable_tracing to False. Tracing also requires the OpenTelemetry packages; if they are missing, tracing is silently disabled. The turn span records turn.user_bot_latency_seconds, but not the per-stage breakdown.
Does Pipecat measure latency for interrupted turns?
No. The observer emits only when the bot starts speaking, and an InterruptionFrame clears its per-turn data. Turns where the caller gave up or the bot never answered produce no latency row. Report an unanswered or interrupted turn rate alongside latency so a worsening experience cannot look like an improvement.
How do I measure what a Twilio caller actually hears?
Use Twilio's dual-channel call recording, which stores each leg on its own channel, and detect the gap between caller speech ending and agent speech starting. Compare it per turn with the observer total. The difference is leading silence, the WebSocket path, Twilio buffering and part of the network, and it should be stable.
How many test turns do I need for a reliable p95?
At least 400 answered turns spread over 40 or more calls. At 400 turns the measured p95 sits between roughly the true 93rd and 97th percentiles. Turns within a call are correlated, so more calls with fewer turns beat fewer long calls. Avoid reporting p99 below about a thousand turns.
The bottom line
Pipecat latency is measurable stage by stage once you treat UserBotLatencyObserver contributions as the source of truth, read each TTFB on its own clock, and watch the turn-detection wait for the p99 tax and the 3 second hold. Then hold the agent's number up against a two-channel call recording on every release, because the only latency that counts is the one the caller hears.
Related Articles
How to automate voice agent testing: synthetic callers vs manual QA
Learn how ai test automation replaces manual QA for voice agents. Compare synthetic callers vs human testers, with a 5-step framework to scale without hiring.
Read more
AI Agent Testing vs Voice Agent Testing: What General Tools Miss for Voice
AI agent testing measures text outputs. Voice agent testing measures behaviour through an acoustic pipeline. Five failure categories general tools miss.
Read more