Test your voice agent
Benchmark Values for Voice Agent Metrics
# Benchmark values for voice agent metrics
Quick answer
> Quick answer: Voice agent metric benchmarks are the target ranges teams treat as "good" for numbers like containment, resolution, and latency. No single number is good for everyone. The right range depends on your use case, caller mix, and metric definition, so measure your own baseline first, then improve against it.
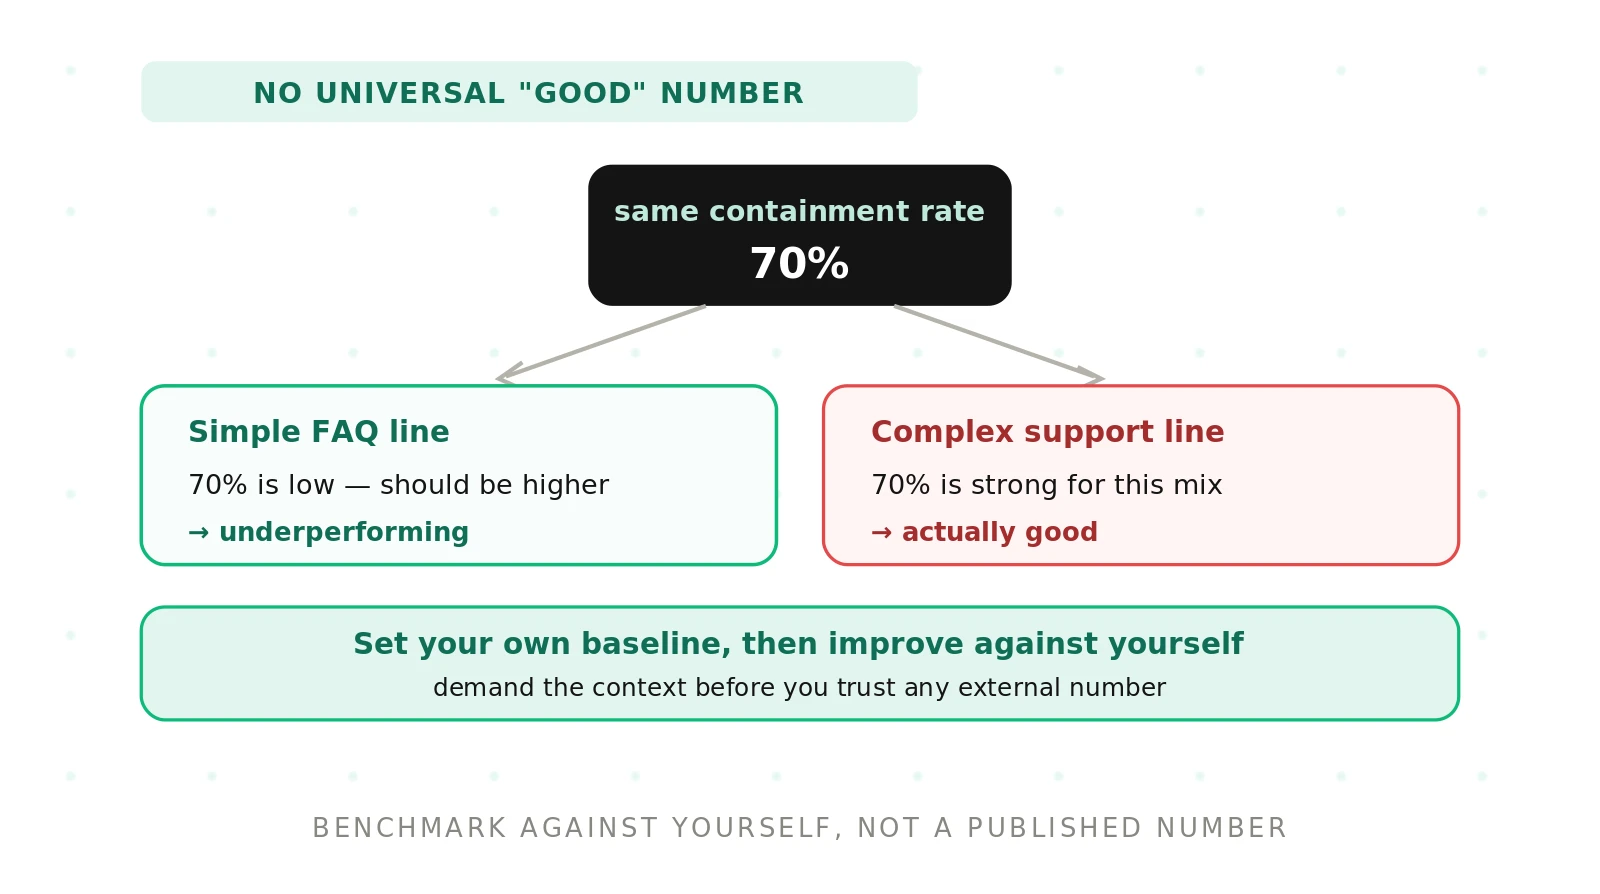
Everyone wants one number. What is a good containment rate? What latency should we hit? What resolution rate proves the agent works? The question is natural. The answer is a trap.
A number that is excellent for one deployment is poor for another. The same "85 percent" can mean success on easy calls and failure on hard ones. This post explains why published voice agent metric benchmarks mislead, what actually drives a good range, and how to set a baseline you can trust. Evalgent is an independent evaluator, so our stake is in honest numbers, not flattering ones.
Why published benchmark numbers mislead
A published benchmark is one company's result on one workload. It is not a law of nature. Copy their number as your target and you inherit assumptions you cannot see.
Start with benchmarking itself. A benchmark only transfers when the two settings match. Voice deployments rarely match. Your callers, tasks, and channels differ from theirs. So their good is not your good.
Definitions differ too. Two teams both report "containment," and mean different things. One counts any call that avoids a transfer. One counts only genuine resolutions. The label is identical. The math is not. Our containment versus deflection guide shows how far these definitions drift apart.
Selection also skews the number. Published results often come from favorable slices. That is selection bias at work. A vendor reports the metric on calls that flatter it, not the calls that stress it. We cover this pattern in depth in why you can't trust vendor-reported metrics.
There is a deeper problem. Once a benchmark becomes the number people compete on, it stops measuring what it meant to. That is Goodhart's law. A team can lift the score without improving the outcome behind it. So a high published number can hide a worse experience.
What actually drives a "good" range
A metric's good range is not fixed. It moves with the work. The same agent looks strong or weak depending on who calls and what they ask. Four forces move the range most.
Use case. A password reset is simple. An insurance claim is not. Higher difficulty lowers what counts as a good containment or resolution rate.
Caller mix. Accents, devices, and background noise shift transcription accuracy and success. A clean caller base and a noisy one are not comparable.
Difficulty and intent spread. A narrow menu of intents is easier than an open one. The wider the tail of requests, the lower the achievable rate.
Metric definition. The numerator and denominator decide the number. A generous definition inflates it. A strict one deflates it. Same agent, different figure.
The table below maps common metrics to what drives their range and why a cross-company comparison fails.
| Metric | What drives its "good" range | Why cross-company comparison fails |
|---|---|---|
| Containment rate | Task difficulty, intent spread, what counts as "contained" | One team counts non-transfers, another counts real resolutions |
| Resolution rate | How "resolved" is defined, verification method, use case | Definitions of success and how it is confirmed differ widely |
| Latency (p95) | Channel, region, model stack, network path | Averages hide tails; measurement points and percentiles differ |
| Transcription accuracy | Accents, noise, domain vocabulary, scoring method | Clean read-aloud audio scores far higher than live noisy calls |
| Average handle time | Call complexity, whether success is required to "end" | Fast can mean efficient or can mean abandoned mid-task |
| Escalation rate | Routing rules, what triggers a transfer, caller patience | A low rate can mean good handling or trapped callers |
| CSAT | Survey wording, response rate, when the survey fires | Sampling and selection bias make scores incomparable |
Read the table one way. Every "good" number is conditional. Change a condition and the range moves. That is why a leaderboard row cannot be your target.
About those illustrative ranges
People still want a ballpark. Here is one, clearly labeled illustrative and not a target.
Containment often lands somewhere in a wide band across deployments. Latency comfort thresholds trace back to human conversation research, such as the ITU-T G.114 150 ms one-way guidance. Transcription accuracy varies enormously with noise. These are not benchmarks to hit. They are order-of-magnitude context.
Treat any single figure with suspicion. A range without conditions attached is decoration. Do not set a goal from it. Use it only to know whether your own number is wildly off, then measure properly on your data.
The pull toward one clean number is strong. Executives want a target. Boards want a comparison. Vendors are happy to supply both. But a target borrowed from another deployment sets you up to chase the wrong thing. You can hit their number and still lose your calls. You can miss their number and still serve your callers well. The figure that matters is yours, measured your way.
How to establish your own metric baselines
The fix for benchmark envy is a baseline). Measure where you are today. Improve against that, not against a stranger's slide. The steps below build one you can defend.
1. Pick metrics that map to outcomes. Choose the few numbers tied to real results. A key performance indicator earns its place only if it moves a decision. Anchor them to a north-star metric.
2. Define each metric precisely. Write the numerator and denominator down. State what counts and what does not. Ambiguity here breaks every later comparison.
3. Sample representative calls. Pull calls from real traffic across time. Good sampling) matches production, not a hand-picked few. Build this on your own data.
4. Measure the current number and its spread. Report the central value and the tail. Use percentiles for latency. A single average hides the calls that hurt.
5. Record the baseline with its context. Save the date, the call mix, the definition, and the sample size. Context is what makes the number reusable later.
6. Set a target as an improvement. Aim to beat your own baseline by a stated amount. Confirm the gain is real with statistical significance, not noise.
7. Re-measure on a fixed cadence. Repeat monthly or per release. Watch for drift. A baseline is a living reference, not a one-time reading.
This is the core of voice agent evaluation: a stable, defined, repeatable measurement on your own traffic. A metrics scorecard keeps the whole set honest in one place.
What context to demand before trusting a benchmark
Never accept a benchmark number bare. Ask for the context that makes it meaningful. If the answer is vague, treat the number as marketing.
Demand the definition. What exactly did they count? Demand the population. Which calls, from what caller mix, in what conditions? Demand the sample size and the spread, not just the headline average. Demand the measurement method and where in the call it was taken. And demand the date, because agents and traffic change.
A trustworthy number survives these questions. A fragile one does not. This is the same discipline behind independent evaluation: the number is only as good as the method that produced it.
Sanity-checking a claimed benchmark number
Even with context, run a quick gut check. Does the definition match yours? If not, the numbers are not comparable, full stop. Is the metric reported alone? A containment rate without a resolution rate beside it is a warning sign. Is the sample large enough to be stable? A tiny sample swings wildly and proves nothing.
Look for the missing tail. Averages flatter. A good average with an ugly percentile tail means many callers had a bad experience. Look for the difficulty. A great number on easy calls says little about your hard ones. When a claim skips these, assume the best case was chosen and the rest omitted.
Measure against yourself, not the field
The competitor to beat is last month's version of your own agent. That comparison is fair by construction. Same callers, same tasks, same definitions. Progress there is real progress, not a definition trick.
Comparing across companies rarely is fair. The conditions differ in ways you cannot control or even see. So use external numbers as loose background, never as a target. The question that matters is not "are we good versus them." It is "are we better than we were, on the calls we actually get." That framing turns testing into evaluation and evaluation into improvement.
Frequently asked questions
What is a good containment rate for a voice agent?
There is no universal good containment rate. It depends on task difficulty, caller mix, and how you define a contained call. A high rate on simple calls means little on complex ones. Measure your own baseline on representative traffic, pair it with resolution rate, then improve against that baseline instead of a published figure.
Why can't I compare my voice agent metrics to another company's?
Because the conditions differ. Their callers, tasks, channels, and metric definitions are not yours. A "containment rate" can count non-transfers for one team and real resolutions for another. Selection bias also skews published numbers toward favorable slices. Comparable numbers require identical definitions and populations, which cross-company comparisons almost never have.
How do I set a baseline for voice agent metrics?
Pick a few outcome-linked metrics and define each precisely. Sample representative calls from real traffic across time. Measure the central value and the tail, using percentiles for latency. Record the number with its date, definition, and sample size. Then set targets as improvements over that baseline and re-measure regularly.
What is a good latency for a voice agent?
It depends on channel and region, so there is no single target. Conversation research like ITU-T G.114 gives a 150 ms one-way comfort guide as context, not a benchmark. Judge latency at the tail, such as the 95th percentile, against your own callers. A strong average with a bad tail still frustrates many callers.
Are published voice AI benchmarks reliable?
Treat them as loose background, not targets. Published numbers reflect one workload, one set of definitions, and often a favorable sample. Once a benchmark becomes competitive, teams optimize the score rather than the outcome, per Goodhart's law. A benchmark is reliable for you only when its conditions match yours, which is rare.
What context should I demand before trusting a benchmark number?
Ask for the exact definition, the call population and caller mix, the sample size, and the spread rather than just the average. Ask how and where in the call it was measured, and the date it was collected. A number that survives these questions is trustworthy. One that cannot answer them is marketing.
How often should I re-measure my voice agent baselines?
Re-measure on a fixed cadence, such as monthly or per release. Voice agents and caller traffic both drift over time, so a stale baseline misleads. Regular measurement catches regressions early and confirms that gains are real. Keep the definition and sampling method constant across runs so the comparison stays fair.
Should I use percentiles or averages for voice agent metrics?
Use both, but lead with percentiles for anything tail-sensitive like latency. An average hides the worst calls, and those calls are what callers remember. Report a percentile such as p95 alongside the mean. Confirm any change is real with statistical significance rather than reacting to normal run-to-run noise.
The bottom line
No single benchmark number is "good" for every voice agent. Measure your own baseline on real calls, then improve against it.
Chasing a stranger's number rewards the wrong thing and hides the calls that fail. Evalgent measures your metrics on your own traffic, with definitions you can defend to finance and compliance. Book a demo for an independent, defensible read on where your agent really stands.
Related Articles
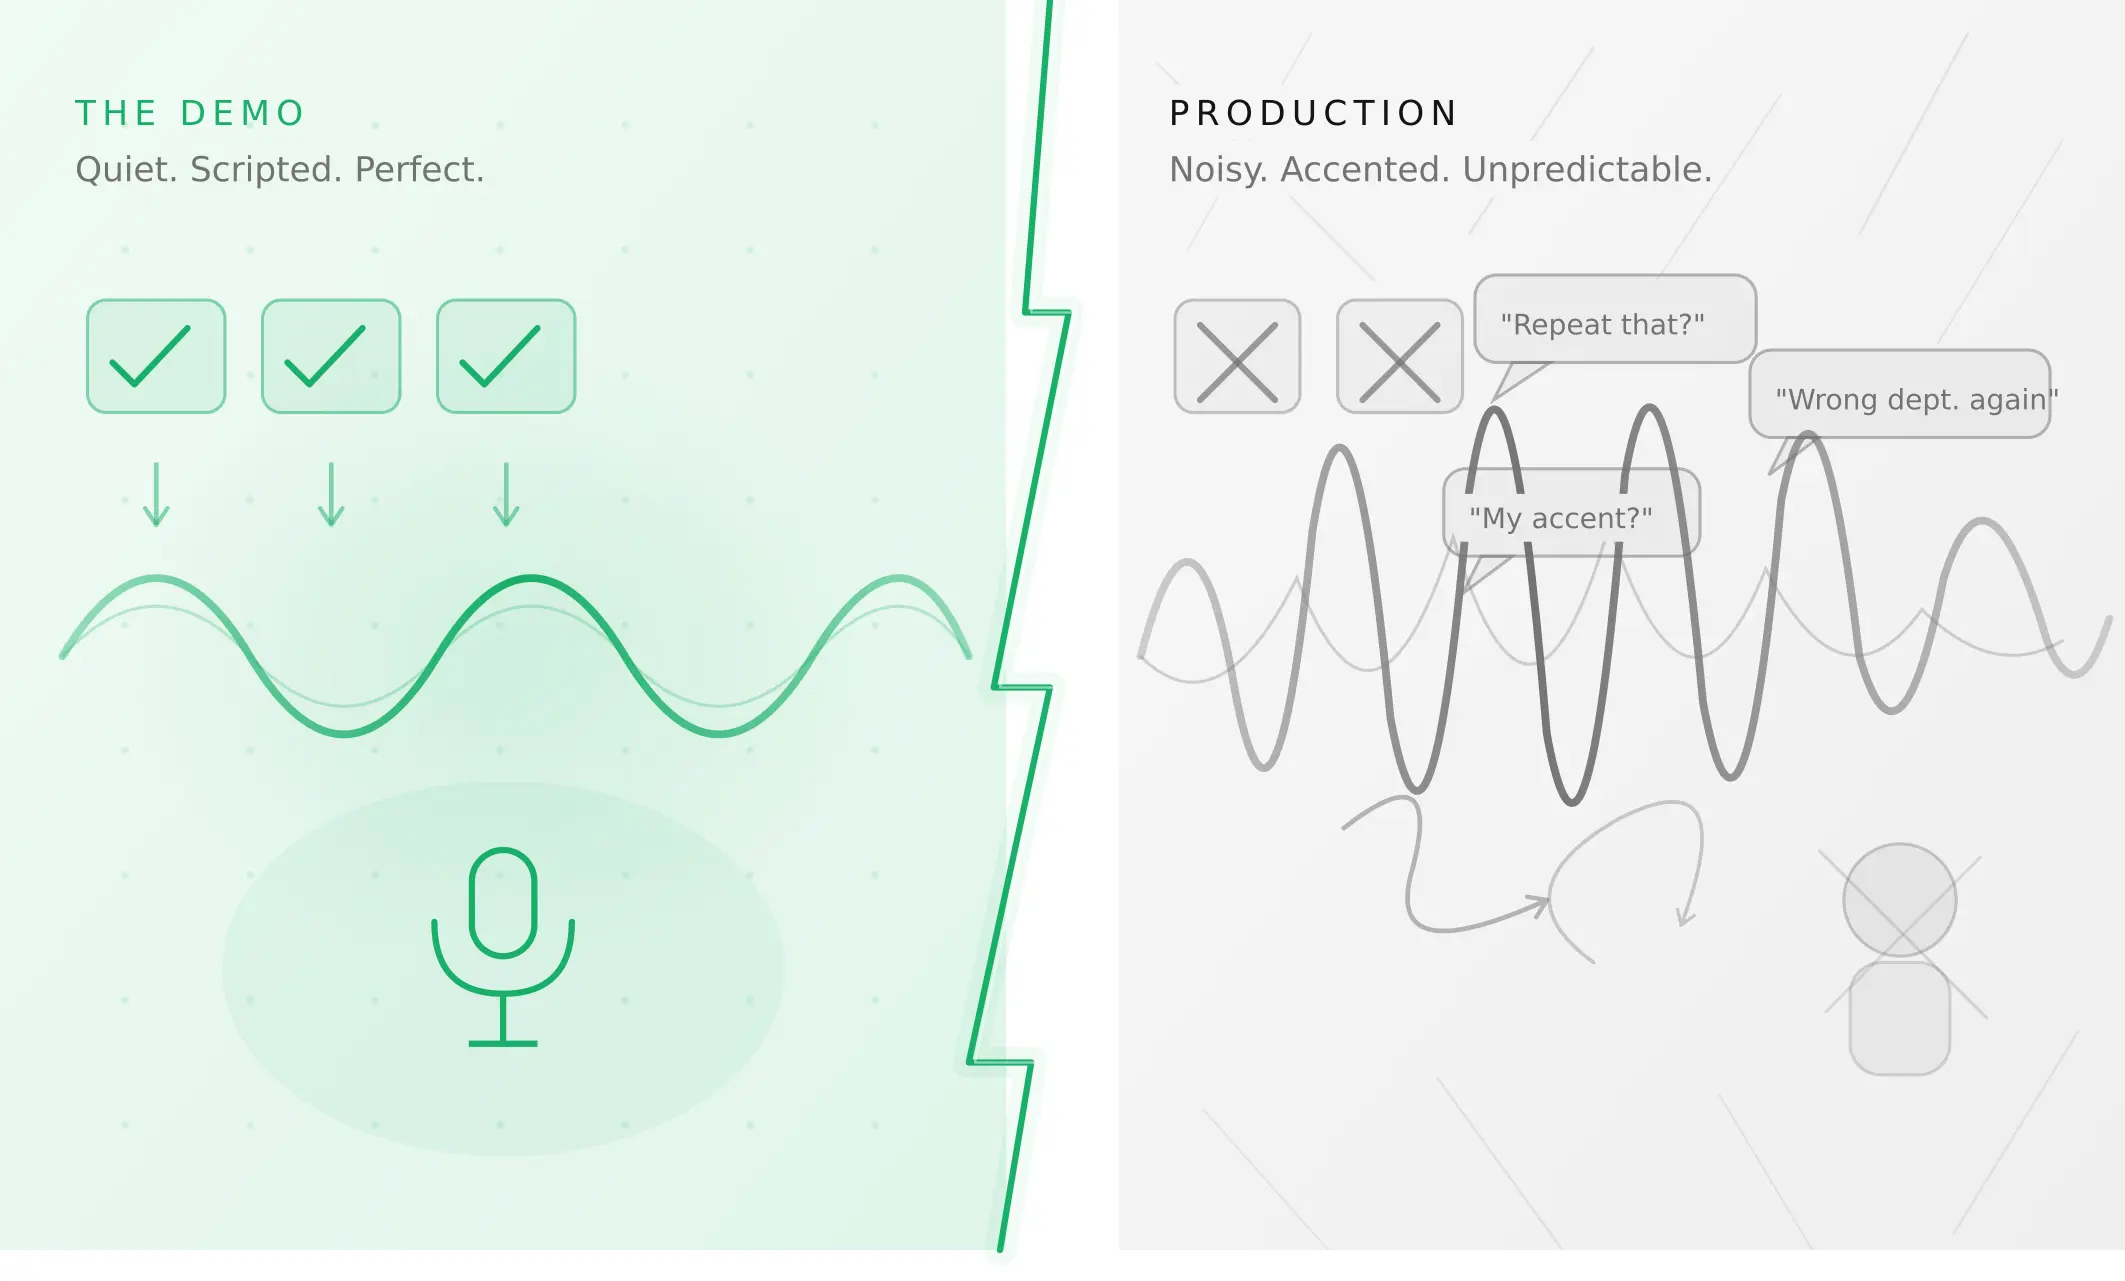
Why AI voice agents fail in production (and how to prevent it)
AI voice agents that ace demos still break in production. Learn the 5 root causes, how to test for each, and what production readiness actually means.
Read more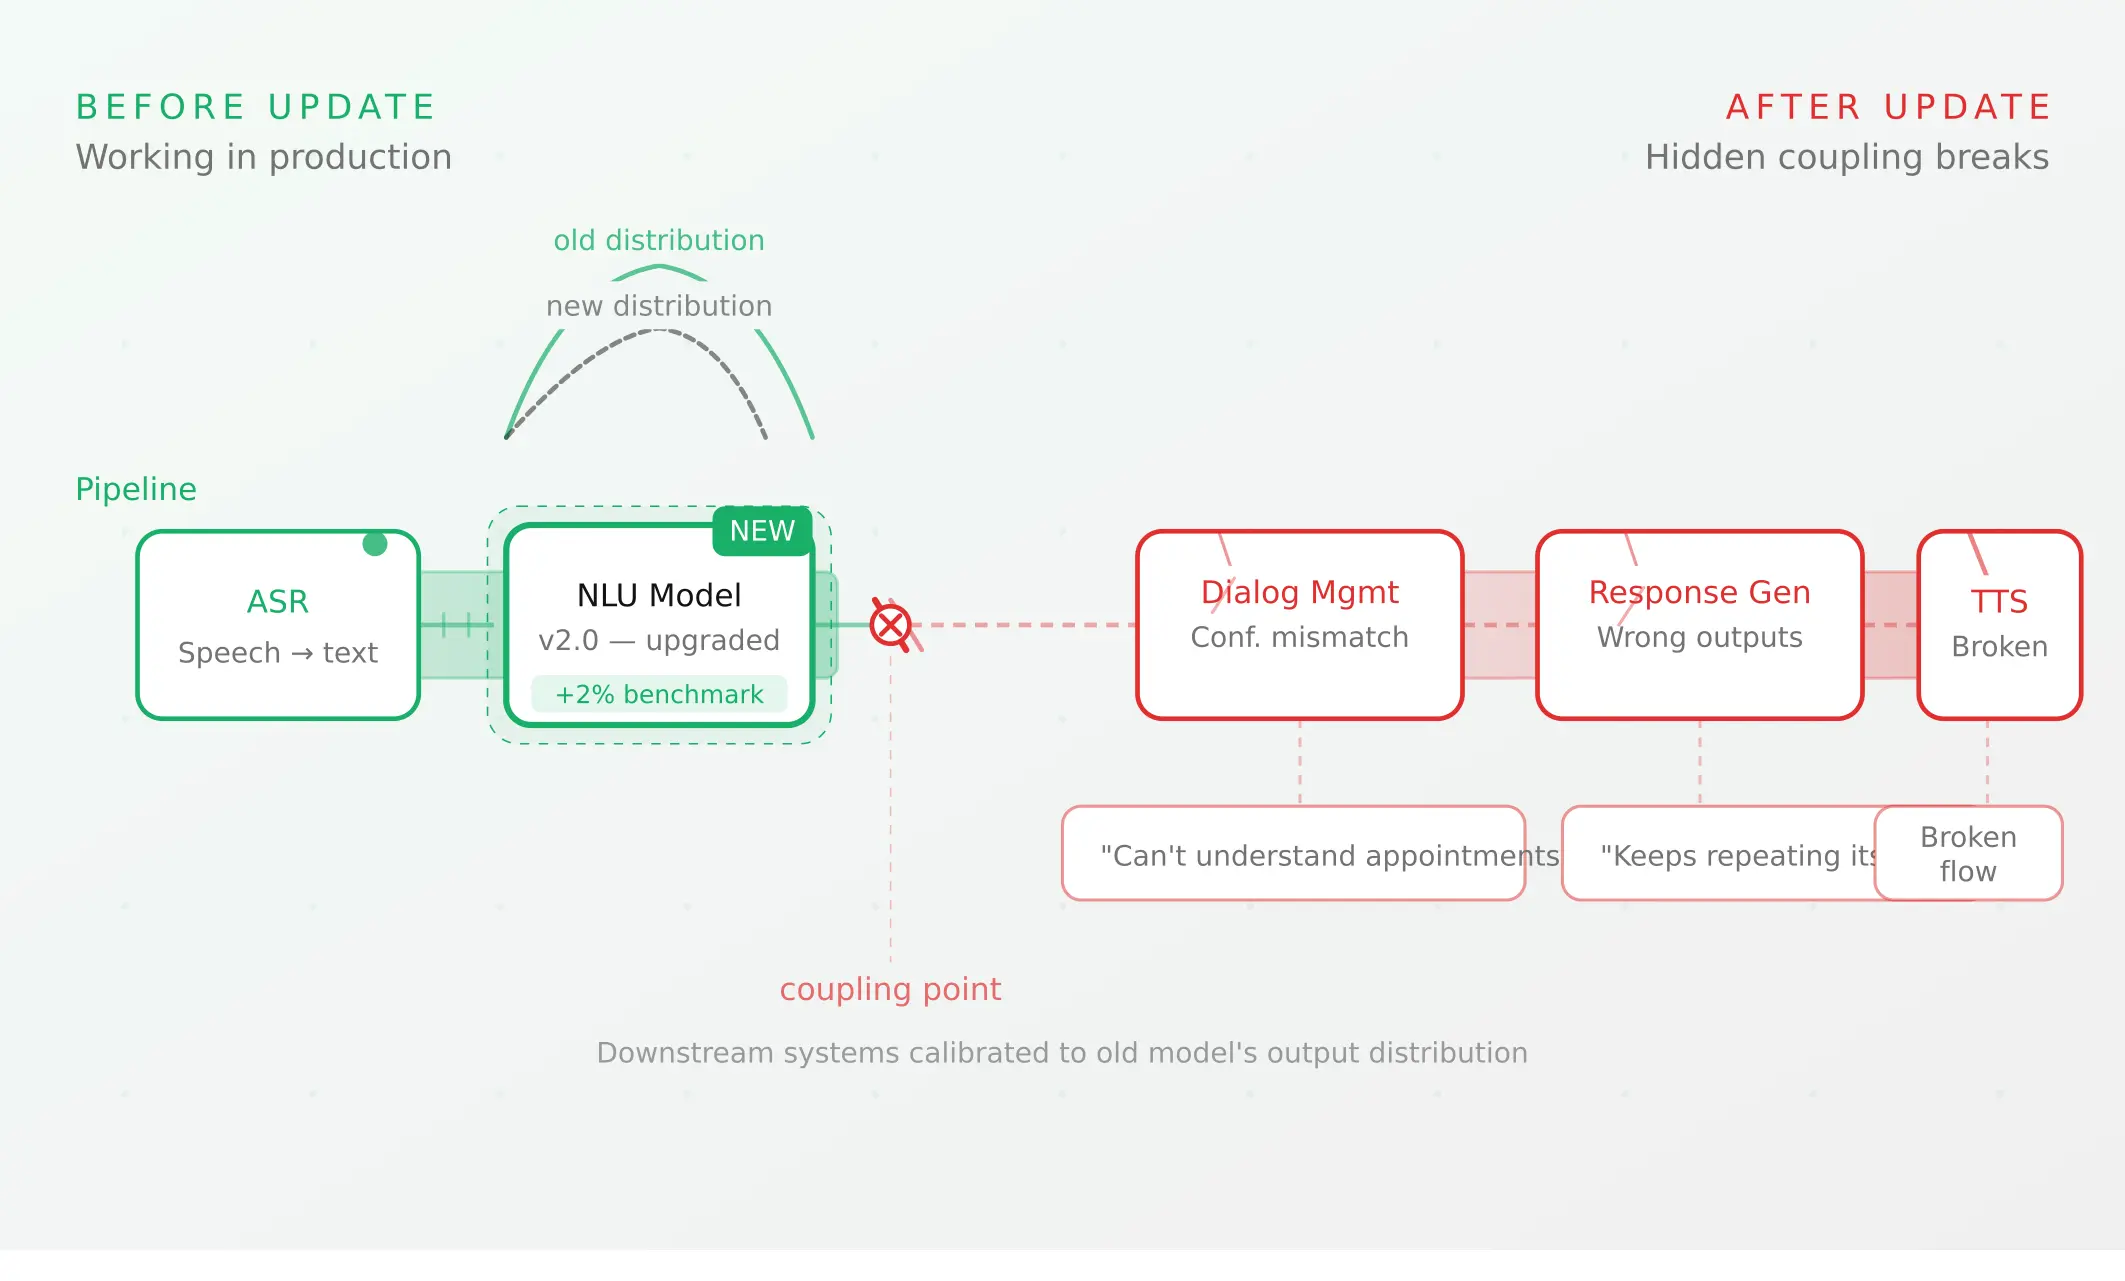
Voice agent regression testing: why LLM updates break production
LLM updates improve benchmarks but break voice agents in 5 predictable ways. How to detect and prevent regressions after every model or prompt change.
Read more