OpenTelemetry Collector for Voice Agents: Routing, Redaction and Batching
On this page
A voice agent already emits spans. The harder question is where they go next. Sending them straight from each service to one vendor works on day one. It gets awkward when you add a second backend, mask a field, or survive a backend outage. The Collector is the control point for all three.
This post is vendor-neutral. It covers the OpenTelemetry Collector voice agents need as that control point: receivers, processors, exporters, agent and gateway deployment, routing one stream to several backends, and what long calls do to a Collector. Every component name, default and stability level comes from the official docs and READMEs, as read on November 21, 2026. Check them again before you deploy, because this project moves fast.
We keep the overlap with earlier posts small. For why tracing matters, see OpenTelemetry observability for voice agents. For span design, see the trace and span model and span attributes. For what to mask, see PII redaction in logs and traces. Here we cover the Collector config that enforces those choices.
Evalgent Observe, which is launching, ingests data in OpenTelemetry format from any stack. It is never in the media path, so nothing touches live audio. A Collector is one clean way to feed it, and to feed your other tools at the same time.
Why put a Collector between the agent and the backend
The OpenTelemetry docs describe the Collector as a vendor-agnostic way to receive, process and export telemetry data. They also list the alternative: no Collector at all, where the SDK exports straight to a backend.
That page is candid about the trade. Skipping the Collector is simple and adds no moving parts. But it needs code changes whenever collection or processing needs change. It also couples your application code to one backend. Each language SDK supports only a limited set of exporters.
Voice teams tend to hit three needs together: a second destination, a mask you can change without a deploy, and a backend restart that does not cost the calls in flight. A Collector handles all three in config, at the cost of one more service. The gateway docs list it plainly: one more thing to maintain, added latency when Collectors cascade, and higher resource use.
The parts: receivers, processors, exporters and connectors
The configuration docs name four pipeline component classes: receivers, processors, exporters and connectors. Extensions sit beside them and add capabilities such as health checks. Nothing runs until you list it in a pipeline under service.
A pipeline has a type: traces, metrics or logs. It holds receivers, optional processors and exporters. The same receiver can feed several pipelines, and several pipelines can share an exporter.
The table lists the components this post uses. Stability comes from each README on November 21, 2026.
| Component | Role in a voice stack | Stability | Ships in |
|---|---|---|---|
otlp receiver | Takes OTLP over gRPC or HTTP | Stable for traces, metrics, logs | core, contrib, k8s |
memory_limiter processor | Refuses data before the Collector runs out of memory | Beta for traces, metrics, logs | core, contrib, k8s |
batch processor | Groups data into batches | Beta for traces, metrics, logs | core, contrib, k8s |
redaction processor | Keeps allowed attribute keys, masks values | Beta for traces, alpha for logs and metrics | contrib, k8s |
transform processor | Rewrites telemetry with OTTL statements | Beta for traces, metrics, logs | core, contrib, k8s |
tail_sampling processor | Keeps or drops whole traces by policy | Beta for traces | contrib, k8s |
routing connector | Sends data to pipelines by condition | Alpha | contrib, k8s |
load_balancing exporter | Pins a trace to one Collector | Beta for traces and logs | contrib, k8s |
| OTLP gRPC and HTTP exporters | Send OTLP onward | Stable for traces, metrics, logs | core, contrib, k8s |
Two lessons sit in that table. First, much of what voice teams want, such as redaction, tail sampling and routing, is not in the core distribution. You need the contrib or k8s build, or a custom build. Second, several useful parts are alpha or beta. Pin your Collector version and re-read the README at each upgrade.
One naming trap. The current READMEs call the exporters otlp_grpc and otlp_http. Other docs pages still show otlp, and the OTLP HTTP README says the old otlphttp name is a deprecated alias. Run otelcol validate against your own binary before you trust any snippet, including ours.
OpenTelemetry Collector processors: the order that works
Order is the easiest thing to get wrong. The processor README says order matters and gives the best-practice sequence. It also says no processors are on by default.
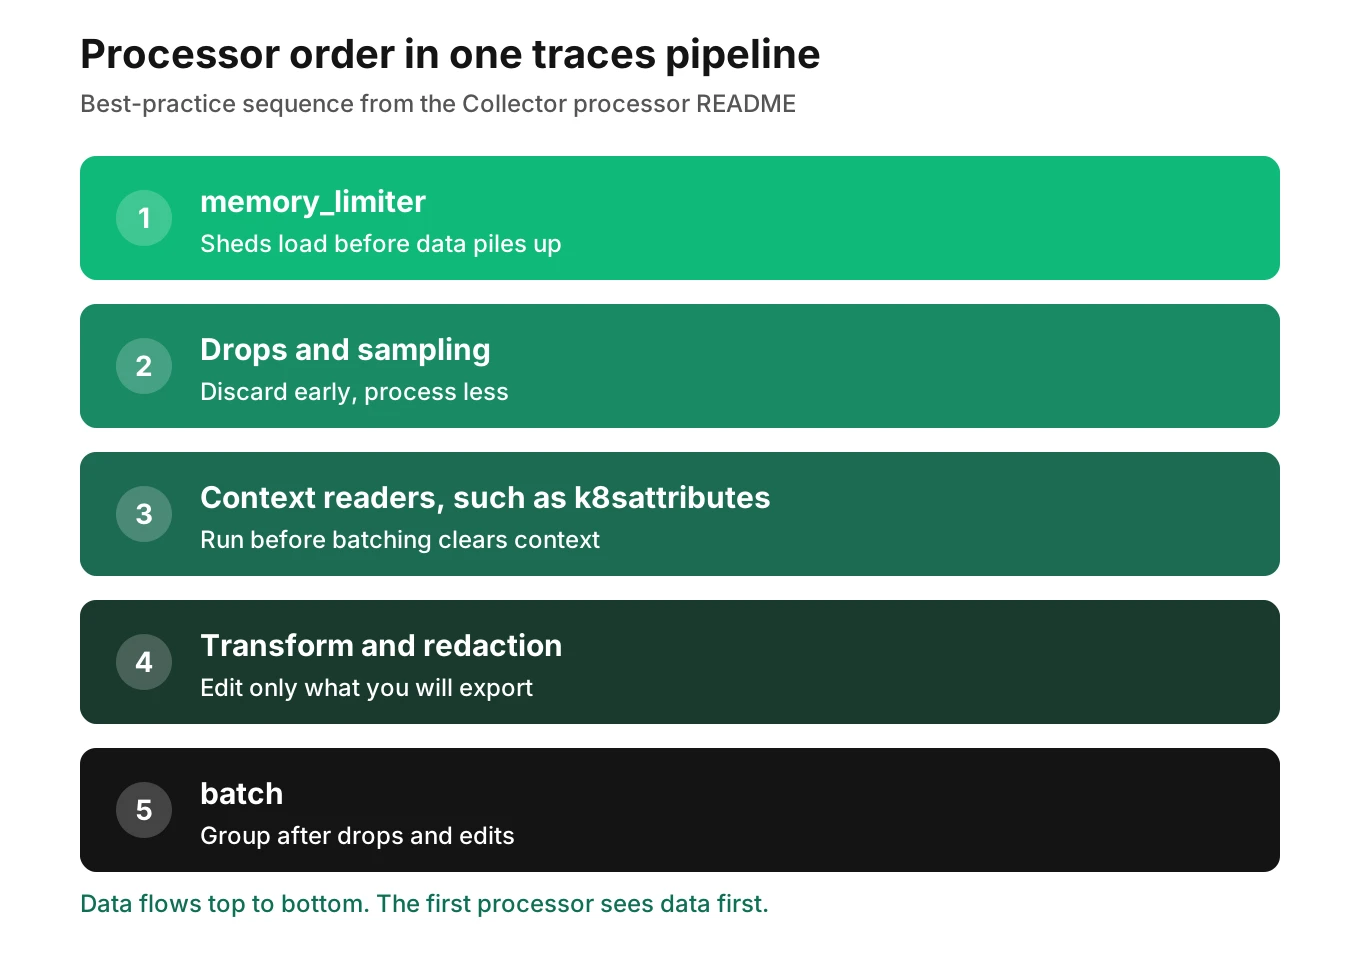
The order, from that README:
- First:
memory_limiter, so it can shed load before later processors pile up data. - Second: processors that drop data, such as sampling or filtering, so you do not process what you will discard.
- Third: processors that read the sending context, such as
k8sattributes, because batching clears the request context. - Fourth: processors that transform or enrich, such as
transformorredaction, so you only edit data you will export. - Last:
batch, so you never batch data that will be dropped or changed.
That is the answer to "opentelemetry collector processor order" for most voice stacks. The README now says to prefer the exporter's own batching when it exists. We cover that next.
Here is a sketch, not a drop-in config. The attribute names are illustrative, so use your own.
receivers:
  otlp:
    protocols:
      grpc:
        endpoint: 0.0.0.0:4317
      http:
        endpoint: 0.0.0.0:4318

processors:
  memory_limiter:
    check_interval: 1s
    limit_percentage: 80
    spike_limit_percentage: 20
  redaction:
    allow_all_keys: false
    allowed_keys:
      - voice.call.id
      - voice.turn.index
      - voice.stage
    summary: info
  batch:

exporters:
  otlp_grpc:
    endpoint: backend-a.example.com:4317
    sending_queue:
      queue_size: 5000
    retry_on_failure:
      max_elapsed_time: 10m

service:
  pipelines:
    traces:
      receivers: [otlp]
      processors: [memory_limiter, redaction, batch]
      exporters: [otlp_grpc]
Two notes. The OTLP receiver defaults to localhost, so the 0.0.0.0 binding is a convenience, and the configuration docs warn about it. And the redaction list fails closed: with allow_all_keys false, any attribute not on allowed_keys is removed.
OpenTelemetry Collector batching: processor or exporter
Batching reduces connections and helps compression. The batch processor README lists these defaults: send_batch_size is 8192 items, timeout is 200ms, and send_batch_max_size is 0, meaning no upper limit. The size is a trigger, not a cap. Use send_batch_max_size if your backend rejects large requests.
The exporter helper README offers the other route: batching in the sending queue, off by default. Turn it on with batch: {}, which uses flush_timeout of 200 ms and min_size of 8192. The Collector warns at startup if one pipeline uses both a batch processor and exporter batching.
Pick one. For a voice agent, the practical points are these:
- Batching adds up to the timeout in delay. At 200 ms that matters only if you alert on the stream.
- Batching clears request context, so anything reading headers or gRPC metadata must run first.
- Batching by metadata, such as a tenant ID, creates one batcher per distinct value. The README warns of higher memory use and caps it with
metadata_cardinality_limit, 1000 by default. If you serve many customers, set it on purpose; see multi-tenant testing.
OpenTelemetry Collector redaction for call data
Masking at the source is better, because a value never sent cannot leak. The Collector is the second layer, and the one you can change without redeploying agents. The PII redaction post covers the layers.
OpenTelemetry's sensitive data guidance is clear: OpenTelemetry cannot tell what is sensitive in your context, so you decide. It lists four processors that help: attributes, filter, redaction and transform. The redaction processor is the one built for this job.
Some cautions from the READMEs:
- Redaction is an allow list first. An empty
allowed_keysremoves every attribute. Start from the keys you need, not the keys you fear. - Value patterns are a backstop.
blocked_valuesmasks values that match regular expressions. It only catches what the patterns describe. Spoken numbers in free text rarely match tidy patterns. - The
attributesprocessor is superseded. Its README says to migrate totransform. Usetransformfor new work. - It is not a compliance program. The redaction README calls the processor one line of defence, written by an engineer, not a lawyer. This post is not legal advice.
Evalgent Observe masks personal data on arrival. Your own Collector mask still protects every other backend you send to.
Voice agent telemetry routing: one stream, several backends
A single OTLP stream can feed many destinations. There are three ways to do it, from simple to specific.
List several exporters in one pipeline. The architecture docs say each exporter gets a copy of each data element. This is the right choice when every backend should see the same data.
Use several pipelines from one receiver. The same receiver sends the same data to each pipeline, and each pipeline has its own processors. The configuration docs note that a processor named in several pipelines gets a separate instance per pipeline. Per the processor README, the fan-out clones data when a pipeline holds a processor that modifies it. One pipeline's masking does not change another's copy.
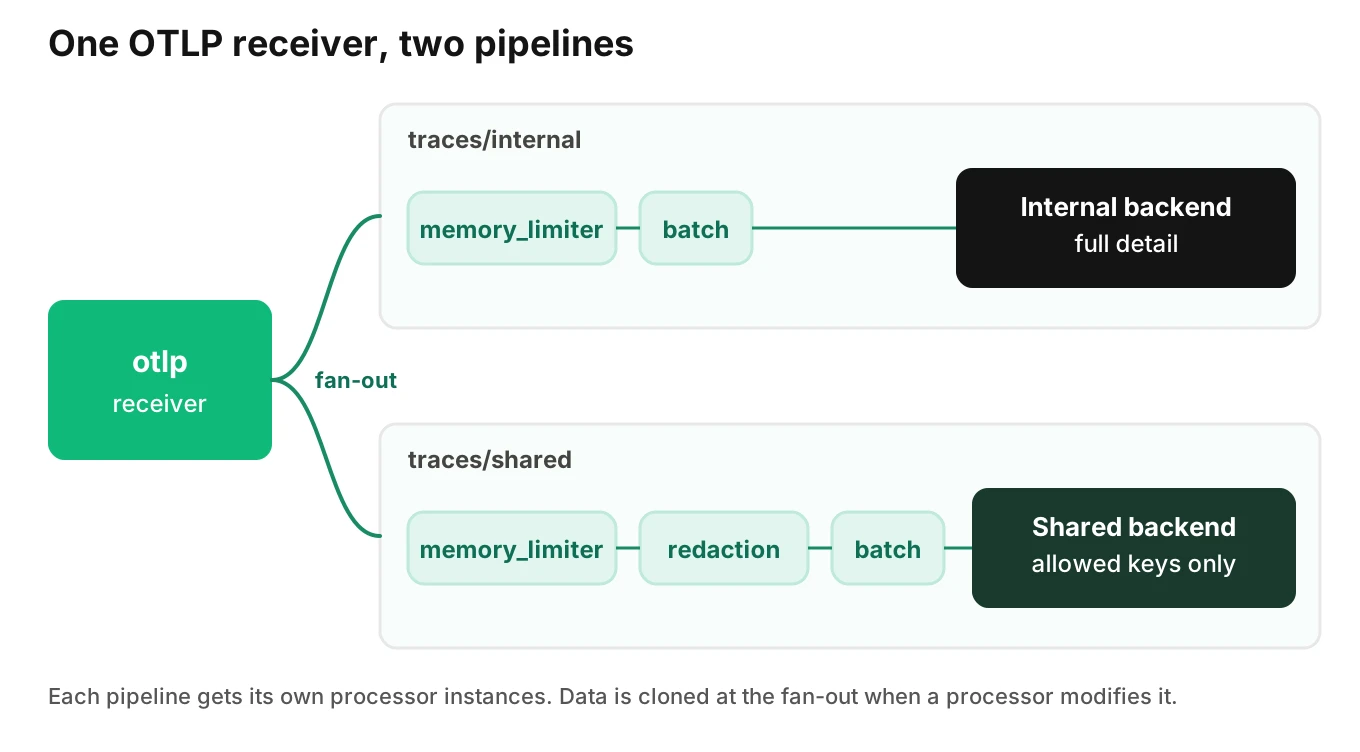
That pattern answers how to route traces to multiple backends with different privacy rules. Keep full detail in a store you control. Send only allowed keys to a tool shared with other teams or a vendor.
receivers:
  otlp:
    protocols:
      grpc:

processors:
  memory_limiter:
    check_interval: 1s
    limit_percentage: 80
    spike_limit_percentage: 20
  redaction/strict:
    allow_all_keys: false
    allowed_keys:
      - voice.call.id
      - voice.turn.index
  batch:

exporters:
  otlp_grpc/internal:
    endpoint: internal.example.com:4317
  otlp_grpc/shared:
    endpoint: shared.example.com:4317

service:
  pipelines:
    traces/internal:
      receivers: [otlp]
      processors: [memory_limiter, batch]
      exporters: [otlp_grpc/internal]
    traces/shared:
      receivers: [otlp]
      processors: [memory_limiter, redaction/strict, batch]
      exporters: [otlp_grpc/shared]
Route by a condition with the routing connector. The routing connector README routes data to pipelines using OTTL conditions, for example on a resource attribute. Its default action is move, so matched data leaves the route list. Set action: copy to let one record reach several pipelines. Every signal type it lists is alpha. A sketch that keeps test calls apart from production calls, with an illustrative attribute:
connectors:
  routing:
    default_pipelines: [traces/prod]
    table:
      - condition: resource.attributes["voice.env"] == "test"
        pipelines: [traces/test]

service:
  pipelines:
    traces/in:
      receivers: [otlp]
      processors: [memory_limiter]
      exporters: [routing]
    traces/test:
      receivers: [routing]
      exporters: [otlp_grpc/internal]
    traces/prod:
      receivers: [routing]
      exporters: [otlp_grpc/shared]
This sketch reuses the receiver, memory_limiter and exporters from the previous one. Your agent must set the attribute on its resource, or the condition never matches.
Evalgent Observe is one more OTLP destination in a fan-out like this. It works from the traces and call data you send, shows coverage gaps, and says "undetermined" where the data is blind. To see how a failed call is traced, book a demo. If a trace tool is already in place, see what trace tools capture and miss.
OpenTelemetry Collector agent vs gateway
Which OpenTelemetry Collector voice agents should run depends on scale. For the OpenTelemetry Collector gateway and agent options, the docs describe two main patterns. In the agent pattern, a Collector runs next to the app, as a sidecar or on the same host. In the gateway pattern, apps send to one OTLP endpoint served by one or more standalone Collectors, typically per cluster, data center or region. The other patterns page covers combining them.
| Pattern | Where it runs | Listed upsides | Listed downsides | Fits when |
|---|---|---|---|---|
| Agent | Beside each worker | Easy start, one-to-one with the app | Limited scale, inflexible | One or two agent services |
| Gateway | Standalone, per cluster or region | Central credentials and policy | One more service, cascade latency, resource cost | Many agents share one policy |
| Two-tier gateway | First tier balances, second processes | All spans of a trace reach one instance | Two layers to run | You use tail sampling at scale |
Our read, not the docs': put masking and routing in the gateway, where one team owns them. LiveKit Agents and Pipecat both document OpenTelemetry tracing, so either fits. See LiveKit Agents observability and Pipecat observability for the SDK side.
What long calls do to a Collector
Most guidance assumes short requests. A voice call is a trace that lasts minutes, and the OpenTelemetry Collector voice agents depend on feels that. Six things follow, each tied to a doc.
- Spans leave when they end. The SDK specification describes the batching processor as grouping finished spans. A call-level root span ends at hang-up. If you want the root to arrive, make sure the agent ends it on every exit path. Our span model post covers this.
- SDK queues drop, they do not block. The spec's batching defaults are a queue of 2048 spans, a 5000 ms delay and 512 spans per export. When the queue is full, spans are dropped. A slow Collector costs telemetry, not audio, by design. Confirm that in your SDK.
- Tail sampling holds whole calls in memory. The tail sampling README says it keeps spans in memory until it decides. The defaults are
decision_waitof 30s andnum_tracesof 50000. A call lasting minutes keeps producing spans after a 30-second wait. Illustratively, spans from minute 4 of a 10-minute call arrive late. - Late spans get their own metric. Late spans arrive after the decision. The README exposes
otelcol_processor_tail_sampling_sampling_late_span_age, and a decision cache keeps "keep" decisions after data is released. Without one, a late span can trigger a second decision for the same call. - A whole trace must reach one instance. The README says all spans for a trace must be received by the same Collector. The scaling docs say the
load_balancingexporter hashes the trace ID for this. The load-balancing exporter README adds that when the backend list changes, about R/N of routes move, where R is routes and N is backends. In our reading, a rolling restart can split a live call across instances. - Memory pressure refuses data. When the
memory_limiteris over its soft limit it refuses data and receivers are expected to retry. The memory limiter README warns that data is lost if the sender does not retry. It recommendsGOMEMLIMITat 80% of the hard limit.
Tail sampling is a design topic of its own. For the policy side, see sampling live calls, and the OpenTelemetry sampling concepts page, which says tail sampling needs stateful components that store a large amount of data. For agent-side growth in long calls, see long-call context bloat.
When the backend goes down
The resiliency docs explain what happens, and the exporter helper README gives the defaults.
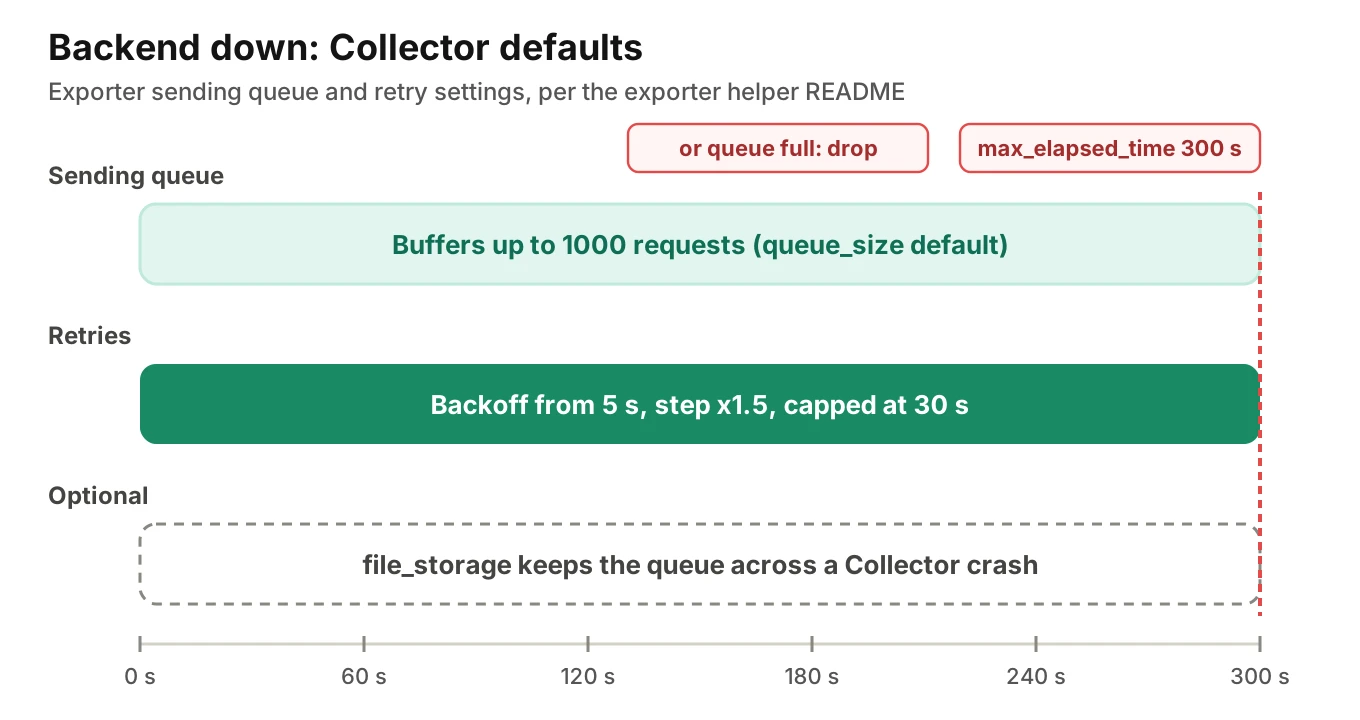
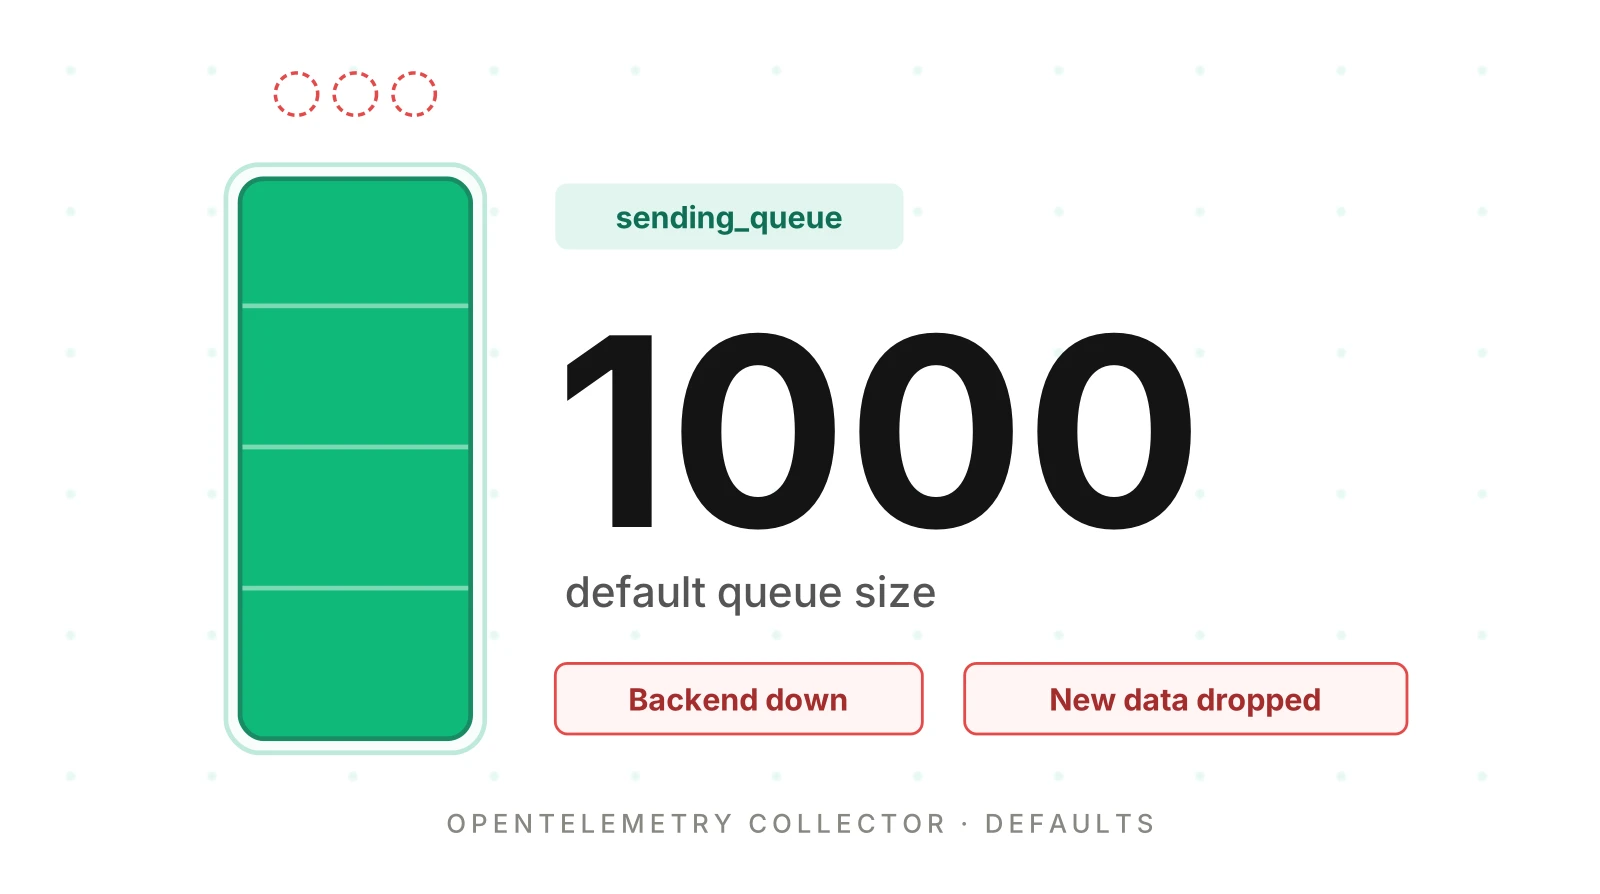
The sending queue is enabled by default, with queue_size of 1000 requests. Retries are on by default, start at 5s, back off by a factor of 1.5 up to 30s, and stop after max_elapsed_time of 300s. Data is dropped when the queue is full or when the retry window ends. Three levers help:
- Raise
queue_sizeandmax_elapsed_time. Size them from your call volume and Collector memory. - Persist the queue. Point
sending_queue.storageat thefile_storageextension. Data then survives a Collector crash. The docs say the guarantees are weaker than a dedicated message queue. - Add a message queue between tiers. The docs suggest Kafka for the highest durability, at the cost of more to operate.
Watch the Collector itself. The scaling docs name otelcol_processor_refused_spans, otelcol_exporter_queue_size, otelcol_exporter_queue_capacity and otelcol_exporter_send_failed_spans. Alert on the queue nearing capacity before data drops. Provider outages need their own plan; see provider outage failover.
How to add a Collector to a voice agent stack
1. Export OTLP from the agent - Point your SDK exporter at a Collector address instead of a vendor. Keep your call ID on every span, as in call ID correlation.
2. Start with one pipeline - A traces pipeline with the otlp receiver, memory_limiter, batch and one exporter. Validate it with otelcol validate.
3. Set the order - Put memory_limiter first, drops next, context-reliant processors before batching, and batching last.
4. Add an allow-list redaction step - List the keys you want to keep. Test with a call that carries seeded fake personal data, and confirm it never reaches a backend.
5. Size the queue and retry window - Set queue_size and max_elapsed_time from the longest outage you accept. Add file_storage if a crash must not lose data.
6. Add the second destination - Use a second exporter or a second pipeline, depending on whether privacy rules differ.
7. Test with your longest call - Run a call as long as your longest real one. Check the root span arrives and late-span age stays low.
8. Monitor the Collector - Alert on refused spans and queue size, and re-read the READMEs after each upgrade.
The Collector only moves data. Finding the cause is the next job; see voice agent root cause analysis and the testing, monitoring and observability split.
Frequently asked questions
Do I need an OpenTelemetry Collector for a voice agent?
No. The docs list a no-Collector pattern that exports straight to a backend. It is simplest for development. You want a Collector when you add a second backend, need masking you can change without a deploy, or need retries and queues that survive a backend restart.
What is the right processor order in the OpenTelemetry Collector?
The processor README gives this order: memory_limiter first, then processors that drop data, then processors that depend on request context, then transforms and redaction, and batch last. Batching clears request context, so anything reading headers must run before it.
How do I route traces to multiple backends?
List several exporters in one pipeline for identical data. Use several pipelines from one receiver when each backend needs different processors, such as redaction for one. Use the routing connector, which is alpha, to send data by a condition such as a resource attribute. Set action: copy to send one record to several pipelines.
Can I redact PII in the OpenTelemetry Collector?
Yes. The redaction processor keeps only allowed attribute keys and can mask values by pattern. It is beta for traces and ships in contrib builds. It only catches what you list or describe, so mask at the source too. This is not legal advice.
Should I use the batch processor or exporter batching?
Use one, not both. The batch processor is beta and defaults to 8192 items and 200ms. The processor README now prefers the exporter's own batching when available, enabled with batch: {} under sending_queue. The Collector warns at startup if a pipeline uses both.
OpenTelemetry Collector agent vs gateway: which fits a voice agent?
An agent runs beside each worker and is simple, but the docs call it limited in scale. A gateway is a central endpoint where you manage credentials and policy once, at the cost of another service. Most teams with several agents put masking and routing in a gateway.
Does the Collector add latency to live calls?
The SDK spec has its batching processor queue finished spans and drop them when the queue is full, so a slow Collector costs telemetry, not audio. Confirm this in your SDK. The docs list added latency when Collectors cascade, which delays telemetry only.
What breaks with long calls and tail sampling?
Tail sampling holds spans in memory until it decides, and decision_wait defaults to 30s. A call lasting minutes produces late spans. Size decision_wait and num_traces, use a decision cache, and keep one trace on one instance with the load-balancing exporter.
The bottom line
Treat the OpenTelemetry Collector voice agents rely on as the one place where masking, routing, batching and retries are decided, and keep its processors in the documented order. Test it with your longest real call and a seeded fake personal-data call before you trust it with production traffic.
Related Articles

How to automate voice agent testing: synthetic callers vs manual QA
Learn how ai test automation replaces manual QA for voice agents. Compare synthetic callers vs human testers, with a 5-step framework to scale without hiring.
Read more
AI Agent Testing vs Voice Agent Testing: What General Tools Miss for Voice
AI agent testing measures text outputs. Voice agent testing measures behaviour through an acoustic pipeline. Five failure categories general tools miss.
Read more