Pipecat Observability: OpenTelemetry Tracing for Every Pipeline Step
On this page
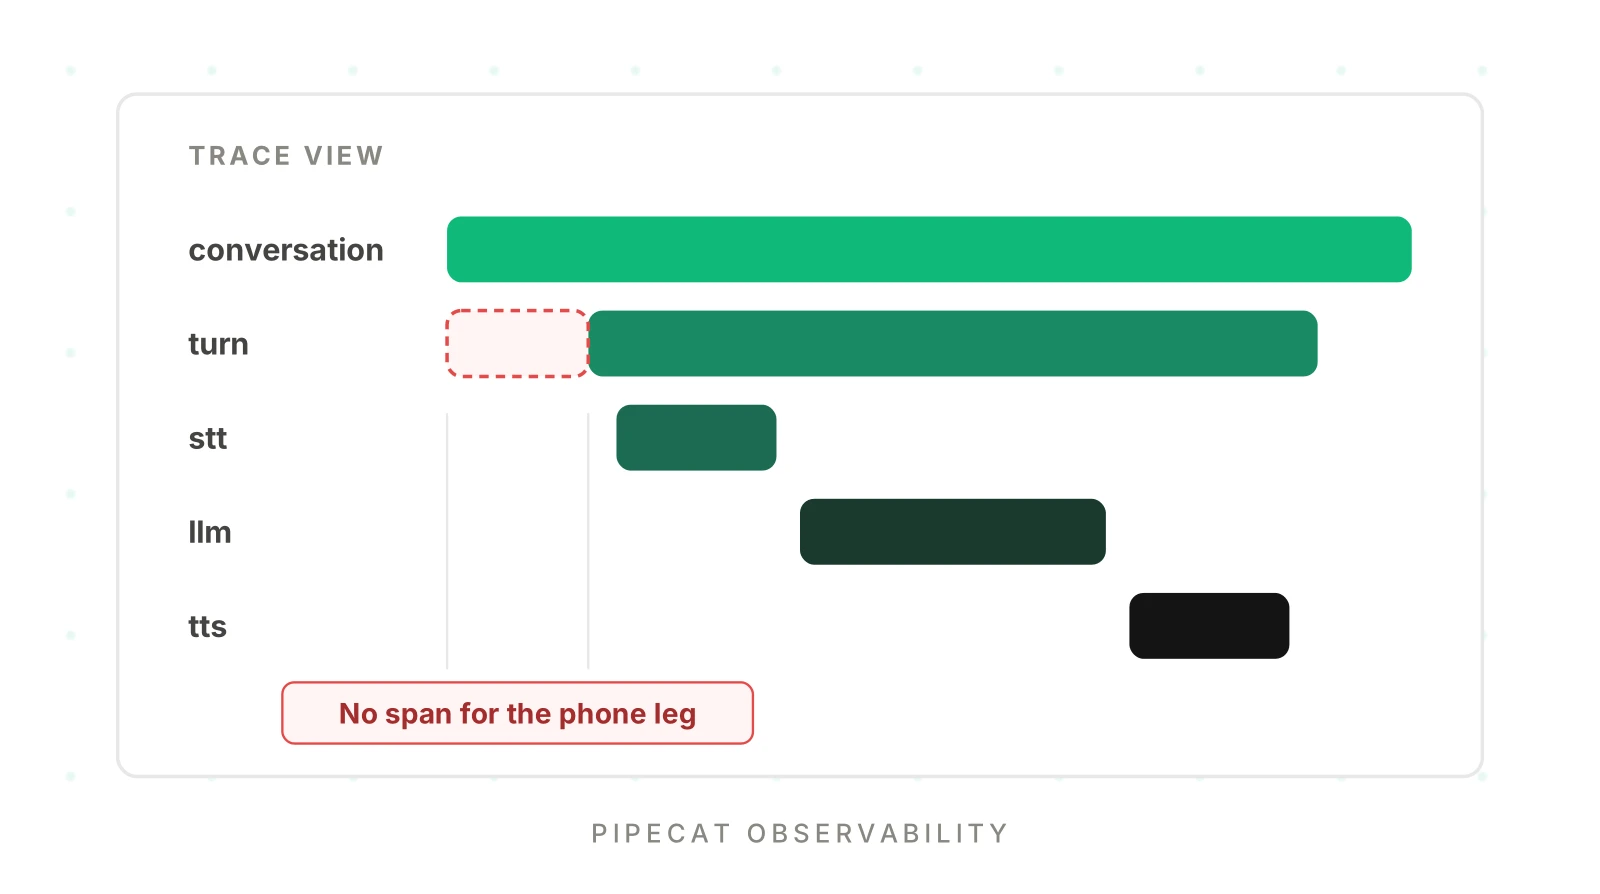
A caller says the agent "went quiet and then repeated itself." You open your logs. They show the STT, LLM and TTS calls all returned. Nothing looks broken, and nothing tells you which turn it was.
Pipecat observability is how you close that gap. The framework ships OpenTelemetry tracing, typed metrics frames and observers. Switched on and exported, they give you one trace per conversation, with a span for each turn and each service call inside it. This guide covers what Pipecat exposes, what you must add yourself, and what no Pipecat span can show you.
As of November 19, 2026, we read the Pipecat OpenTelemetry page and the metrics page on docs.pipecat.ai. We read the exact code in the docs source on GitHub. The latest pipecat-ai release on PyPI that day was 1.16.0. Neither tracing page carries an experimental or beta label. We ran none of this code. Everything below is what the docs and source state, plus clearly labelled illustrative additions.
This post does not repeat per-stage latency math. For that, read measuring Pipecat latency stage by stage. For the general model, see what voice agent observability is.
What Pipecat observability gives you out of the box
Pipecat has three layers of telemetry. Each one is a separate switch, and none of them records a call by default.
| Layer | Switch | Default | What you get |
|---|---|---|---|
| Metrics | enable_metrics in PipelineParams | Off unless you set it | TTFB, TTFA, TTFAT, processing time, text aggregation time |
| Usage metrics | enable_usage_metrics in PipelineParams | Off unless you set it | LLM token counts, TTS characters |
| Observers | observers=[...] on PipelineWorker | None added for you, except turn tracking | Structured events for turns, latency, service metrics, startup |
| Tracing | enable_tracing on PipelineWorker | False | Conversation, turn and service spans, exported over OpenTelemetry |
The tracing page states two defaults exactly. enable_tracing is False. enable_turn_tracking is True. It also marks enable_metrics=True as "required for some service metrics," and its troubleshooting list says missing service data usually means metrics are off.
Pipecat observability needs the extras installed. The docs install pipecat-ai[tracing] plus opentelemetry-exporter-otlp. The source of setup_tracing() shows the failure mode. If the OpenTelemetry packages are missing, the function returns False instead of raising. The PipelineWorker source also combines enable_tracing with an availability check, so a missing install means no spans and no error. If you see no traces, check the install first.
How a frame pipeline maps to spans
A Pipecat pipeline is a chain of processors that pass frames. Audio frames flow downstream from the transport to the STT service. Text frames flow to the LLM, then to the TTS service, then audio frames flow back out. Observers sit beside the chain. The observer pattern docs describe them as non-intrusive: they watch frames without changing them.
Tracing turns that flow into a tree. The documented hierarchy for a standard pipeline is a conversation span, a turn span per exchange, and stt, llm and tts spans inside each turn.
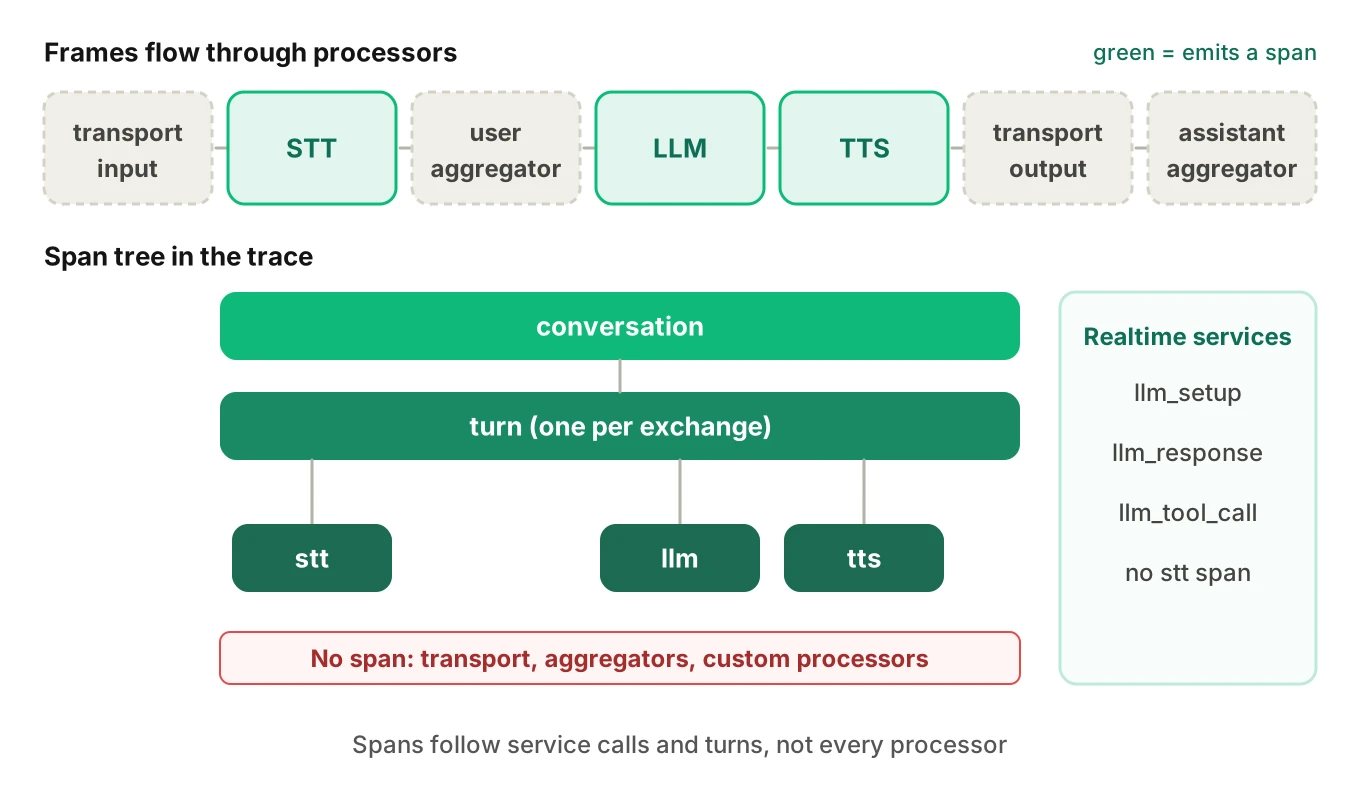
Two details matter when you read that tree.
Spans are per service call and per turn, not per processor. The docs list span attributes for STT, LLM, TTS, realtime services, turns and conversations. They document no span for your transport, your aggregators or a custom frame processor. A processor you wrote is invisible in the trace unless you add a span. If a slow custom processor delays a turn, the trace shows a gap, not a name.
Turns come from the turn tracker. The source shows a TurnTraceObserver that subscribes to TurnTrackingObserver events and opens a turn span for each turn. That is why the tracing setup enables turn tracking. Per the turn tracking docs, a turn starts when the user starts speaking, or when the pipeline starts for the first turn. It ends after the bot finishes speaking and either the user speaks again or a timeout passes. If the pipeline ends mid-turn, that turn ends with was_interrupted=True.
Realtime speech-to-speech services have a different shape. For services such as Gemini Live and OpenAI Realtime, the docs show llm_setup, llm_response and llm_tool_call spans inside each turn. They emit no stt spans. Only Gemini Live and OpenAI Realtime (including Azure Realtime) emit llm_setup. For the design thinking behind a span tree like this, see the OpenTelemetry trace and span model for voice agents.
Pipecat span attributes: what each span carries
The tracing page lists attributes per span type. This table keeps the ones that matter for debugging a bad call. Names are exactly as the docs write them.
| Span | Attributes worth knowing |
|---|---|
conversation | conversation.id, conversation.type, plus anything you pass as additional_span_attributes |
turn | turn.number, turn.type, turn.duration_seconds, turn.was_interrupted, conversation.id |
stt | gen_ai.provider.name, gen_ai.request.model, transcript, is_final, language, vad_enabled, metrics.ttfb |
llm | gen_ai.provider.name, gen_ai.request.model, gen_ai.operation.name, stream, input, output, tools, tool_count, tool_choice, gen_ai.usage.input_tokens, gen_ai.usage.output_tokens, metrics.ttfb |
tts | gen_ai.provider.name, gen_ai.request.model, voice_id, text, metrics.character_count, metrics.ttfb |
llm_response (realtime) | input, output, llm.interrupted, token usage, metrics.ttfb |
llm_tool_call (realtime) | gen_ai.tool.name, gen_ai.tool.call.id, gen_ai.tool.call.arguments, gen_ai.tool.call.result |
The docs say processing duration is "captured in the span duration." They say metrics.ttfb is in seconds. The settings.* attributes on STT and TTS spans carry service-specific configuration.
Three notes from the sources.
First, the cascaded llm span records what tools were available, not what happened to them. The docs list tools, tool_count and tool_choice for it. They describe llm_tool_call spans, with arguments and results, only for realtime services. Our reading of the traced_llm decorator in the source agrees: it serializes the tool configuration onto the span. If your agent books, cancels or looks up something through a tool, the outcome is yours to record.
Second, the turn span has one more attribute than the docs page lists. The changelog and the TurnTraceObserver source show turn.user_bot_latency_seconds, set when the latency observer measures a turn. Treat it as source-level rather than documented, and confirm it appears in your own traces. Our latency guide covers what that number does and does not include.
Third, attribute names have changed before. A Pipecat changelog entry says tracing attributes were updated to the current OpenTelemetry GenAI semantic conventions. It names new gen_ai.provider.name values for some providers and a renamed reasoning-token attribute, and it warns to update dashboards that filter on old values. The status of those conventions is not ours to state; the OpenTelemetry site says they have moved to their own repository. Pin your Pipecat version in every dashboard note.
Transcripts and prompts are attributes too
The attribute list above includes transcript on STT spans, text on TTS spans, and input and output on LLM spans. Per the docs, input is the JSON-serialized input messages, and gen_ai.system_instructions holds system instructions, truncated. Any Pipecat observability setup that exports spans ships text. If you export to a hosted backend, caller words and your prompt leave your network with every span.
Decide that on purpose. Check which attributes your backend stores, who can read them, and how long they live. Our guide to voice agent span attributes has a section on what never to record. Nothing here is legal advice.
Pipecat metrics: TTFB, TTFA, TTFAT and usage
Tracing carries some metrics as span attributes. The metrics layer carries more, as MetricsFrames. The metrics docs say that with metrics enabled, Pipecat emits a MetricsFrame per interaction. It holds typed data objects.
| Metric data class | What it holds |
|---|---|
TTFBMetricsData | Time to first byte, in seconds |
TTFAMetricsData | Time to first audio for TTS: ttfa, ttfb and leading_silence |
TTFATMetricsData | Time to first answer token for text LLMs: ttfat, ttfb and thinking_time |
ProcessingMetricsData | Processing time in seconds |
TextAggregationMetricsData | Time from the first LLM token to the first complete sentence |
LLMUsageMetricsData | Prompt and completion tokens, with cache, reasoning and audio token fields |
STTUsageMetricsData | Audio seconds submitted to STT |
TTSUsageMetricsData | Characters processed by TTS |
TurnMetricsData | is_complete, probability and e2e_processing_time_ms from a turn analyzer |
The docs add caveats worth copying into your runbook:
- WebSocket-based TTS services, and
DeepgramSageMakerTTSService, do not report processing metrics. - Streaming STT services do not report processing metrics either. Segmented STT services do.
- TTFAT is reported only by LLM services that answer in text, not by speech-to-speech services.
- Usage metrics are per interaction. They are not running totals.
report_only_initial_ttfb=Truekeeps only the first TTFB per service and needsenable_metrics=True.
You can read these frames in a custom FrameProcessor or with observers. The docs list MetricsLogObserver for logs, ServiceMetricsObserver for structured latency and usage records, StartupTimingObserver for processor startup and transport connection time, UserBotLatencyObserver for user-to-bot latency, and TurnTrackingObserver for turn events. Those five cover Pipecat metrics without writing frame code.
How to enable tracing in Pipecat and export it in 5 steps
This is the shortest path to Pipecat observability that the docs support. It follows the Basic Setup and Exporter sections of the Pipecat OpenTelemetry page. The code is simplified from the docs example.
1. Install the tracing extras — run uv add "pipecat-ai[tracing]" opentelemetry-exporter-otlp, as the docs do.
2. Start a trace collector — for local work the docs recommend Jaeger in Docker, with the UI on port 16686 and OTLP on ports 4317 and 4318.
3. Initialize OpenTelemetry — call setup_tracing() with a service name and an exporter. This sets the global tracer provider.
4. Enable tracing on the worker — pass enable_tracing=True and enable_turn_tracking=True to PipelineWorker, and enable_metrics=True in PipelineParams.
5. Run a call and read the trace — open the collector UI, find the conversation span, and check each turn for stt, llm and tts children. If nothing appears, set console_export=True.
Here is steps 3 and 4 as code. The agent.* attributes are our illustrative additions, not Pipecat names.
# simplified from the Pipecat OpenTelemetry docs; agent.* names are illustrative
from opentelemetry.exporter.otlp.proto.grpc.trace_exporter import OTLPSpanExporter
from pipecat.utils.tracing.setup import setup_tracing
from pipecat.pipeline.worker import PipelineWorker, PipelineParams

exporter = OTLPSpanExporter(endpoint="http://localhost:4317", insecure=True)
setup_tracing(service_name="my-voice-app", exporter=exporter, console_export=False)

worker = PipelineWorker(
    pipeline,
    params=PipelineParams(enable_metrics=True, enable_usage_metrics=True),
    enable_tracing=True,
    enable_turn_tracking=True,
    conversation_id=call_id,  # your own call ID; a UUID is generated if omitted
    additional_span_attributes={
        "agent.prompt_version": "2026-11-19-a",
        "agent.release": "r142",
    },
)
Per the docs, service_name defaults to pipecat, exporter defaults to None, and console_export defaults to False. conversation_id defaults to None, and a UUID is generated if you leave it out. additional_span_attributes goes on the top-level conversation span.
This is the Pipecat OpenTelemetry setup in full. Everything after it is about what to add and what to distrust.
Pipecat Langfuse and other OpenTelemetry backends
Pipecat does not ship a backend. It hands spans to whatever exporter you configure. The docs group the options like this.
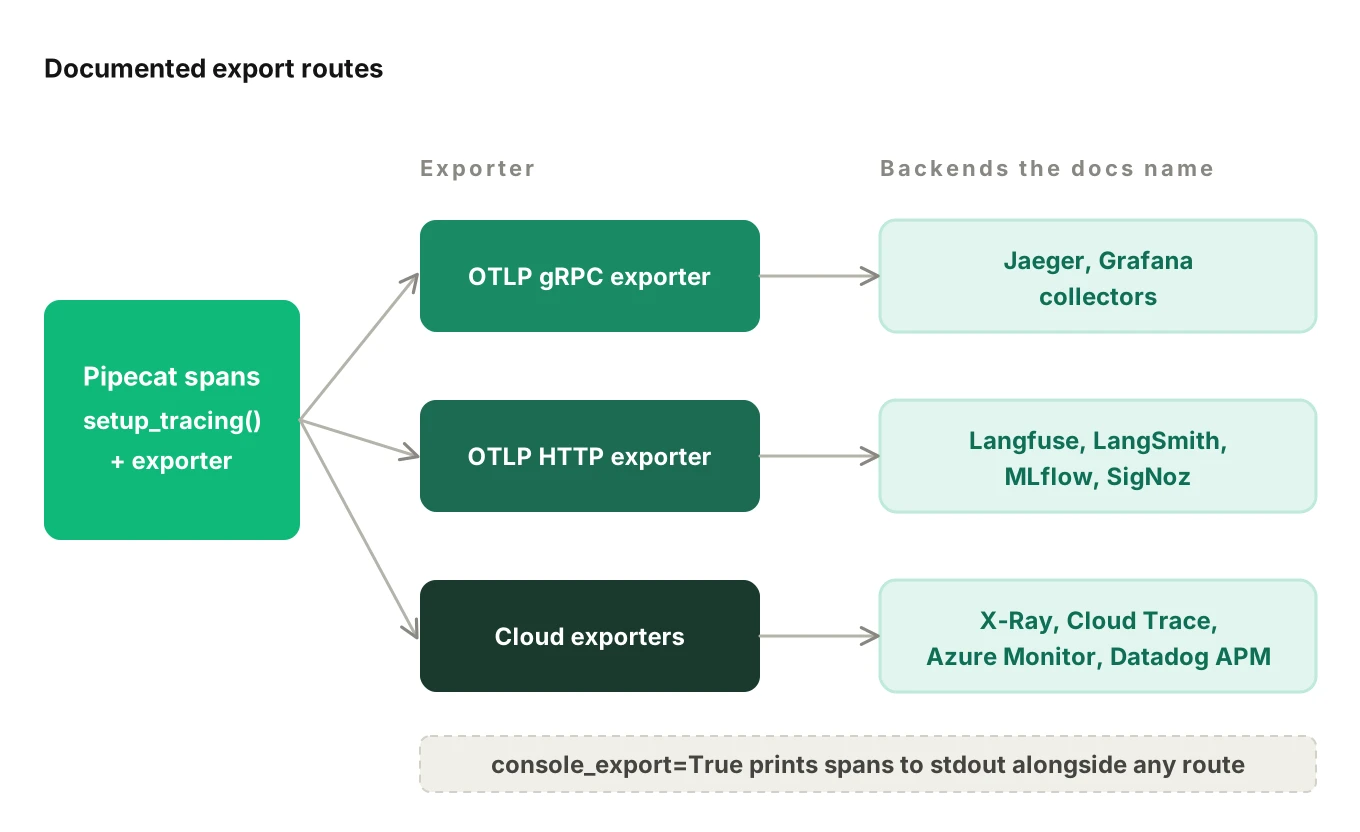
| Route | Exporter | Backends the docs name |
|---|---|---|
| OTLP over gRPC | opentelemetry.exporter.otlp.proto.grpc.trace_exporter.OTLPSpanExporter | Jaeger, Grafana and similar collectors |
| OTLP over HTTP | opentelemetry.exporter.otlp.proto.http.trace_exporter.OTLPSpanExporter | Langfuse, LangSmith, MLflow, SigNoz |
| Console | console_export=True in setup_tracing() | Debug output to stdout, alongside any exporter |
| Cloud services | Their OpenTelemetry-compatible exporters | AWS X-Ray, Google Cloud Trace, Azure Monitor, Datadog APM |
For the HTTP route, the docs configure the exporter with environment variables, OTEL_EXPORTER_OTLP_ENDPOINT and OTEL_EXPORTER_OTLP_HEADERS. The OpenTelemetry docs describe the endpoint variable as a base URL for any signal type, and say variable support differs by language. See the OTLP exporter configuration page.
If you want Pipecat Langfuse tracing, the docs point to a maintained example. The Langfuse example uses the HTTP exporter and is described as LLM-focused observability. The same folder holds examples for Jaeger, LangSmith and SigNoz. We did not run it. Before you rely on any backend, send one test call and check three things: that spans arrive, that the parent-child tree is intact, and how the backend displays gen_ai.* attributes.
The docs also list community integrations that map Pipecat traces to other attribute schemes. Those are third-party packages. Read their own docs before using them.
A collector in the middle is the usual way to fan out to more than one backend. The OpenTelemetry docs describe the Collector as a vendor-agnostic way to receive, process and export telemetry data, and say it can send to one or several backends. Our post on OpenTelemetry for voice agents covers the wider picture.
What you add to Pipecat observability yourself
Out of the box, Pipecat tracing tells you a turn happened and which service calls it made. These four gaps are yours to fill. Each one maps to a documented hook.
| Need | Why Pipecat alone does not cover it | What to add |
|---|---|---|
| Correlation ID | A generated UUID matches nothing in your CRM or telephony logs | Pass your call ID as conversation_id |
| Version tags | No span says which prompt or release served the call | Put them in additional_span_attributes |
| Tool outcomes | The cascaded llm span lists tools, not results | Wrap each tool handler in your own span |
| Turn fields | The turn span has number, duration and interrupted flag only | Write a per-turn record from the turn tracker events |
Correlation ID and version tags
Your conversation ID should be an ID you already use elsewhere, so set conversation_id to it. A telephony call SID or your own call ID both work. Then every Pipecat span joins to your database rows and carrier logs with no lookup table. The conversation span carries conversation.id, and so does each turn span.
Version tags go in the additional span attributes, passed as additional_span_attributes. The docs say these attach to the top-level conversation span. So when you filter a backend for "calls on prompt version X," you filter conversation spans. The tags belong on the conversation, not on each service span. Keep them to bounded values such as a prompt version or release label. Our span attributes guide explains why.
The setup_tracing() source also sets resource attributes. It creates a resource with service.name, service.instance.id from the HOSTNAME environment variable, and deployment.environment from the ENVIRONMENT variable. That comes from the source, not the docs page, so confirm it on your version.
Tool outcome spans
If a tool silently fails, the caller hears a confident wrong answer. The trace needs a span that says whether the tool worked. Pipecat's function handlers take a FunctionCallParams first, then the tool's arguments, and return through params.result_callback, per the function calling docs. That is the place to add a span with the standard OpenTelemetry API.
# illustrative: the span, attribute names and orders_api are ours, not Pipecat's
from opentelemetry import trace
from opentelemetry.trace import Status, StatusCode
from pipecat.services.llm_service import FunctionCallParams

tracer = trace.get_tracer("my-voice-app.tools")

async def get_order_status(params: FunctionCallParams, order_id: str):
    with tracer.start_as_current_span("tool.get_order_status") as span:
        span.set_attribute("conversation.id", CALL_ID)
        span.set_attribute("app.tool.name", "get_order_status")
        try:
            result = await orders_api.lookup(order_id)
            span.set_attribute("app.tool.outcome", "found" if result else "not_found")
        except Exception as exc:
            span.record_exception(exc)
            span.set_status(Status(StatusCode.ERROR))
            span.set_attribute("app.tool.outcome", "error")
            result = {"error": "lookup_failed"}
        await params.result_callback(result)
Do not record the raw order_id or the result body unless you have decided to. Record an outcome label instead.
One honest limit. The docs do not describe a public way to parent your own span under the turn span. We did not verify that this span lands under the turn in your backend. That is why the sample sets conversation.id on the span itself: even if it appears as a separate trace, you can still join it by call ID. Check it in your first test call.
Turn fields
The turn span has number, type, duration and the interrupted flag. Your debugging questions need more: which prompt version, how the turn ended, what intent was detected. The documented hook is the turn tracker. The turn tracking docs show how to reach it and register handlers.
# illustrative: uses worker.turn_tracking_observer and on_turn_ended as the docs show
import json, logging

log = logging.getLogger("turns")
turn_observer = worker.turn_tracking_observer

@turn_observer.event_handler("on_turn_ended")
async def on_turn_ended(observer, turn_number, duration, was_interrupted):
    log.info(json.dumps({
        "conversation_id": call_id,
        "turn": turn_number,
        "duration_s": round(duration, 2),
        "interrupted": was_interrupted,
        "prompt_version": PROMPT_VERSION,
    }))
Join that record to the trace on conversation_id and turn. For the full field list per span type, use voice agent span attributes.
What stays invisible in Pipecat observability
Some of the most common voice failures happen where no Pipecat span exists. This is the honest answer to "what does Pipecat tracing not show."
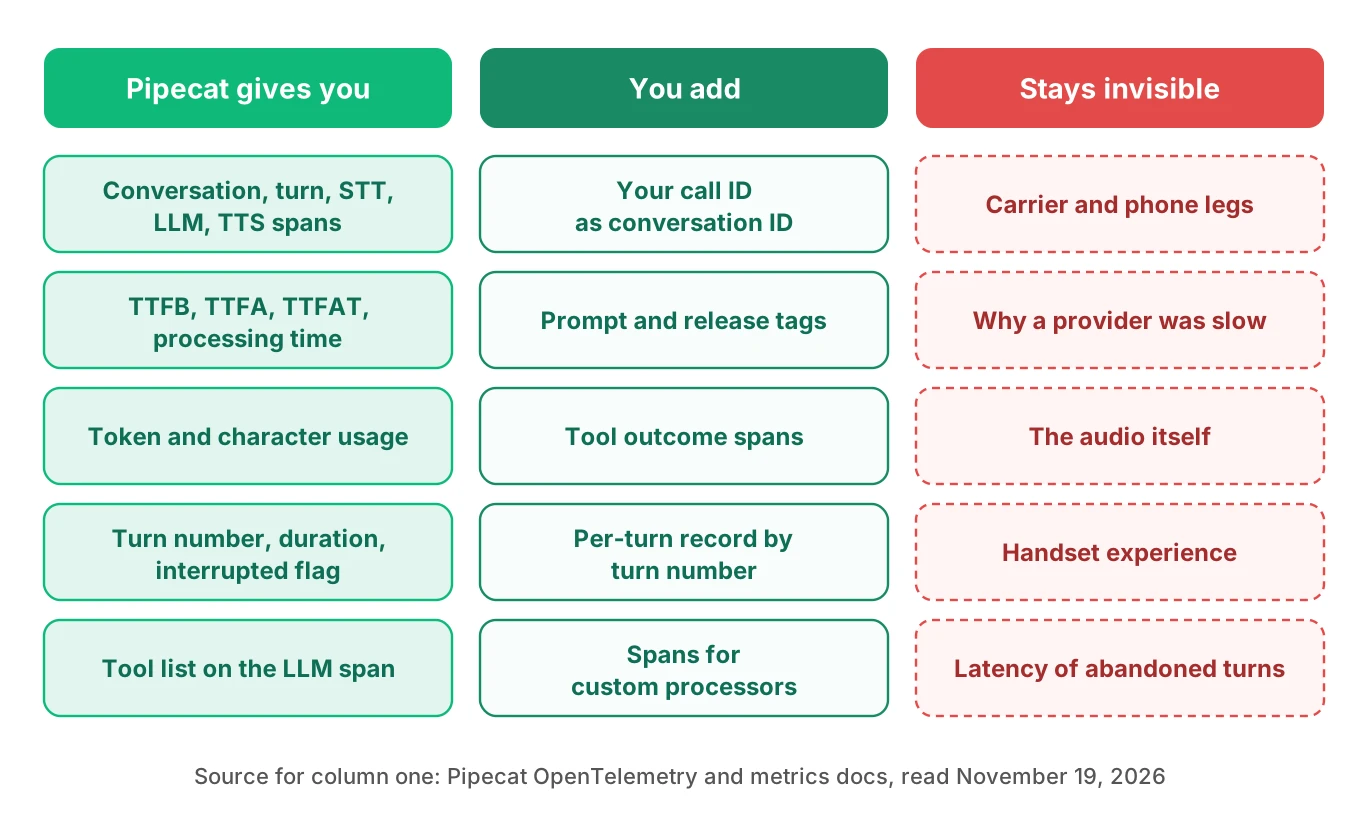
The telephony leg. Spans start inside your process. Nothing in the documented attributes covers the carrier, the SIP leg or the handset. Audio that arrived late or lossy looks, to Pipecat, like audio that arrived. Our latency guide explains how the agent's clock misses the phone network, and call recording and per-call metrics covers carrier-side recordings as a second source.
Provider-side issues. An stt span with a long metrics.ttfb says the provider was slow. It does not say why. The documented attribute lists carry no provider request ID or region. A queue, a degraded model or a rate limit looks the same as a slow network. You need the provider's own logs.
Your own processors. A custom frame processor has no span. Slowness in it shows up as unexplained time inside a turn.
Turns that never finished. The turn span has turn.was_interrupted. A caller who gave up produces a short or interrupted turn, and the metrics layer may not record a latency for it. Report an interrupted-turn rate next to latency, as our latency guide argues.
The audio itself. Span attributes carry text and numbers. They do not carry what was said in the audio. If you need to hear a call, you need a recording and a way to link it to the trace.
Realtime internals. Realtime services emit llm_response spans, not stt spans. You see the reply and its usage, not a separate transcription step.
Reading one bad turn in a Pipecat trace
This is an illustrative reading, not a measurement. Say a caller reports dead air on turn 7.
- Find the conversation by call ID. If you set
conversation_id, this is a search, not a hunt. - Open turn 7 and check
turn.was_interruptedandturn.duration_seconds. A long turn with no interruption points at the pipeline. An interrupted turn points at turn-taking. - Compare child spans. If the
sttspan has a largemetrics.ttfb, look at the provider. If thellmspan is slow or itstoolslist is long, look at the model and tools. If thettsspan has a largemetrics.ttfb, look at synthesis. - Check your tool span. An
app.tool.outcomeoferrorornot_foundexplains a wrong answer the model delivered confidently. - Check for unexplained time. If the child spans do not fill the turn, the gap is a processor, a wait or the network. The trace cannot say which. Mark it undetermined and go to the recording.
That last step is the discipline. A trace that cannot see something should say so. For the full workflow, see how to debug a bad voice agent call and voice agent root cause analysis.
Where Evalgent fits
Pipecat observability gives you the data. Someone still has to read thousands of traces and decide which failures share a cause. That is the job of Evalgent Observe. It traces each failure to the step or handoff that caused it, and clusters failures into root causes so a team fixes causes, not single calls.
Observe ingests OpenTelemetry data from any stack. So where your Pipecat setup exports OpenTelemetry, that data can be sent to it. Evalgent never sits in the media path, so nothing touches live audio or slows a call. Where the data is blind, such as the phone leg above, the finding is marked "undetermined" and the coverage gap is shown, not hidden.
Evalgent's production call monitoring flags problems such as tool-call failures and latency spikes, with fix recommendations. If you want to test your own setup first, our Pipecat testing guide covers frames, VAD and evals. And if you are still choosing a framework, see Pipecat vs LiveKit and deploying Pipecat in production.
Frequently asked questions
Does Pipecat support OpenTelemetry?
Yes. Pipecat's docs describe built-in OpenTelemetry tracing. Install pipecat-ai[tracing] and an OTLP exporter, call setup_tracing() with an exporter, then pass enable_tracing=True to PipelineWorker. The docs list Jaeger, Langfuse, LangSmith, MLflow and SigNoz examples, plus cloud services with OpenTelemetry-compatible exporters.
How do I enable tracing in Pipecat?
Initialize OpenTelemetry with setup_tracing(service_name=..., exporter=...). Then build PipelineWorker with enable_tracing=True and enable_turn_tracking=True, and set enable_metrics=True in PipelineParams. The docs mark metrics as required for some service data. Tracing is off by default, and missing OpenTelemetry packages disable it without an error.
What spans does Pipecat create?
For a standard pipeline, a conversation span holds one turn span per exchange, and each turn holds stt, llm and tts spans. Realtime services such as Gemini Live and OpenAI Realtime produce llm_response and llm_tool_call spans instead, with no stt span. Custom processors get no span unless you add one.
Can I send Pipecat traces to Langfuse?
The Pipecat docs list Langfuse as an example backend using the OTLP HTTP exporter, configured through OTEL_EXPORTER_OTLP_ENDPOINT and OTEL_EXPORTER_OTLP_HEADERS. A maintained example lives in the pipecat-examples repository. We did not run it, so send a test call and check that spans and attributes arrive intact.
What metrics does Pipecat expose?
With enable_metrics=True, Pipecat emits TTFB, TTFA, TTFAT, processing time and text aggregation time. With enable_usage_metrics=True, it adds LLM token and TTS character usage. They arrive as MetricsFrames and through observers such as MetricsLogObserver and ServiceMetricsObserver. Some services skip processing metrics, per the docs.
How do I tie a Pipecat trace to a call ID?
Pass your own call ID as conversation_id when you create the PipelineWorker. The conversation span and each turn span then carry it as conversation.id. If you omit it, Pipecat generates a UUID. Pass your telephony call SID or internal call ID so spans join to your other logs.
How do I tag traces with a prompt version?
Use additional_span_attributes on PipelineWorker. The docs say it adds attributes to the top-level conversation span, so filter conversation spans by the tag. Use bounded values such as a prompt version or release label. The docs describe no built-in version tag, so the names are yours.
What does Pipecat tracing not show?
It shows no span for the phone network, a custom processor or the provider's internal state. It records text, not audio. Cascaded llm spans list tools, not tool results. Turns the caller abandoned may have no latency record. You add tool outcome spans, version tags and a call ID yourself, and use recordings and provider logs for the rest.
The bottom line
Pipecat observability gives you a documented OpenTelemetry span tree and typed metrics, and it costs a short setup to switch on. It cannot see the phone leg, your own processors or provider internals, so add your own call ID, version tags and tool outcomes and mark the rest undetermined.
Related Articles

How to automate voice agent testing: synthetic callers vs manual QA
Learn how ai test automation replaces manual QA for voice agents. Compare synthetic callers vs human testers, with a 5-step framework to scale without hiring.
Read more
AI Agent Testing vs Voice Agent Testing: What General Tools Miss for Voice
AI agent testing measures text outputs. Voice agent testing measures behaviour through an acoustic pipeline. Five failure categories general tools miss.
Read more