LiveKit Agents Observability: OpenTelemetry Traces, Metrics and Audio
On this page
A caller says the agent "went quiet and then repeated itself." You open your dashboards. LiveKit shows a session, a transcript and some timings. Whether that is enough depends on what LiveKit Agents observability actually records and what it leaves to you.
This post lists what the LiveKit docs describe as of November 19, 2026, each page opened that day. It then separates three things. What LiveKit gives you. What you must add. What no LiveKit surface can see. It ends with a short setup for sending LiveKit Agents telemetry to an OpenTelemetry backend.
For latency specifically, read debugging LiveKit latency. For stereo recording setup, read LiveKit call recording and Pipecat audio recording. This post covers the wider map and does not repeat either.
What LiveKit Agents exposes today
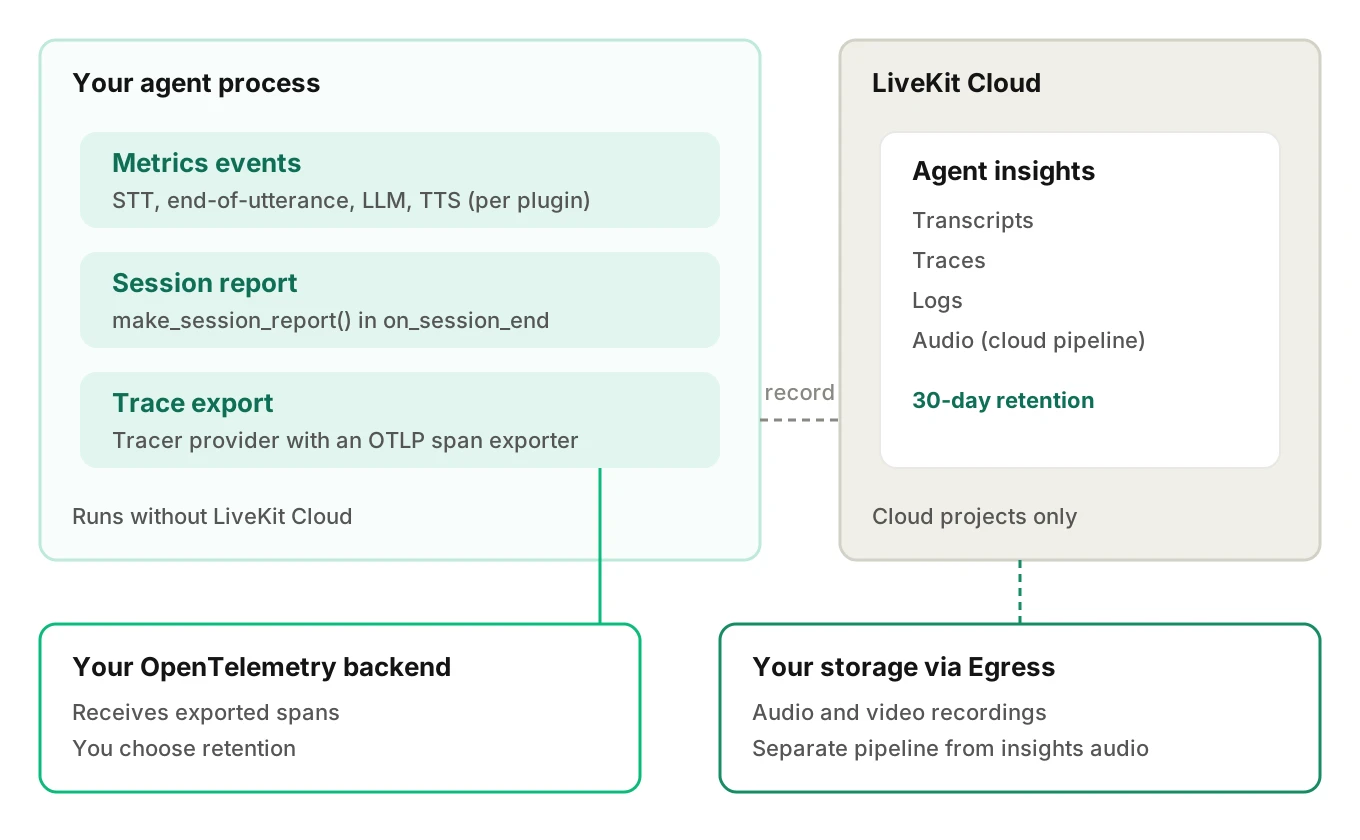
The observability overview describes Agent insights as "a built-in observability stack in LiveKit Cloud with transcripts, traces, logs, and audio recordings in a unified timeline for each agent session." Around it sit separate hooks that run inside your own agent process.
| Surface | What it gives you | Where it lives |
|---|---|---|
| Agent insights | Transcripts, traces, logs and audio in one session timeline | LiveKit Cloud only |
| Trace export | Spans sent to an OpenTelemetry-compatible backend | Your backend |
| Metrics events | STT, end-of-utterance, LLM and TTS measurements | Your agent process |
| Session report | Identifiers, history, events, recording metadata, agent configuration | Your agent process |
| Egress | Audio, and video, recorded to storage you choose | Your storage |
None of the pages I read carries a beta or experimental label. The only status label is "Deprecated", which the data page applies to the session-level metrics_collected event. Pages can change, so treat this as a dated snapshot.
Traces and LiveKit Agents OpenTelemetry export
LiveKit Agents tracing records "the execution flow of each stage in the voice pipeline." The data hooks page says you can export spans "to any compatible backend, such as Langfuse." The setup lives on the export traces page.
That page documents these pieces:
- A tracer provider you register with
set_tracer_provider, imported fromlivekit.agents.telemetryin Python. - An OTLP span exporter (
OTLPSpanExporter) wrapped in aBatchSpanProcessor. - A rule that the provider must be set before the session starts.
- A flush callback so remaining spans export before the process exits.
The page's worked example sends spans to Langfuse. Its setup_langfuse function is the page's own, not a LiveKit API. It also documents Node.js equivalents. The page does not list span names.
It does list attribute namespaces. LiveKit-specific data sits under lk.*, such as lk.speech_id and lk.job_id. Token usage follows the OpenTelemetry GenAI naming under gen_ai.*. Content attributes sit under lk.pii.*. The page notes that those were renamed in Agents 1.7.0. For how these compare to a voice-specific schema, see voice agent span attributes and the OpenTelemetry GenAI conventions post.
The livekit agent metrics events
The data page names per-plugin events as the supported surface. Its example form is llm.on("metrics_collected", ...). It documents four event types:
| Event | Emitted | Fields the page names | Caveat on the page |
|---|---|---|---|
STTMetrics | After the STT model processes audio | audio_duration, duration, streamed | Realtime APIs do not emit it. duration is always 0 for streaming |
EOUMetrics | When the user is judged to have finished | end_of_utterance_delay, transcription_delay | Realtime APIs emit it only with VAD or LiveKit's turn detector |
LLMMetrics | After each inference | ttft, token counts | Tool-call follow-ups emit their own events |
TTSMetrics | After speech generation | ttfb, audio_duration, characters_count | None stated |
Two caveats matter for monitoring. The session-level metrics_collected event is marked deprecated, while the per-plugin event is not. And with realtime models, llm_node_ttft and tts_node_ttfb are empty in session reports. A dashboard built on them shows gaps, not zeros, for speech-to-speech agents. Our latency post covers how to read these fields turn by turn.
Session reports
Call ctx.make_session_report() inside an on_session_end hook, then report.to_dict(). The page says this runs "entirely in your agent process" with no requests to LiveKit Cloud, so it works when you self-host. Reports include identifiers, conversation history, events, recording metadata and agent configuration. session_end_timeout defaults to 5 minutes, per the page.
The hook is passed to the session decorator, as in the page's example: @server.rtc_session(agent_name="my-agent", on_session_end=on_session_end). A session report is the cheapest durable record you can write at the end of every call.
Recordings, transcripts and the LiveKit session recording observability path
There are two audio paths, and the recording page says they come from separate pipelines.
- Agent insights audio. Collected automatically and uploaded to LiveKit Cloud for each session. The insights page says recordings include both the agent and the user audio. If noise cancellation is on, user audio is captured after it is applied.
- Egress. For finer control, skipping background voice cancellation, or video, the docs recommend Egress to your own storage provider.
The record parameter on AgentSession.start() controls Cloud collection. Omit it or pass record=True and everything is recorded. Pass record=False to disable upload of audio, transcripts, traces and logs for the whole session. A granular object toggles audio, transcript, traces, logs and redaction, and omitted keys default to True.
For transcripts, the data page says to subscribe to conversation_item_added and user_input_transcribed for live use. It calls session.history an advanced use case and "not recommended for most applications." With a realtime model and no separate STT plugin, those transcripts may be incomplete or late.
Agent insights: what is limited to LiveKit Cloud
The overview states: "Agent observability is only available for LiveKit Cloud projects." It works for agents deployed to Cloud and for self-hosted agents that connect to LiveKit Cloud media servers. It does not work with self-hosted media servers or fully self-hosted setups. The data region is set when the project is created and cannot be changed afterward.
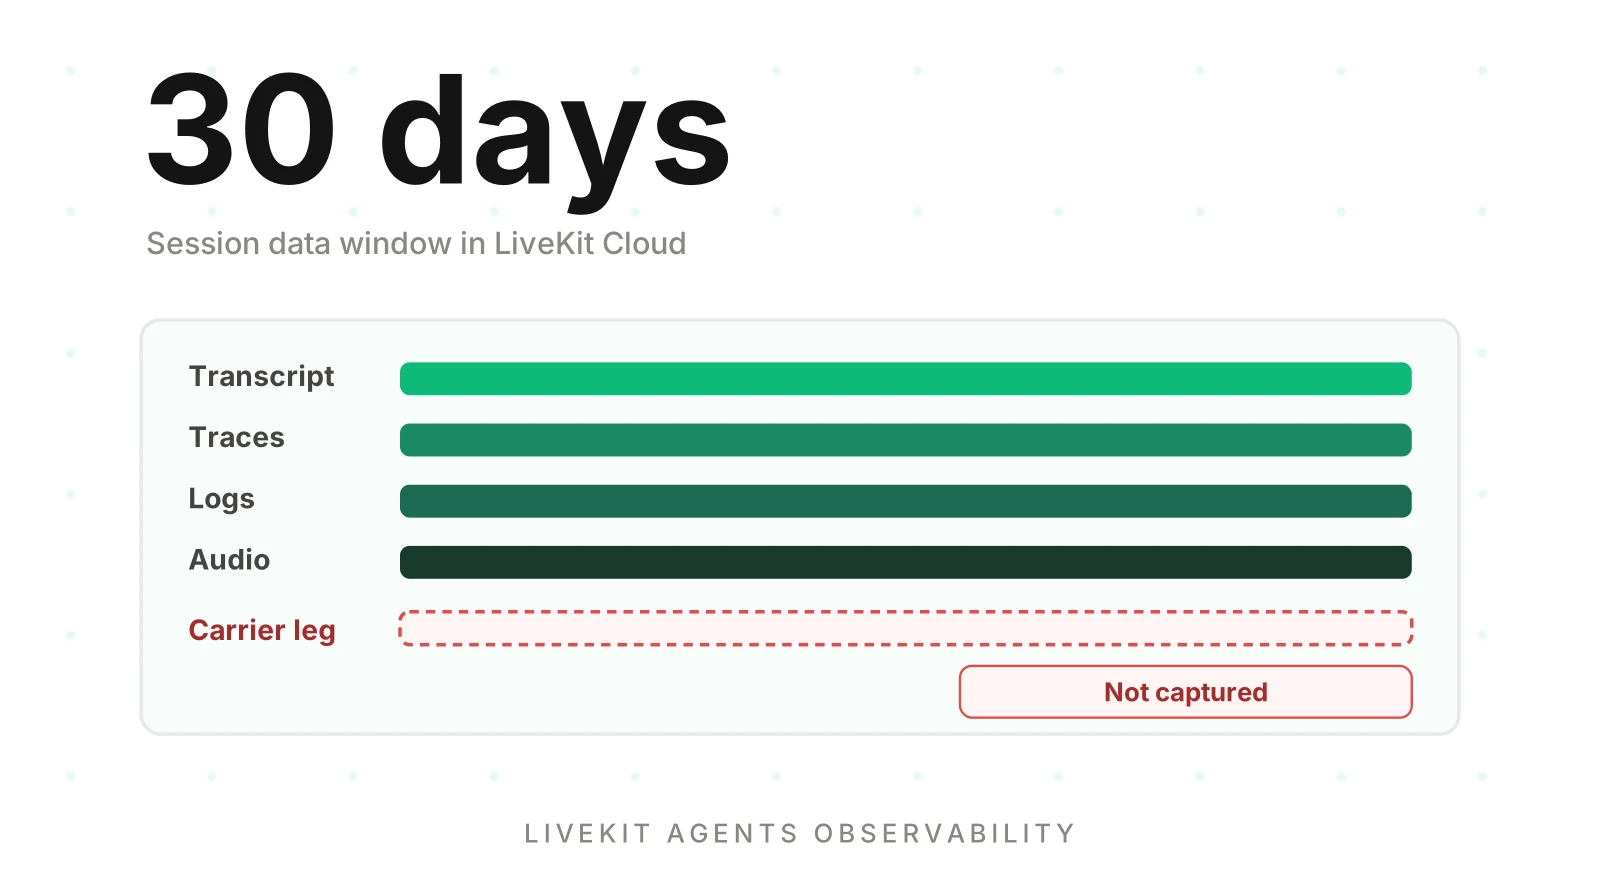
The insights page states a 30-day retention window on every plan. Sharing a session with support does not extend it. So Insights is a debugging window, not an archive. If you need longer, export traces and write session reports to storage you own.
What you still add yourself
LiveKit records the pipeline. It does not know your business. Here is what to add, and which pieces the docs support.
| Gap | What to add | Doc support |
|---|---|---|
| Call-level correlation | One call ID on every span, log and recording. The docs' own example passes metadata to set_tracer_provider, setting a session ID to the room name | Documented pattern |
| Version tags | Prompt version, model names, agent release in the same metadata | Same mechanism, your fields |
| Tool spans | A span per tool call with name, latency, result class and retries | Standard OpenTelemetry API, not a LiveKit page |
| Business outcome | A span or attribute for the result: booked, escalated, write-back failed | Yours entirely |
| Turn fields | Interrupted flag, stop delay, response gap, endpointing wait | Yours; see span attributes post |
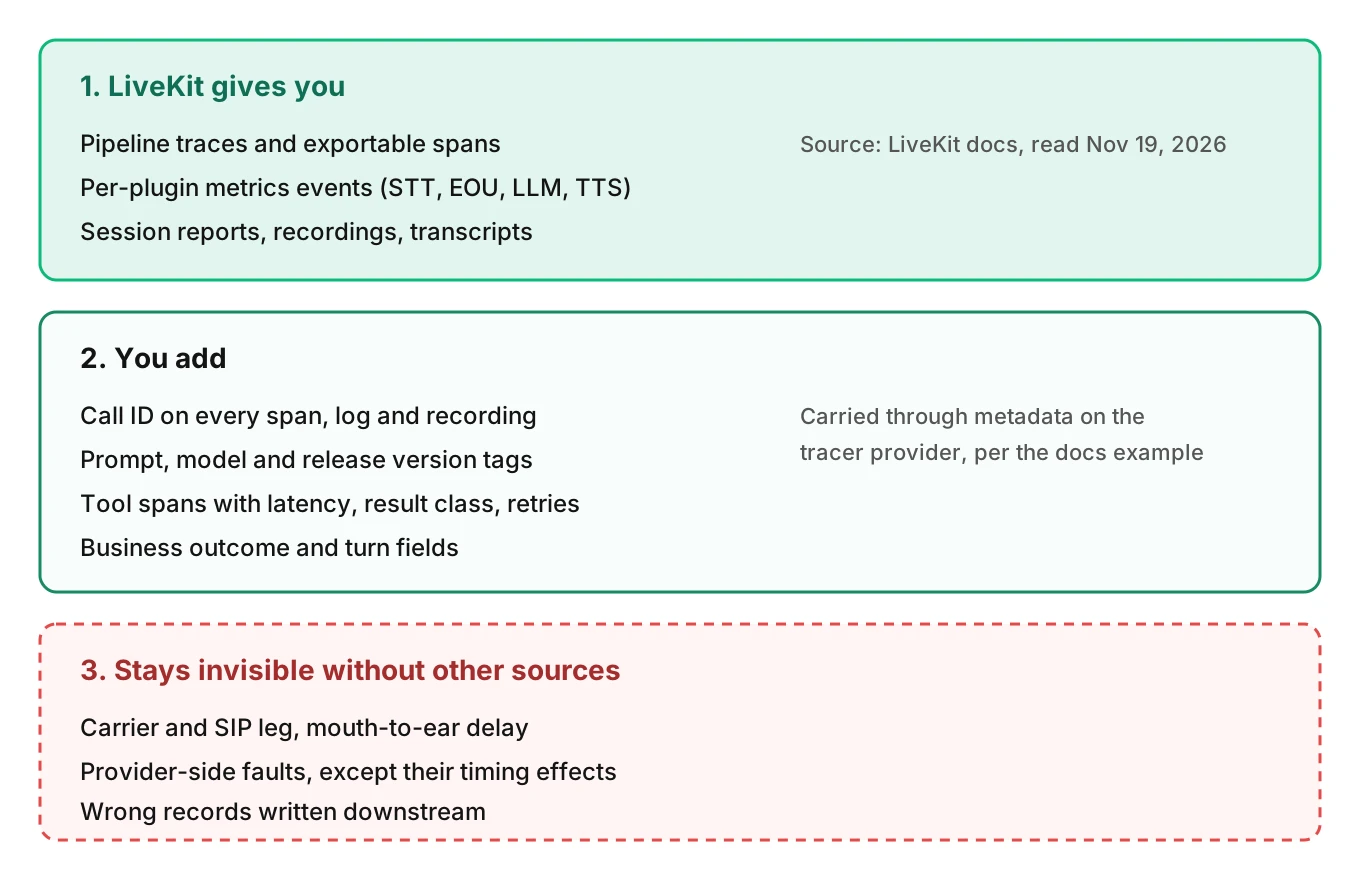
The correlation row is the one that pays off first. Once a call ID is on every span and in every session report, you can join a trace, a recording and a CRM row. Our post on what to log on every voice agent call lists the fields. The tool and outcome spans follow the model in the OpenTelemetry span model for voice agents.
The turn fields come from voice agent span attributes. They answer the complaints callers actually make: it talked over me, it would not stop, it waited too long. You compute them from timestamps your code already sees. Here the framework gives you ingredients, and you decide the fields.
Version tags are easy to skip and costly to lack. Without them, you cannot say whether failures began after a prompt change. A tag on every span turns that into one filter. For the analysis side, see voice agent root cause analysis.
What stays invisible
No LiveKit surface in the docs I read covers everything the caller experienced. Plan for these blind spots.
- The telephony leg. Carrier routing, SIP response codes and mouth-to-ear delay happen outside your agent process. Your own carrier records and SIP logs are the source. See SIP vs WebRTC for voice agents.
- Provider-side faults. A slow or failing STT, LLM or TTS provider appears in LiveKit only as its effect: a late final transcript, a long first token. The provider's own logs hold the cause.
- Realtime-model gaps. As noted above, STT metrics are not emitted by realtime APIs, and some timing fields are empty.
- Your downstream systems. A tool that returns success but writes the wrong record looks healthy in every LiveKit surface.
- Anything outside the retention window. Cloud data past 30 days is gone unless you exported it.
Each blind spot argues for a second source. The overview of voice agent testing, monitoring and observability explains how they fit together.
Privacy defaults to check before you export
Two defaults are easy to miss. First, the export traces page says allow_pii defaults to full span export. Exporters receive conversation content, tool payloads and participant data unless you pass allow_pii=False in Python or allowPii: false in Node.js. An environment variable, LIVEKIT_TELEMETRY_ALLOW_PII, applies when you do not call set_tracer_provider. The explicit argument overrides it.
Second, the PII redaction page says redaction is off by default and covers only data stored in LiveKit Cloud. It calls redaction "best effort" and says detection covers English-language transcripts only. Data outside LiveKit Cloud is not redacted. That includes session.history and Egress recordings.
So if you export traces to your own backend, check what the span attributes carry before you turn it on. Our PII leakage detection post covers where personal data hides in voice stacks. This is not legal advice.
How to export LiveKit Agents telemetry to an OpenTelemetry backend in 5 steps
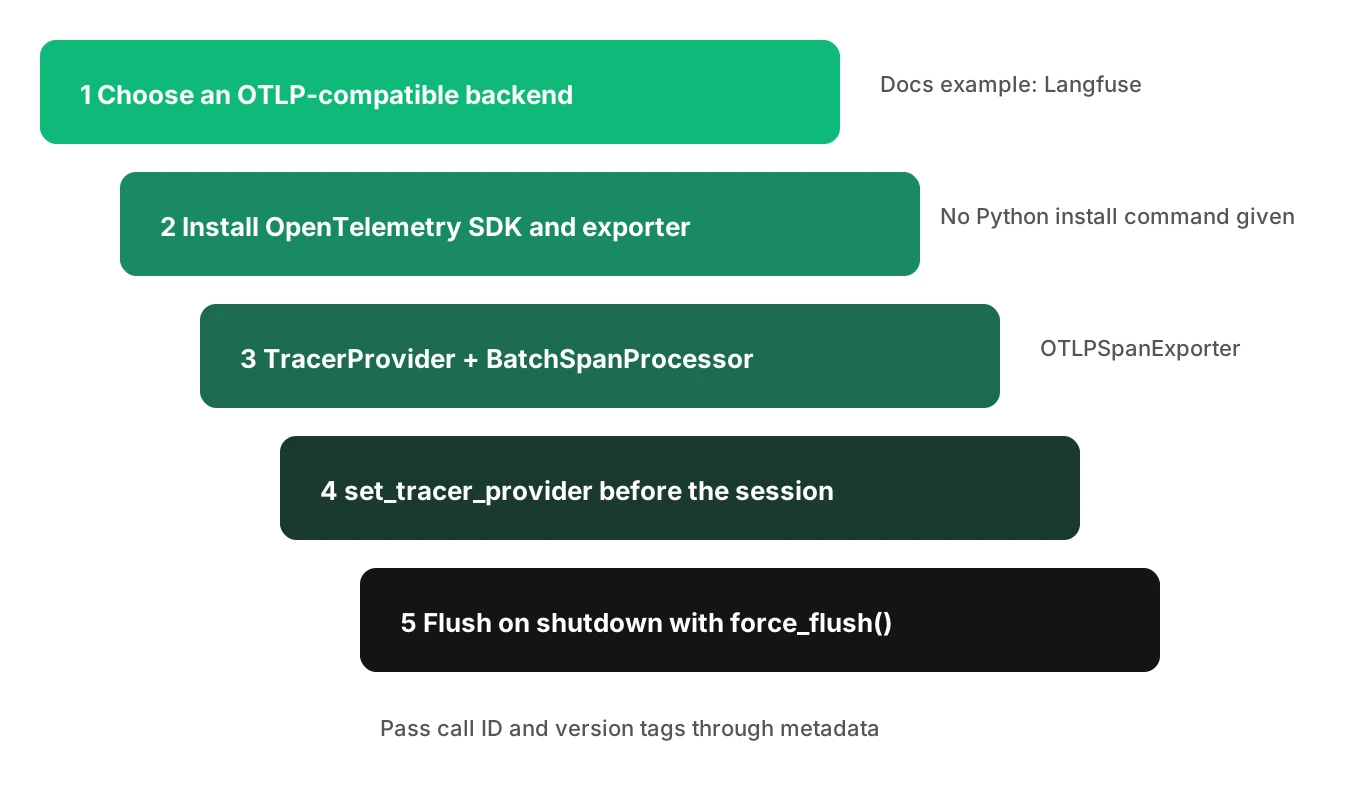
This follows the pattern on the export traces page, simplified. Its worked example targets Langfuse. The pieces below are the documented ones, with the backend left generic. Copy exact code and settings from the page.
1. Choose the backend — Pick any OpenTelemetry-compatible backend that accepts OTLP over HTTP. The docs' example uses Langfuse, which the page describes as an open-source LLM observability platform. Get its endpoint and credentials.
2. Install the OpenTelemetry SDK and exporter — The page requires the OpenTelemetry SDK and an OTLP trace exporter. It gives no Python install command, so use your package manager.
3. Write one setup function — Build a TracerProvider, add a BatchSpanProcessor around OTLPSpanExporter, and register it with set_tracer_provider. Decide your allow_pii setting here.
4. Call it before the session starts — In your entrypoint, call the setup function before creating and starting AgentSession. Pass your call ID and version tags through metadata.
5. Flush on shutdown — Register a callback with ctx.add_shutdown_callback that calls force_flush(), so the last spans leave before the process ends.
# Simplified from the pattern on LiveKit's "Export traces" page (Python).
# Backend endpoint and credentials come from your OpenTelemetry exporter settings.
from livekit.agents.telemetry import set_tracer_provider
from opentelemetry.sdk.trace import TracerProvider
from opentelemetry.sdk.trace.export import BatchSpanProcessor
from opentelemetry.exporter.otlp.proto.http.trace_exporter import OTLPSpanExporter

def setup_tracing(metadata: dict) -> TracerProvider:
    provider = TracerProvider()
    provider.add_span_processor(BatchSpanProcessor(OTLPSpanExporter()))
    set_tracer_provider(provider, metadata=metadata)
    return provider

# In entrypoint(ctx: JobContext), before AgentSession is created and started:
#   provider = setup_tracing({"voice.call.id": ctx.room.name,
#                             "agent.prompt_version": "2026-11-19"})
#   ctx.add_shutdown_callback(<callback that calls provider.force_flush()>)
The attribute names in metadata are examples of your own fields. The docs' example sets a Langfuse session ID to the room name the same way. The Node.js page uses telemetry.setTracerProvider and a registerSpanProcessor callback. Without it, the framework turns off LiveKit Cloud tracing and logs a warning. Check the page for the current signature before you ship.
I did not run this code. It restates documented calls, and the backend-specific parts are left out on purpose.
Where Evalgent fits
Evalgent Observe, which is launching, ingests OpenTelemetry data from any stack. So where your LiveKit setup exports OpenTelemetry, that data can be sent to it. It traces each failure to the step or handoff that caused it and clusters failures into root causes. Where the data cannot support a verdict, the finding is marked undetermined, and coverage gaps are shown. Evalgent never sits in the media path.
Evalgent's production call monitoring is live. Customers push call recordings, and calls are transcribed, mapped to scenarios and judged. It flags PII leakage, tool-call failures, latency spikes and policy failures, with fix recommendations. Evalgent does not offer a LiveKit connector. The LiveKit side is your export, as described above.
Frequently asked questions
What does LiveKit Agents observability include?
LiveKit Agents observability includes OpenTelemetry trace export, per-plugin metrics events, session reports, and audio recordings with transcripts. LiveKit Cloud adds Agent insights, which combines transcripts, traces, logs and audio in one session timeline. As of November 19, 2026, the docs mark none of these as beta.
Does LiveKit Agents support OpenTelemetry?
Yes. The export traces page documents registering a tracer provider with set_tracer_provider and an OTLP span exporter. Spans can go to any compatible backend. The page's worked example uses Langfuse, and it gives Node.js equivalents. It lists attribute namespaces such as lk.* and gen_ai.*, but no span names.
What metrics does LiveKit Agents emit?
Per-plugin metrics_collected events carry STT, end-of-utterance, LLM and TTS measurements. Examples are ttft for the LLM, ttfb for TTS and end_of_utterance_delay. Realtime APIs do not emit STT metrics. The session-level metrics_collected event is marked deprecated; the per-plugin event is not.
Do I need LiveKit Cloud for observability?
Not for everything. Agent insights and the Cloud PII redaction require LiveKit Cloud. Trace export, per-plugin metrics events and session reports run in your own agent process. The session report page says it makes no requests to LiveKit Cloud, so it works for self-hosted deployments.
How long does LiveKit keep session recordings and traces?
The insights page states a 30-day retention window for all agent observability data on every LiveKit Cloud plan. Sharing a session with support does not extend it. If you need a longer record, export traces and write session reports and Egress recordings to your own storage.
Does LiveKit record agent sessions by default?
On LiveKit Cloud, the insights page says omitting the record parameter, or passing record=True, records everything: audio, transcripts, traces and logs. Pass record=False to disable upload for the whole session. A granular options object toggles each part, and omitted keys default to True.
Does LiveKit redact personal data in traces?
Only inside LiveKit Cloud, and only if you turn it on. The docs call redaction best effort, English-only, and off by default. Data outside Cloud, including session.history and Egress recordings, is not redacted. For your own backend, the allow_pii argument controls what spans carry.
What can LiveKit observability not see?
It cannot see the carrier leg, SIP response codes or provider-side faults except through their effects on timing. It cannot see whether a tool wrote the right record downstream. Realtime models leave some timing fields empty. Add your own call IDs, tool spans and outcome fields, and keep carrier and provider logs.
The bottom line
LiveKit Agents observability gives you traces, metrics events, session reports and recordings, with Agent insights as a 30-day window on LiveKit Cloud. Add the call ID, version tags and outcome spans yourself, and keep carrier and provider records for what LiveKit cannot see.
Related Articles

How to automate voice agent testing: synthetic callers vs manual QA
Learn how ai test automation replaces manual QA for voice agents. Compare synthetic callers vs human testers, with a 5-step framework to scale without hiring.
Read more
AI Agent Testing vs Voice Agent Testing: What General Tools Miss for Voice
AI agent testing measures text outputs. Voice agent testing measures behaviour through an acoustic pipeline. Five failure categories general tools miss.
Read more