Open door for builders.
Pipecat Deployment in Production: A Self-Hosting Blueprint for Phone Agents
On this page
Locally, Pipecat is easy: run `python bot.py -t twilio`, call your number, and talk to a working agent. Production asks harder questions. Where does the bot process run? How many calls fit in one container? What happens to a caller mid-sentence when you ship a fix at 2 p.m.?
The Pipecat maintainers say it plainly. In GitHub issue #3987, a user asked for "battle-tested" self-hosting blueprints. The reply: "On self-hosted deployment docs, this is the one area where I fully agree there's a gap." The production guide names the concerns. It deliberately stops short of a blueprint.
This post is that blueprint, scoped to phone agents run by a small in-house team on Twilio or Telnyx. It covers the process model, a reference architecture, code and manifests, capacity math, drain-safe releases, and a load and soak protocol with pass criteria.
Two findings from the source code drive much of the design. First, uvicorn closes every open WebSocket with code 1012 the moment it gets SIGTERM. A long grace period does nothing for a Twilio media stream unless you drain before that signal. Second, current Pipecat runs Smart Turn v3 on your CPU by default. Every call you host pays for a local model.
The process model decides everything
At runtime, a Pipecat bot is an asyncio program. Audio frames move through a chain of processors (transport input, STT, context aggregator, LLM, TTS, transport output), each a coroutine passing frames through queues.
On a Twilio call, inbound audio arrives as base64 mu-law chunks of about 20 ms each over a WebSocket (Twilio Media Streams docs). That's roughly 50 inbound messages per second, per call. Outbound TTS audio flows the other way at the same cadence. The event loop has to touch every one of those frames on time.
What runs on the loop and what doesn't
Most of the pipeline is I/O. The STT, LLM, and TTS calls are network streams, so the loop just waits on sockets. That part scales well in one process.
The local models are different. Here is where they run in Pipecat 1.12.0, released September 25, 2026:
- Silero VAD runs on every inbound audio chunk. At 8 kHz, Pipecat feeds it 256-sample windows, which is 32 ms of audio. That's about 31 inferences per second per call. Pipecat runs it in a one-thread `ThreadPoolExecutor` per analyzer, with ONNX Runtime set to one intra-op thread.
- Smart Turn v3 is now the default user-turn stop strategy. `default_user_turn_stop_strategies()` returns `TurnAnalyzerUserTurnStopStrategy(turn_analyzer=LocalSmartTurnAnalyzerV3())`. It runs once per candidate pause, on up to 8 seconds of audio, also in its own executor thread.
- Resampling, serialization, and frame bookkeeping run on the loop itself. They include mu-law decode, 8 kHz to 16 kHz resampling for STT or Smart Turn, base64, and JSON.
Because the model calls sit in executor threads and ONNX Runtime releases the GIL while a model runs, a short inference doesn't freeze the loop. But the Python around it still contends for the GIL. Pre- and post-processing, numpy feature extraction, and the frame machinery all do. Several busy calls in one interpreter share one GIL. PEP 703 free-threaded builds may change this later. Your native dependencies have to support them first, so don't plan capacity around it today.
Why "one call, one process" keeps coming up
The Pipecat production guide describes the bot as "a per-session process" that "runs one conversation and exits." The reasons are concrete:
1. Isolation. A leaked task, a native crash in an ONNX op, or a runaway tool call takes down one caller, not twenty.
2. True parallelism. Separate processes don't share a GIL.
3. Clean memory. When the process exits, everything it allocated is gone. No slow leak builds up across thousands of calls.
The cost is memory and start time: each process imports Pipecat, loads two ONNX sessions, and opens provider connections.
There are three practical packing shapes:
| Shape | How it works | Strength | Weakness | Fits |
|---|---|---|---|---|
| Process per call (VM or subprocess) | Dispatcher spawns a fresh process or VM per session | Strongest isolation, no GIL sharing | Cold start per call; WebSocket transports need extra plumbing | Daily or LiveKit room transports |
| Many calls per process | One uvicorn process accepts many WebSockets, one pipeline task each | Simplest, lowest memory | One stall or crash hits every call in the process | Dev and low volume only |
| Small pods, capped calls | One process per container, hard cap of a few calls, many replicas | Bounded blast radius, simple routing | More pods to run | Twilio or Telnyx WebSocket fleets |
For phone agents on carrier WebSockets, the third shape usually wins. The WebSocket terminates in the process that accepted it. You can't hand an open socket to a fresh subprocess without awkward file-descriptor passing. So the honest choice is to keep calls in the accepting process, keep that process small, and cap it hard. A cap of 4 to 8 calls on 2 vCPU is a reasonable place to start measuring. Treat that as a starting assumption, not a benchmark.
Reference architecture for a phone agent
Here's the blueprint at one glance.
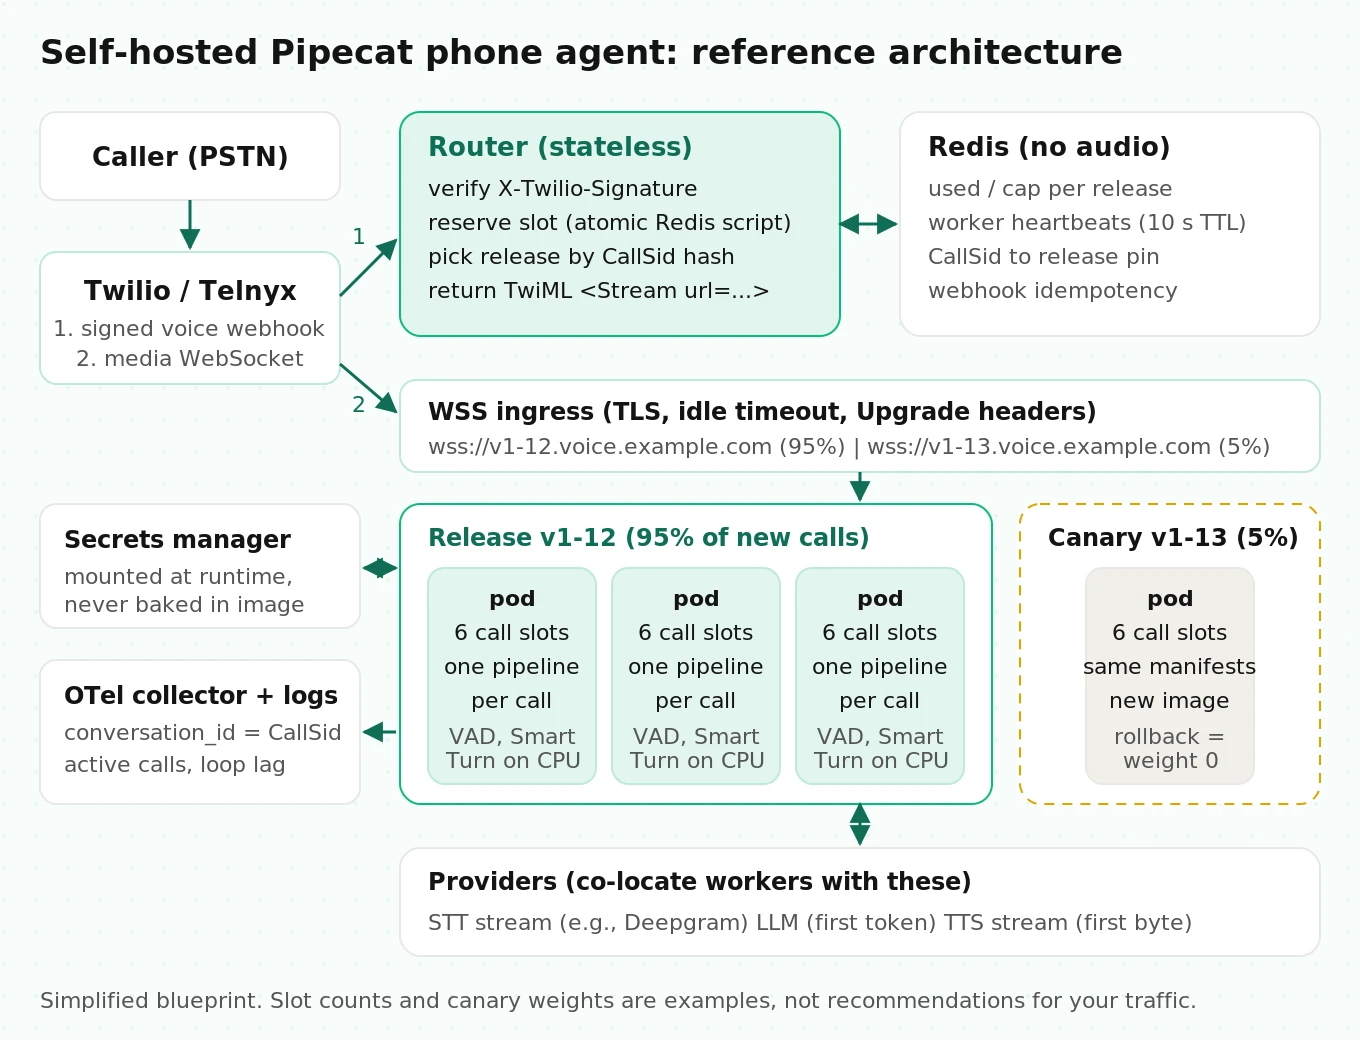
Five components carry it:
1. Call entry. The carrier (Twilio, Telnyx, Plivo) sends a signed voice webhook when a call arrives.
2. Router. A small stateless service verifies the signature, admits or rejects the call, picks a release version, and returns TwiML pointing the media stream at a worker URL.
3. Worker fleet. Pods running your Pipecat bot server. Each accepts a capped number of media WebSockets and runs one `PipelineWorker` per call.
4. Shared state. Redis holds slot counters, worker heartbeats, the call-to-version map, and webhook idempotency keys. It never holds audio.
5. Telemetry. An OpenTelemetry collector receives Pipecat's per-turn spans. Logs carry the CallSid on every line.
Two entry paths, two very different fleets
The entry path changes your networking more than any other choice.
Carrier WebSocket (Twilio, Telnyx). The carrier opens an inbound WebSocket to your fleet. Your workers need public ingress, TLS, a WebSocket-capable load balancer, and idle-timeout tuning. Media billing stays with the carrier.
Room-based SIP or PSTN (Daily, LiveKit). The call lands in a hosted room. Your dispatcher starts a bot that joins the room as a client. Workers make only outbound connections. That means no public ingress, no load balancer in the media path, and no WebSocket timeouts to tune. You pay the room provider per minute. As of October 2026, Daily charges $0.025 per minute for PSTN inbound and outbound calls, plus $2 per month for each US phone number (pricing).
If you don't want to run public WebSocket ingress, the room path often earns its fee (see SIP vs WebRTC). The rest of this post assumes the harder case: Twilio Media Streams straight into your fleet.
The TwiML webhook is your router
Here's the idea most self-hosting guides miss: with Twilio, the webhook response is the routing decision. Whatever URL you write into `
That one string gives you three controls:
- Admission. If the fleet has no free slots, return TwiML that plays a hold message, sends the call to a human queue, or plays a callback offer. Don't open a stream to an overloaded worker.
- Version pinning. Point canary calls at `wss://v1-13.voice.example.com/ws` and the rest at `wss://v1-12.voice.example.com/ws`. A call never changes version mid-call. Its socket is pinned.
- Drain. Stop handing out a version's hostname and new calls stop arriving there. Live calls continue.
Here's a simplified router. It's illustrative, not a drop-in service:
# router.py (simplified): Twilio voice webhook -> admission + version pin
import hashlib, os
import redis.asyncio as redis
from fastapi import FastAPI, Request, Response
from twilio.request_validator import RequestValidator

app = FastAPI()
r = redis.from_url(os.environ["REDIS_URL"])
validator = RequestValidator(os.environ["TWILIO_AUTH_TOKEN"])

# Weighted release table, editable at runtime (e.g., stored in Redis).
RELEASES = {"v1-12": 95, "v1-13": 5}

# Atomic reserve: succeed only if fleet capacity for this version has room.
RESERVE = r.register_script("""
local used = tonumber(redis.call('GET', KEYS[1]) or '0')
local cap  = tonumber(redis.call('GET', KEYS[2]) or '0')
if used < cap then redis.call('INCR', KEYS[1]) return 1 end
return 0
""")

def pick_release(call_sid: str) -> str:
    bucket = int(hashlib.sha256(call_sid.encode()).hexdigest(), 16) % 100
    acc = 0
    for name, weight in RELEASES.items():
        acc += weight
        if bucket < acc:
            return name
    return next(iter(RELEASES))

@app.post("/voice")
async def voice(request: Request):
    form = dict(await request.form())
    url = str(request.url)  # must match the public URL Twilio signed
    if not validator.validate(url, form, request.headers.get("X-Twilio-Signature", "")):
        return Response(status_code=403)

    call_sid = form["CallSid"]
    # Twilio may retry a webhook: make the decision idempotent per CallSid.
    release = (await r.get(f"call:{call_sid}:release") or b"").decode() or pick_release(call_sid)
    if not await r.exists(f"call:{call_sid}:release"):
        if not await RESERVE(keys=[f"used:{release}", f"cap:{release}"]):
            twiml = "<Response><Say>All agents are busy. Please hold.</Say><Enqueue>overflow</Enqueue></Response>"
            return Response(twiml, media_type="application/xml")
        await r.set(f"call:{call_sid}:release", release, ex=4 * 3600)

    twiml = (
        "<Response><Connect>"
        f'<Stream url="wss://{release}.voice.example.com/ws">'
        f'<Parameter name="release" value="{release}"/>'
        "</Stream></Connect></Response>"
    )
    return Response(twiml, media_type="application/xml")
Workers decrement `used:
The Pipecat telephony guide makes the same point about verification. Carrier webhooks are public URLs, so check `X-Twilio-Signature` in production (Telephony in Production).
What lives in Redis, and what doesn't
| Key | Purpose | TTL |
|---|---|---|
| `used: | Fleet admission | None; reconciled from heartbeats |
| `worker: | Heartbeat: release, active, capacity, draining, loop lag | 10 s |
| `call: | Version pin, webhook idempotency | Max call length plus margin |
| `call: | Optional: slots filled so far, for crash recovery | Same |
Keep conversation context out of Redis unless you plan to resume crashed calls on a new worker. That's a product decision, not a default.
Secrets
Provider keys belong in a secrets manager mounted at runtime, not in the image. The Pipecat guide says the same: "Avoid baking keys into images." Use one secret per region if you run regional fleets. Rotate on a schedule your providers support.
The container image
The official Pipecat Dockerfile example pulls Silero through `torch.hub`. For the built-in analyzers, you don't need that step. Pipecat 1.12.0 ships both ONNX files inside the wheel: `silero_vad.onnx` (2.3 MB) and `smart-turn-v3.2-cpu.onnx` (8.7 MB). Loading them needs `onnxruntime`, not PyTorch. Leaving torch out can cut the image by hundreds of megabytes. A smaller image means faster pulls and faster scale-up.
The second lesson comes from Daily's own base image, `dailyco/pipecat-base`. Its Dockerfile runs `tini` as PID 1. The comment explains why: "The kernel does not apply default signal dispositions to PID 1: a signal with no handler is discarded." With Python as PID 1, a SIGTERM that lands during a slow import is silently dropped. The pod then keeps serving until the SIGKILL at the end of the grace period. Daily's comment notes that can be "up to two hours later" on their platform.
# Simplified worker image for a Pipecat phone agent.
FROM python:3.12-slim-bookworm

RUN apt-get update && apt-get install -y --no-install-recommends tini \
    && rm -rf /var/lib/apt/lists/*

COPY --from=ghcr.io/astral-sh/uv:latest /uv /usr/local/bin/uv
WORKDIR /app

# Lockfile first for layer caching. Extras: pick only what the bot uses.
COPY pyproject.toml uv.lock ./
RUN uv sync --locked --no-dev --no-install-project
# pyproject pins e.g. pipecat-ai[websocket,silero,deepgram,cartesia,openai,tracing]==1.12.0

# Sentence-splitting data used by TTS aggregation (from Pipecat's own example).
RUN .venv/bin/python -m nltk.downloader punkt_tab -d /usr/local/share/nltk_data

COPY worker.py bot.py drain.py ./
ENV PATH="/app/.venv/bin:$PATH" PYTHONUNBUFFERED=1

RUN useradd -u 10001 bot && chown -R bot /app
USER bot

# tini as PID 1 so SIGTERM is delivered and children are reaped.
ENTRYPOINT ["/usr/bin/tini", "--"]
CMD ["uvicorn", "worker:app", "--host", "0.0.0.0", "--port", "8080", "--ws-ping-interval", "20"]
Run one uvicorn worker per container. Don't pass `--workers N`. Multiple workers share a listening socket, and the kernel hands new connections to whichever process accepts first. That process knows nothing about your per-process call cap.
The worker: capacity, drain, and honest health checks
The worker is a small FastAPI app around your existing `bot.py`. It enforces the call cap, exposes a drain switch, reports health that reflects capacity, and measures event-loop lag.
# worker.py (simplified): Twilio media WebSocket -> one PipelineWorker per call
import asyncio, os, time
from fastapi import FastAPI, WebSocket
from fastapi.responses import JSONResponse
from pipecat.runner.utils import parse_telephony_websocket
from pipecat.serializers.twilio import TwilioFrameSerializer
from pipecat.transports.websocket.fastapi import FastAPIWebsocketParams, FastAPIWebsocketTransport
from bot import run_bot  # builds Pipeline + PipelineWorker, awaits WorkerRunner.run()

MAX_CALLS = int(os.getenv("MAX_CALLS", "6"))
app = FastAPI()
state = {"active": 0, "draining": False, "loop_lag_ms": 0.0, "models_ready": False}

@app.on_event("startup")
async def startup():
    asyncio.create_task(loop_lag_probe())
    # Warm-up: build a VAD + Smart Turn analyzer once so the first call
    # does not pay ONNX session creation (implementation omitted).
    state["models_ready"] = True

async def loop_lag_probe(interval: float = 0.1):
    while True:
        t0 = time.perf_counter()
        await asyncio.sleep(interval)
        state["loop_lag_ms"] = (time.perf_counter() - t0 - interval) * 1000

@app.websocket("/ws")
async def media(ws: WebSocket):
    await ws.accept()
    if state["draining"] or state["active"] >= MAX_CALLS:
        await ws.close(code=1013)  # "try again later"; the router should prevent this
        return
    state["active"] += 1
    try:
        _, call = await parse_telephony_websocket(ws)
        serializer = TwilioFrameSerializer(
            stream_sid=call["stream_id"], call_sid=call["call_id"],
            account_sid=os.environ["TWILIO_ACCOUNT_SID"],
            auth_token=os.environ["TWILIO_AUTH_TOKEN"],
        )
        transport = FastAPIWebsocketTransport(ws, FastAPIWebsocketParams(
            audio_in_enabled=True, audio_out_enabled=True,
            add_wav_header=False, serializer=serializer,
        ))
        await run_bot(transport, call_id=call["call_id"], release=call["body"].get("release"))
    finally:
        state["active"] -= 1
        # also: DECR used:<release> in Redis, emit call-ended metric

@app.post("/drain")
async def drain():
    state["draining"] = True
    return {"active": state["active"]}

@app.get("/calls")
async def calls():
    return {"active": state["active"], "draining": state["draining"]}

@app.get("/livez")   # liveness: is the event loop alive? Never check providers here.
async def livez():
    ok = state["loop_lag_ms"] < 1000
    return JSONResponse({"loop_lag_ms": state["loop_lag_ms"]}, status_code=200 if ok else 503)

@app.get("/readyz")  # readiness: should this pod receive NEW calls?
async def readyz():
    ok = state["models_ready"] and not state["draining"]
    return JSONResponse({"ready": ok, **state}, status_code=200 if ok else 503)
Inside `run_bot`, build the pipeline exactly as the twilio-chatbot example does. Set `audio_in_sample_rate=8000` and `audio_out_sample_rate=8000` on `PipelineParams` to avoid needless resampling. Then add two production settings:
# Inside run_bot (simplified)
worker = PipelineWorker(
    pipeline,
    params=PipelineParams(audio_in_sample_rate=8000, audio_out_sample_rate=8000,
                          enable_metrics=True, enable_usage_metrics=True),
    enable_tracing=True,
    enable_turn_tracking=True,                     # default False; needed for per-turn spans
    conversation_id=call_id,                       # CallSid joins traces to carrier logs
    additional_span_attributes={"release": release, "pod": os.environ["HOSTNAME"]},
    idle_timeout_secs=300,                         # Pipecat default: ends silent, stuck calls
)
runner = WorkerRunner(handle_sigint=False, force_gc=True)
await runner.run(worker)
Note what's missing: `handle_sigterm=True`. In `WorkerRunner`, that flag installs a handler that cancels the runner. That's the right behavior for a laptop and the wrong one for a drain. You want SIGTERM to mean "stop taking calls," not "hang up on everyone."
Three probes, three different questions
| Probe | Question it answers | Checks | Must never check |
|---|---|---|---|
| startupProbe | Are models loaded and warm? | ONNX sessions built, one dummy inference run | Provider reachability |
| livenessProbe | Is the event loop alive? | Loop lag under 1 s | Providers, Redis, call count |
| readinessProbe | Should this pod get new calls? | Not draining, models ready | Provider health (route around it instead) |
The most expensive mistake here is a liveness probe that calls Deepgram or your LLM. During a provider outage, Kubernetes restarts every pod at once and drops every live call. That turns a degraded hour into a total outage.
Graceful drain: the part that drops calls
The Pipecat production guide warns that Kubernetes' default `terminationGracePeriodSeconds` of 30 seconds will drop calls. It says to "crank that up dramatically" and pair it with a `preStop` hook. That's correct and incomplete. Here's the missing mechanism.
Why a long grace period alone still drops every Twilio call
Look at uvicorn 0.54.0's shutdown path. On SIGTERM, `Server.shutdown()` stops accepting connections. Then it calls `connection.shutdown()` on every open connection, right away. For an HTTP connection, that lets the in-flight response finish. For a WebSocket, the `websockets` implementation calls `fail_connection(1012)`, and the `wsproto` one sends `CloseConnection(code=1012)`. Code 1012 means "service restart."
So with Twilio media streams terminating in uvicorn, every live call drops the instant SIGTERM arrives, whether the grace period is 30 seconds or 2 hours. Pipecat Cloud's WebRTC sessions don't hit this. There the bot runs inside an HTTP request handler, and uvicorn waits for HTTP responses. Carrier WebSockets are the exposed case.
The fix is to do all the waiting before SIGTERM. Kubernetes runs the `preStop` hook first and sends SIGTERM only after the hook returns. Both share the grace period budget (pod lifecycle docs). So the hook must flip the drain switch, then block until active calls reach zero or a deadline passes.
# drain.py (simplified): run as an exec preStop hook
import json, sys, time, urllib.request

BASE, DEADLINE_S = "http://127.0.0.1:8080", int(sys.argv[1]) if len(sys.argv) > 1 else 1700
urllib.request.urlopen(urllib.request.Request(f"{BASE}/drain", method="POST"), timeout=5)
start = time.time()
while time.time() - start < DEADLINE_S:
    active = json.load(urllib.request.urlopen(f"{BASE}/calls", timeout=5))["active"]
    if active == 0:
        sys.exit(0)
    time.sleep(2)
sys.exit(0)  # deadline hit: SIGTERM follows; remaining calls drop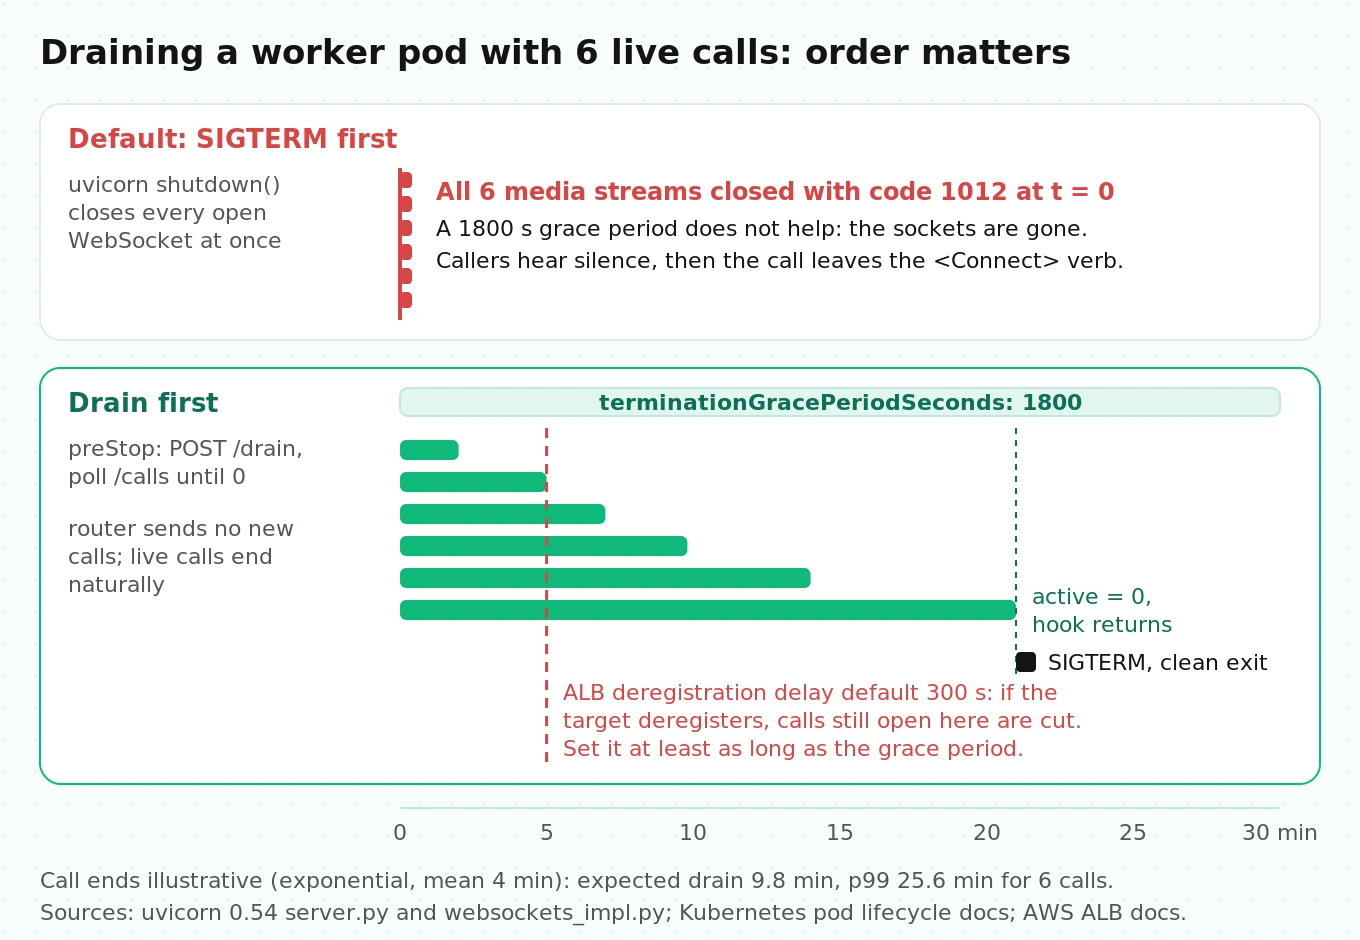
How long should the grace period be?
Use math, not a round number. Say each pod holds k calls when the drain starts. The drain lasts until the last of them ends.
Worked example (assumption: exponential call durations, mean 4 minutes). Exponential durations are memoryless, so each live call's remaining time has the same 4-minute mean. The expected time for the last of k calls to finish is the mean times the k-th harmonic number, H_k:
- k = 6: H_6 = 2.45, so the expected drain is 4 × 2.45 ≈ 9.8 minutes.
- For 99% of six-call pods to drain naturally: solve (1 − e^(−t/4))^6 = 0.99. That gives t ≈ 25.6 minutes.
So `terminationGracePeriodSeconds: 1800` with a 1,700-second preStop deadline covers this profile. Real call durations usually have a heavier tail than exponential: a few callers stay on for 40 minutes. Pull your own p99.9 duration from carrier logs. Enforce a maximum call length in the bot so the tail is bounded. Daily's base image does the same with a session budget (`maxSessionDuration`) that cancels the bot when it expires.
There's a consequence for release speed. A rolling update with `maxSurge: 25%` on 8 pods runs about 4 waves. Each wave waits roughly one drain, so 4 × 10 minutes is about 40 minutes per release. Setting `maxSurge: 100%` makes it one wave. You briefly pay for double capacity, but you never block on serial drains.
Load balancer gotchas that cut calls
Three defaults bite WebSocket media in particular:
- ALB deregistration delay: 300 seconds by default (AWS docs). When a target deregisters, the ALB waits that long and then completes deregistration, which closes connections still open. If readiness failing deregisters your pod (as with IP-mode targets), any call over 5 minutes gets cut. Set the delay at least as long as your grace period, or keep failed readiness from deregistering active pods.
- ALB idle timeout: 60 seconds by default (AWS docs). Twilio's continuous 20 ms audio usually keeps the socket busy. But a stalled pipeline, a hold segment with the stream paused, or a browser client that stops sending when muted can trip it. Uvicorn's `--ws-ping-interval` adds keepalive traffic.
- Nginx `proxy_read_timeout`: 60 seconds by default (Nginx docs). Nginx also needs `proxy_http_version 1.1` and the `Upgrade` and `Connection` headers forwarded, or the WebSocket handshake fails outright.
Kubernetes manifests
Here's a simplified per-release Deployment. Each release gets its own Deployment and Service, so the router's hostname maps to exactly one version.
# Simplified. One Deployment + Service per release (v1-12, v1-13, ...).
apiVersion: apps/v1
kind: Deployment
metadata:
  name: pipecat-worker-v1-12
  labels: { app: pipecat-worker, release: v1-12 }
spec:
  strategy:
    rollingUpdate: { maxSurge: "100%", maxUnavailable: 0 }
  selector: { matchLabels: { app: pipecat-worker, release: v1-12 } }
  template:
    metadata:
      labels: { app: pipecat-worker, release: v1-12 }
    spec:
      terminationGracePeriodSeconds: 1800
      containers:
        - name: worker
          image: registry.example.com/pipecat-worker:1.12.0-a1b2c3d
          ports: [{ containerPort: 8080 }]
          env:
            - { name: MAX_CALLS, value: "6" }
          envFrom:
            - secretRef: { name: voice-provider-keys }
          resources:
            requests: { cpu: "2", memory: "3Gi" }
            limits:   { memory: "3Gi" }     # no CPU limit: see CFS note below
          startupProbe:
            httpGet: { path: /readyz, port: 8080 }
            periodSeconds: 2
            failureThreshold: 60
          livenessProbe:
            httpGet: { path: /livez, port: 8080 }
            periodSeconds: 10
            failureThreshold: 3
          readinessProbe:
            httpGet: { path: /readyz, port: 8080 }
            periodSeconds: 5
          lifecycle:
            preStop:
              exec: { command: ["python", "/app/drain.py", "1700"] }
---
apiVersion: policy/v1
kind: PodDisruptionBudget
metadata: { name: pipecat-worker-v1-12 }
spec:
  maxUnavailable: 1
  selector: { matchLabels: { app: pipecat-worker, release: v1-12 } }
Leave the CPU limit off on purpose. Kubernetes CPU limits use Linux CFS quotas, enforced per scheduling period (100 ms by default). When a pod uses its quota early in a period, all its threads stall until the next one. That stall can be tens of milliseconds, long enough to miss several 20 ms audio frames. Callers hear it as choppy audio that never shows up in average CPU graphs. Set requests accurately, set a memory limit, and isolate noisy neighbors with node pools instead.
Autoscale on active calls, not CPU
CPU swings with how much callers talk, not with how full a pod is. Scale on active calls per pod. With KEDA's Prometheus scaler:
apiVersion: keda.sh/v1alpha1
kind: ScaledObject
metadata: { name: pipecat-worker-v1-12 }
spec:
  scaleTargetRef: { name: pipecat-worker-v1-12 }
  minReplicaCount: 4          # warm floor: covers the first minutes of a burst
  maxReplicaCount: 40
  cooldownPeriod: 900
  advanced:
    horizontalPodAutoscalerConfig:
      behavior:
        scaleUp:   { stabilizationWindowSeconds: 0 }
        scaleDown: { stabilizationWindowSeconds: 900 }
  triggers:
    - type: prometheus
      metadata:
        serverAddress: http://prometheus.monitoring:9090
        query: sum(pipecat_active_calls{release="v1-12"})
        threshold: "4"        # target 4 of 6 slots per pod (67%)
The threshold is the target calls per pod. Targeting 4 of 6 leaves two slots per pod to absorb arrivals while new pods schedule, pull the image, and pass the startup probe.
Scale-down has its own trap. The HPA picks which pods to remove, and it may pick a busy one. The preStop drain keeps that safe but slow. To make Kubernetes prefer idle pods, have each worker set the `controller.kubernetes.io/pod-deletion-cost` annotation to its active call count when that count changes. Pods with lower cost are deleted first.
Capacity math: from calls per month to pods
Most teams size from a guess. Here's the arithmetic, using two results from queueing theory.
Step 1: Little's law gives average concurrency
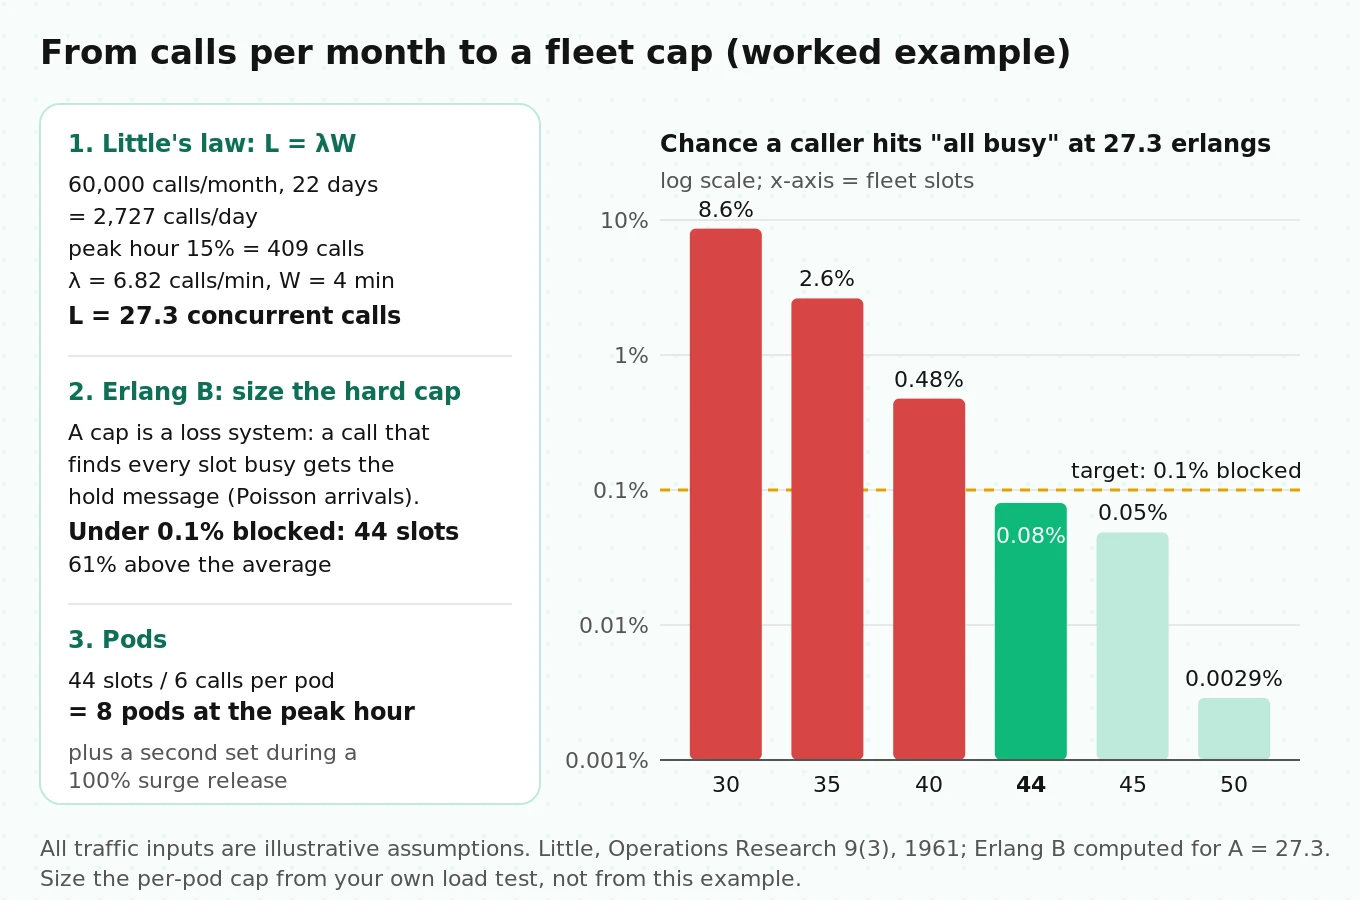
Little's law (Little, 1961) says L = λW. Average concurrency equals the arrival rate times the average time in the system. It holds for any stable system, whatever the arrival or duration distribution.
Worked example (all inputs are assumptions; swap in yours):
- 60,000 calls per month, 4-minute average handle time.
- 22 business days, so about 2,727 calls per day.
- The peak hour carries 15% of daily volume: about 409 calls, or 6.82 calls per minute.
- L = 6.82 × 4 ≈ 27.3 concurrent calls in the peak hour (27.3 erlangs).
Step 2: Erlang B sizes the hard cap
Little's law gives the average. Your admission cap is a hard limit: a call that arrives when every slot is full gets the hold message. That's a loss system. The Erlang B formula gives the probability that an arrival finds every slot busy, assuming Poisson arrivals. For 27.3 erlangs:
| Slots (fleet cap) | Probability a caller hits "all busy" |
|---|---|
| 30 | 8.6% |
| 35 | 2.6% |
| 40 | 0.48% |
| 45 | 0.05% |
| 50 | 0.003% |
To keep blocking under 0.1%, you need 44 slots. That's 61% above the average. At 6 slots per pod, that's 8 pods at the peak hour.
Then add the drain overhead. During a release, old pods hold their remaining calls but accept none. With `maxSurge: 100%`, the new release needs its own full 44 slots while the old one drains.
Step 3: Size the pod on CPU bursts, not averages
Now the per-call CPU budget. Every number here is either sourced or marked as yours to measure:
| Component | Cost | Source |
|---|---|---|
| Silero VAD | Under 1 ms per 30+ ms chunk on one thread. At about 31 chunks/s, that's at most about 3% of a core | Silero README |
| Smart Turn v3 | 12.6 ms (c7a.2xlarge), 15.2 ms (c8g.2xlarge), 33.8 ms (t3.2xlarge), 59.8 ms (c8g.medium), 94.8 ms (t3.medium) per check, preprocessing included | Daily |
| Mu-law decode, resampling, serialization, frame plumbing | Measure: profile one call with py-spy | Yours |
| Recording buffer (if enabled) | Memory, not CPU: sample rate × 2 bytes × channels × seconds | Arithmetic |
Worked example (assumptions): a caller triggers about 12 Smart Turn checks per minute at 60 ms each. That's 0.72 s of CPU per minute, about 1.2% of a core on average. Add up to 3% for VAD and an assumed 5% for frame plumbing, and the average is under 10% of a core per call. On averages alone, a 2-vCPU pod would hold 20 calls.
Don't size that way. A Smart Turn check is a 60 ms burst at the exact moment the caller stops talking, when latency matters most, and six callers can pause in the same second. Set the ceiling with a load test that watches event-loop lag and turn latency. Pipecat Cloud's `agent-1x` profile, "best for voice agents," gives each session 0.5 vCPU and 1 GB for the same reason: headroom for bursts.
The recording buffer deserves its own line. Pipecat's Twilio example warns that `AudioBufferProcessor` "will save all the conversation in memory" unless you pass `buffer_size`. At 16 kHz stereo, a 30-minute call holds 16,000 × 2 × 2 × 1,800 bytes, about 115 MB. Six of those in one pod is 690 MB of audio you forgot about. Flush in chunks to object storage.
Step 4: Check the providers and the carrier
Your fleet is rarely the first ceiling. At 44 concurrent calls you need 44 concurrent STT streams, up to 44 TTS streams, and an LLM tier sized for your turn rate. On outbound campaigns, Twilio's Programmable Voice default is 1 call per second per account (Twilio support). Inbound calls aren't CPS-limited. Our concurrency failure guide covers how provider limits show up as dead air rather than errors.
Region placement: count the round trips
Where should the worker live: near the caller, or near the providers? Count round trips per turn.
The media leg (caller to carrier to worker) adds its delay roughly once in each direction per turn. The provider path is sequential: the STT final, then the LLM's first token, then the TTS's first byte. That's three or more round trips stacked inside every turn. A worker placed far from its providers pays that distance three times.
So co-locate workers with your STT, LLM, and TTS endpoints first, then pick the carrier edge nearest the workers. ITU-T G.114 recommends keeping one-way mouth-to-ear delay under 150 ms for interactive voice. AI pipelines already spend far more than that on processing, so every round trip you remove is audible. Our latency breakdown shows where the milliseconds go.
Observability: one ID, three layers
Pipecat has built-in OpenTelemetry tracing (docs). Install `pipecat-ai[tracing]`, call `setup_tracing(service_name=..., exporter=...)` once at process start, and pass `enable_tracing=True` plus `enable_turn_tracking=True` (it defaults to off) to `PipelineWorker`. Traces come out as a conversation span with one span per turn, and `stt`, `llm`, and `tts` child spans under each turn. Each child carries `metrics.ttfb`. Turn spans include `turn.was_interrupted`.
Set `conversation_id` to the Twilio CallSid. Then one ID joins three layers: carrier call logs, your structured app logs, and the trace. The Pipecat guide calls a propagated session ID "the load-bearing piece," and it's right.
Fleet metrics to export from the worker:
- `pipecat_active_calls` and `pipecat_call_capacity` per pod (autoscaling and admission)
- `event_loop_lag_ms` as a histogram (your best early warning)
- Calls rejected at the router, by reason (capacity, draining, signature)
- Call end reason: caller hangup, bot end, idle timeout, error, drain deadline
- Process RSS sampled at call end (leak detection)
For what to put in per-call logs, see what to log on every voice agent call. For trace design across hops, see OpenTelemetry for voice agents.
Failure modes and how to catch them
| Failure | Mechanism | Symptom | Detection | Fix |
|---|---|---|---|---|
| Event-loop blocking | Sync HTTP call, sync DB driver, big JSON parse, or sync log shipping on the loop | Choppy audio for every call in the process | Loop-lag p99 over 20 ms; asyncio debug mode logs callbacks over 100 ms | aiohttp or httpx async; `asyncio.to_thread` for CPU work |
| Leaked tasks | Tasks created in event handlers never awaited or cancelled | RSS climbs per call; eventual OOM kill drops all calls in the pod | `PipelineWorker`'s `check_dangling_tasks` (default on) logs leftovers; alert on that line | Cancel tasks in `on_client_disconnected`; `force_gc=True` |
| Unbounded recording | `AudioBufferProcessor` without `buffer_size` | Memory grows with call length | RSS vs call duration | Chunked flush |
| Drain kills calls | SIGTERM reaches uvicorn with WebSockets open | Calls end with code 1012 on every deploy | Count call ends with reason "drain" | preStop drain before SIGTERM |
| LB cuts long calls | Deregistration delay shorter than call length | Calls die at exactly 300 s into a drain | End-time histogram spikes at fixed offsets | Match delay to grace period |
| Counter drift | Worker dies without decrementing Redis | Router rejects calls while pods sit idle | `used` vs sum of heartbeats | Reconcile from heartbeats |
| Restart storm | Liveness probe checks a provider | Every pod restarts during a provider incident | Restarts correlated with provider status | Liveness checks the loop only |
| Stuck silent calls | Pipeline waits forever after a dropped provider stream | Calls bill for minutes of silence | Calls ending by idle timeout | Keep `idle_timeout_secs` (default 300 s) or lower it |
Dean and Barroso's "The Tail at Scale" explains why the rare stalls matter. If one server is slow on 1% of requests, a request that fans out to 100 servers is slow 63% of the time. A phone call is a fan-out over time. If 1% of turns stall for 2 seconds, a 20-turn call has a 1 − 0.99^20 ≈ 18% chance of at least one stall. At a 2% stall rate, it's 33%. That's why per-turn p99 matters more than per-turn median for call quality.
Zero-downtime releases: canary by new calls
Because each call is pinned to a release by its Stream URL, a canary is just a weight in the router's release table. Roll out in three moves:
1. Deploy release N+1 as a new Deployment at its warm floor.
2. Shift 5% of new calls to it. Live calls on release N are untouched.
3. Promote by raising the weight, or roll back by setting it to 0. Either takes effect on the next webhook. Then drain and delete the old Deployment.
Be honest about what a small canary can detect. Worked example: to detect a call failure rate rising from 2% to 4% at 80% power and 5% significance, you need about 1,140 calls per arm. Use n = (1.96 + 0.84)² × [p₁(1−p₁) + p₂(1−p₂)] / (p₁ − p₂)². At 2,727 calls per day, a 5% canary sees about 136 calls a day, so it takes over 8 days to reach that sample.
So canaries catch crashes, drain bugs, and big latency regressions fast. They don't catch a prompt change that quietly lowers booking completion by 3 points. That has to be caught before release, against a fixed test set. Evalgent runs that kind of pre-release regression audit on in-house agents, scoring a fixed scenario set on every release candidate so the canary only has to catch infrastructure problems. See our guides to regression testing LLM updates and shadow testing.
Pipecat Cloud vs self-hosted: the cost crossover
This is the "pipecat cloud vs self hosted" question in numbers. Pipecat Cloud prices below are from the pricing page as of October 2026. Everything else is a labeled assumption. Change them to your quotes.
Shared assumptions: 60,000 calls per month at 4 minutes, so 240,000 agent minutes. Twilio WebSocket transport (billed by Twilio in both cases). STT, LLM, and TTS are identical in both, so they're excluded.
| Line item | Pipecat Cloud | Self-hosted on Kubernetes |
|---|---|---|
| Agent compute | 240,000 active min × $0.01 (agent-1x) = $2,400 | Assume 2,340 node-hours of 4-vCPU nodes × $0.20/h = $468 |
| Warm capacity | Assume 10 reserved agents × 43,200 min × $0.0005 = $216 | Included in node-hours (floor of 2 nodes off-peak) |
| Control plane, LB, Redis | Included | Assume $73 + $25 + $50 = $148 |
| Logs, metrics, traces | Platform logs included | Assume $150 |
| Infrastructure subtotal | $2,616 ($0.0109/min) | $766 ($0.0032/min) |
| Engineering and on-call | Low | Assume 0.25 FTE at $15,000/month loaded = $3,750 |
| Total | ≈ $2,616 | ≈ $4,516 |
The node-hours assume 6 nodes for 10 hours a day on 22 business days, and 2 nodes otherwise. At this volume, the managed runtime is cheaper once you count people.
The crossover is simple to compute. Self-hosting saves about $0.0077 per minute in infrastructure. To cover an assumed $3,750 a month of engineering time, you need about 490,000 minutes a month, or roughly 120,000 four-minute calls. Below that, self-host for control, data residency, or a transport Pipecat Cloud doesn't offer, not for cost. Above it, self-hosting starts to pay, and the gap widens with volume.
One caveat: reserved minutes bill 24/7, so a high warm floor on spiky traffic shifts the math. For the managed options side by side, see Pipecat Cloud vs LiveKit Cloud, managed vs self-hosted orchestration, and LiveKit vs Pipecat scaling.
Production readiness checklist
- Dev runner not exposed; webhook signatures verified; router idempotent per CallSid
- Hard call cap per pod, enforced at the router
- `tini` as PID 1; no torch unless needed; one uvicorn process per container
- preStop drain before SIGTERM; grace period from p99.9 call length; max call duration enforced
- LB deregistration delay at least the grace period; WebSocket timeouts and headers set
- No CPU limit; memory limit set; recordings flushed in chunks
- Liveness checks the loop only; readiness reflects drain state
- Autoscaling on active calls with a warm floor and slow scale-down
- Tracing on, `conversation_id` = CallSid, loop-lag metric exported
- Canary by release weight; load, soak, release-under-load, and fault tests passed
How to load-test and soak a Pipecat deployment before launch
A Pipecat deployment isn't production-ready until it passes a load and soak run with explicit pass criteria. Here's the protocol.
1. Build a fake carrier. Write a load client that speaks the Twilio Media Streams protocol to your worker's `/ws`: `connected` and `start` events, then 20 ms base64 mu-law `media` frames from recorded caller audio, then `stop`. This sidesteps Twilio's 1 CPS outbound default. Keep a few real PSTN calls running alongside to catch carrier-path issues.
2. Use realistic caller audio. Record 20 to 50 scripted conversations on phones: clean, noisy (roughly 10 to 15 dB SNR), accented, and long-pause callers. Silent callers won't exercise Smart Turn or the LLM.
3. Ramp to 1.0x, then 1.5x your Erlang-sized cap. Hold each step for 15 minutes. Record turn latency (end of user speech to first bot audio), event-loop lag, CPU throttling, and router rejects.
4. Soak for 4 hours at 1.0x. Track RSS at each call's end. Fit a slope of memory against calls served. A healthy worker returns to baseline. A leaking one climbs steadily.
5. Release under load. Mid-soak, roll a new version with your real manifests. Count calls that end with reason "drain" or close code 1012.
6. Inject failures. Kill a node. Add 2 seconds of latency to the LLM with a fault proxy. Revoke one TTS key. Watch for restart storms, stuck calls, and whether the router sheds load cleanly.
7. Score quality, not just uptime. Rerun your scripted conversations during the 1.5x step. Compare task success, interruption handling, and turn latency against the idle baseline. This is where an independent evaluator such as Evalgent fits: it scores the same scripted calls at idle and at peak, so a team without an eval function can see whether load changed what callers experienced.
| Metric | Pass criterion (starting point; tune to your product) |
|---|---|
| Calls dropped during release | 0 |
| Event-loop lag p99 at 1.0x | Under 20 ms (one audio frame) |
| Turn latency p95 at 1.5x vs idle | Within +15% |
| RSS after soak vs start, idle pod | Within 10% |
| Router rejects at 1.0x | Within your Erlang B target (e.g., under 0.1%) |
| Restarts during provider fault | 0 liveness restarts |
| Task success at 1.5x vs idle | No drop beyond run-to-run noise (rerun 3 times) |
Run each step at least 3 times and report the spread. A single pass/fail run can't separate a regression from noise. For the conversation-level test design, see our Pipecat voice agent testing guide. For the full launch gate, see the production readiness bar.
Frequently asked questions
Can I run the Pipecat development runner in production?
No. Pipecat's docs say the development runner isn't built for production and isn't supported there. Its `POST /start` accepts requests from anyone, it has no rate limiting or backpressure, and it's a single process with no lifecycle management. Use it locally. In production, put a router with authentication and admission control in front of capped worker processes.
How many concurrent calls can one Pipecat container handle?
It depends on your pipeline, so measure it. Pipecat Cloud allots 0.5 vCPU and 1 GB per session on agent-1x. Average CPU per call is often far lower, but Smart Turn and VAD bursts land when callers stop talking. Start around 4 to 8 calls on 2 vCPU. Raise the cap only while event-loop lag p99 stays under 20 ms.
Why do my calls drop when I deploy Pipecat to Kubernetes?
Usually it's one of two reasons. The 30-second default grace period kills calls outright. Or SIGTERM reaches uvicorn, which closes every open WebSocket with code 1012 right away. Fix it with a preStop hook that stops new calls and waits for active ones to finish before SIGTERM. Size the grace period from your call-length distribution.
Should I autoscale Pipecat on CPU?
Not as the main signal. CPU varies with how much callers are speaking, not with how full a pod is. Scale on active calls per pod using KEDA with a Prometheus query. Target about two-thirds of the per-pod cap, and keep a warm floor of replicas. Scale up immediately and scale down slowly, because draining pods hold calls for minutes.
Do I need PyTorch in my Pipecat Docker image?
Usually not. As of Pipecat 1.12.0, the Silero VAD and Smart Turn v3.2 ONNX models ship inside the pipecat-ai package and load with ONNX Runtime. The torch.hub step in older examples pulls PyTorch, which inflates the image and slows scale-up. You need torch only for extras that depend on it, such as the CoreML or Torch Smart Turn variants.
Is Pipecat Cloud cheaper than self-hosting?
At mid-size volume, usually yes, once you count engineering time. With agent-1x at $0.01 per active minute, a worked example of 240,000 minutes costs about $2,600 a month on Pipecat Cloud. Self-hosted infrastructure costs about $770 under labeled assumptions. Self-hosting pays off around 490,000 minutes a month if a quarter of an engineer's time costs $3,750.
Does Pipecat support OpenTelemetry tracing?
Yes. Install the tracing extra, call `setup_tracing()` with an OTLP exporter, and set `enable_tracing=True` and `enable_turn_tracking=True` on `PipelineWorker`. You get a conversation span, per-turn spans, and STT, LLM, and TTS child spans with time-to-first-byte. Turn spans also record whether the turn was interrupted. Set `conversation_id` to the carrier's call ID so traces join your carrier logs.
How do I canary a new Pipecat release without affecting live calls?
Route by Stream URL. The router writes a release-specific hostname into each call's TwiML, chosen by a weighted hash of the CallSid. Shift 5% of new calls to the new release. Live calls stay on the old one because their WebSocket is pinned. To roll back, set the weight to zero.
The bottom line
Self-hosting Pipecat for phone calls comes down to treating each call as a long-lived, unmovable session: cap it per pod, admit it at the router, pin its version in the Stream URL, and drain before SIGTERM. Once the fleet survives a release under 1.5x load with zero dropped calls, the remaining risk is call quality, which needs its own measurement.
Related Articles
How to automate voice agent testing: synthetic callers vs manual QA
Learn how ai test automation replaces manual QA for voice agents. Compare synthetic callers vs human testers, with a 5-step framework to scale without hiring.
Read more
AI Agent Testing vs Voice Agent Testing: What General Tools Miss for Voice
AI agent testing measures text outputs. Voice agent testing measures behaviour through an acoustic pipeline. Five failure categories general tools miss.
Read more