Open door for builders.
Running LiveKit Agents on Kubernetes: Scaling, Draining Calls and Safe Releases
On this page
A LiveKit agent on Kubernetes looks simple in LiveKit's own docs, and mostly it is. An agent server opens an outbound WebSocket to LiveKit, takes jobs, and runs each call in its own process. You don't need an Ingress, a load balancer, or sticky sessions. Kubernetes runs it like any other container.
The trouble is in four defaults that interact badly on Kubernetes. The CPU load signal reads the wrong denominator when a pod has no CPU limit. The idle process pool scales with the node's cores, not the pod's. Kubernetes kills a pod 30 seconds after SIGTERM, while the agent server is prepared to wait an hour. And when you lose a call during a deploy, nothing in the default metrics tells you it happened.
This post walks through each of these with the source code open. It covers how dispatch works, how an agent server decides it is full, sizing math, drain math, autoscaling, release strategies, manifests, and a load and soak protocol with pass criteria. It is the LiveKit companion to our Pipecat deployment blueprint. Where the Kubernetes mechanics are identical, this post links there instead of repeating them.
How LiveKit dispatches calls to agent servers
Start with the moving parts, because they decide what Kubernetes has to do.
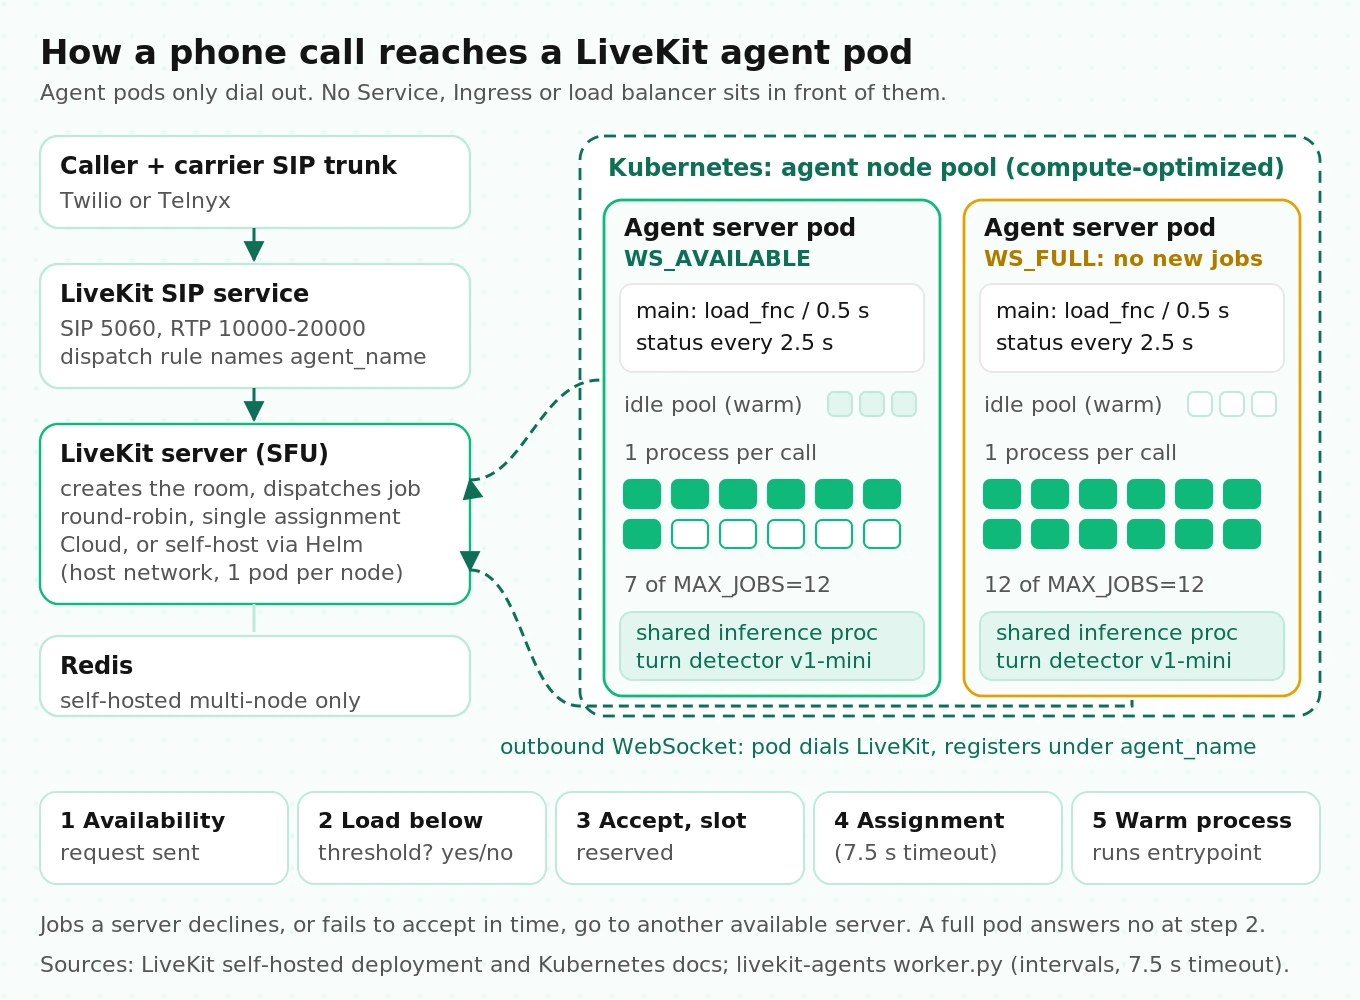
A LiveKit deployment for phone calls has three fleets. The LiveKit server (the SFU) routes media and dispatches jobs. You run it on LiveKit Cloud or self-host it. The SIP service bridges your Twilio or Telnyx trunk into LiveKit rooms. The agent servers run your Python code. Earlier releases called them "workers."
Dispatch works like this. When a call creates a room, LiveKit server picks an agent server registered under the right `agent_name` and sends it an availability request. The agent server refreshes its load, checks it against `load_threshold`, and answers yes or no. If yes, it waits for an assignment message (the timeout in `worker.py` is 7.5 seconds), takes a process from its warm pool, and calls your entrypoint. LiveKit's self-hosting guide describes the server side as "round-robin distribution with a single-assignment principle." If a server doesn't accept in time, the job goes to another one.
The agent server pushes status to LiveKit every 2.5 seconds and recomputes load every 0.5 seconds (`UPDATE_STATUS_INTERVAL` and `UPDATE_LOAD_INTERVAL` in worker.py). When load crosses the threshold, it reports `WS_FULL` and LiveKit stops sending it jobs.
What this means for Kubernetes
Three consequences follow, and they make LiveKit simpler to run than a WebSocket-terminating Pipecat bot.
- No Service, no Ingress, no load balancer for agents. Agent pods only make outbound connections. Nothing routes inbound traffic to them, so there's no deregistration delay or idle timeout to tune.
- Readiness doesn't gate traffic. A pod gets jobs once it registers with LiveKit, whatever its readiness probe says. Readiness only affects how fast a rolling update moves.
- Capacity is a registration, not a replica count. LiveKit sees capacity as "servers currently reporting `WS_AVAILABLE`." A running pod that reports full adds nothing.
Round-robin with a binary available/full gate is a simple policy. Mitzenmacher's power of two choices result shows that picking the less loaded of two random servers balances far better than picking blindly. LiveKit's gate means a pod never exceeds its threshold. It doesn't mean pods below the threshold are evenly loaded. Your per-pod cap does the real balancing work.
Self-hosting the LiveKit server next to your agents
If you self-host the server too, three constraints from LiveKit's Kubernetes guide shape the cluster:
- LiveKit server pods use host networking, so you get one LiveKit pod per node. It doesn't support private clusters, because the extra NAT layers break WebRTC.
- A multi-node cluster needs Redis, plus TLS certificates for the main domain and TURN/TLS. The official `livekit/livekit-server` Helm chart sets `terminationGracePeriodSeconds` to 5 hours so rooms can drain.
- The SIP service needs port 5060 and the RTP range 10000–20000 reachable from the internet, and it also talks to Redis.
Put the LiveKit server and SIP pods on their own node pool. Agent pods want CPU-dense nodes. Media pods want stable public IPs and open UDP ranges. Mixing them makes both harder to scale. For the trade-off between this and LiveKit Cloud, see Pipecat Cloud vs LiveKit Cloud.
How an agent server decides it is full
This is where most self-hosted fleets go wrong, and the docs don't cover it.
The server options docs say the default `load_fnc` is "average CPU utilization over a 5-second window" and the default `load_threshold` is 0.7. In the current source, `_DefaultLoadCalc` keeps a moving average of 5 samples, each measured over 0.5 seconds. The code comment says "avg over 2.5." That's a short window, so a burst of simultaneous turns can flip a server to full and back.
The bigger issue is the denominator. CPU load is `cpu_used / (interval × cpu_count)`, and `cpu_count` comes from cpu.py:
| Pod setup | What `cpu_count()` returns | Effect |
|---|---|---|
| `NUM_CPUS` env var set | That value | Correct if it matches your CPU request |
| cgroup v2, CPU limit set | quota ÷ period (limit of 4 → 4.0) | Correct, but the CFS limit can throttle audio |
| cgroup v2, no CPU limit | `psutil.cpu_count()`: the node's cores | Load reads far too low; the server over-accepts |
| cgroup v1, no quota | Hard-coded 2.0 | Load reads too high on big pods; capacity wasted |
The third row is the common one. The usual advice is to leave CPU limits off for latency-sensitive pods, because CFS throttling stalls audio frames (we explain why in the Pipecat post). Do that on a 32-vCPU node and a pod requesting 4 cores divides its usage by 32. At the default 0.7 threshold, it keeps accepting calls until it uses 22.4 cores, more than five times its request. The scheduler packed other pods next to it on the strength of that 4-core request. Latency degrades for everyone on the node, and nothing reports "full."
The idle-pool multiplier
The same `cpu_count()` sets the default warm pool. In production mode, `AgentServer` defaults `num_idle_processes` to `ceil(cpu_count)`. With no CPU limit on a 32-vCPU node, that's 32 pre-started Python processes per pod, each importing your plugins. On Linux the server uses the `forkserver` context and preloads plugin packages, so some pages are shared copy-on-write. Every process still has its own interpreter heap. Measure one idle process's RSS on your image before you trust that memory limit.
The fix for both problems is one line in the Deployment:
env:
  - name: NUM_CPUS
    valueFrom:
      resourceFieldRef: { resource: requests.cpu, divisor: "1" }
`resourceFieldRef` rounds a fractional request up to a whole number with divisor 1, so request whole cores for agent pods.
Cap jobs explicitly instead of trusting CPU
CPU is a lagging, bursty signal for voice. A pod at 40% CPU can still miss audio deadlines when six callers stop talking in the same second and six turn checks run at once. LiveKit's docs show a count-based `load_fnc`. Here it is adapted for Kubernetes, with an exact cap and a gauge your autoscaler can read:
# agent.py (simplified; verify names against your livekit-agents version)
import os
from prometheus_client import Gauge
from livekit.agents import AgentServer, JobContext, JobProcess, cli

MAX_JOBS = int(os.environ.get("MAX_JOBS", "12"))
ACTIVE = Gauge("voice_agent_active_jobs", "Jobs running on this agent server")

server = AgentServer(
    load_threshold=0.99,          # full when active/MAX_JOBS >= 0.99, so cap == MAX_JOBS
    drain_timeout=int(os.environ.get("DRAIN_TIMEOUT", "2700")),
    num_idle_processes=3,         # explicit; don't inherit node core count
    job_memory_warn_mb=600,
    job_memory_limit_mb=900,      # framework kills one job, not the whole pod
    initialize_process_timeout=30.0,
    prometheus_port=9100,
)

def compute_load(s: AgentServer) -> float:
    n = len(s.active_jobs)
    ACTIVE.set(n)                 # runs in the main process every 0.5 s
    return min(n / MAX_JOBS, 1.0)

server.load_fnc = compute_load

def prewarm(proc: JobProcess) -> None:
    ...  # load anything slow here; AgentSession already bundles Silero VAD

server.setup_fnc = prewarm

@server.rtc_session(agent_name=os.environ["AGENT_NAME"])
async def entrypoint(ctx: JobContext) -> None:
    ...

if __name__ == "__main__":
    cli.run_app(server)
Two details matter. First, the server checks `load < load_threshold` before it accepts. With a threshold of 0.99 and load `n / MAX_JOBS`, it accepts the 12th job at 11/12 and refuses the 13th, so the cap is exact for any cap under 100. Second, the server counts "reserved slots" for jobs it has said yes to but not yet launched. Two requests arriving in the same instant can't both squeeze into the last slot.
`load_fnc` and `load_threshold` are ignored on LiveKit Cloud. The source logs a warning and reverts to defaults. Everything in this section applies to self-hosted agent servers only.
Sizing: CPU and memory per concurrent call
LiveKit publishes one load test. A single 4-core, 8 GB machine ran 30 agents, each subscribed to a simulated caller and running Silero VAD, and peaked at about 3.8 cores and 2.8 GB. That's roughly 0.13 cores and 93 MB per job. LiveKit's guidance is 4 cores and 8 GB per agent server for "10–25 concurrent jobs, depending on the components in use."
For how this footprint compares with Pipecat's process-per-call model, see LiveKit vs Pipecat scaling. Treat the 30-job test as a floor. Its agents published a looping sine wave, not TTS. Its notes don't mention STT, LLM, or TTS network clients, or a turn detector. Real calls add all of that. Note also that the test used 95% of the machine's CPU. At the default 0.7 threshold, that same machine would stop accepting at about 2.8 cores, or around 22 jobs of that profile.
The turn detector is the piece most self-hosters underestimate. Per the turn detector docs, agents deployed with the `start` command outside LiveKit Cloud default to `v1-mini`, which "executes in a shared CPU process." One inference process serves every job on the pod. LiveKit recommends compute-optimized instances (AWS c6i or c7i) over burstable ones (t3, t4g) "to avoid inference timeouts from CPU credit limits." For a sense of scale, the deprecated text turn detector is 396 MB on disk, needs under 500 MB of RAM, and takes about 50–160 ms per turn on CPU. LiveKit doesn't publish equivalent figures for `v1-mini`, so measure it.
Worked sizing for one pod (all per-job figures are assumptions to replace with your measurements):
| Item | Assumption | Memory | CPU |
|---|---|---|---|
| Main server process | Measured once | 300 MB | Small |
| Shared inference process (`v1-mini`) | Measure | 600 MB | Bursts per turn |
| Idle pool | 3 processes × 200 MB | 600 MB | Near zero |
| Active jobs | 12 × 250 MB RSS | 3,000 MB | 12 × 0.15 cores average |
| Total at cap | 4.5 GB | 1.8 cores average + bursts |
That fits a 4-vCPU, 8 GiB pod with room for bursts and a memory limit well above steady state. The `job_memory_limit_mb` setting (default 0, meaning off) is the important one. Without it, a leaking call grows until the container hits its cgroup limit. The kernel OOM killer then picks a victim inside the pod, and if that's the main server process, every call on the pod drops at once. With the limit set, the framework kills the one job that crossed it.
Revisit these numbers monthly. Google's Autopilot paper (EuroSys 2020) found manually sized jobs carried 46% slack, the gap between limit and actual use, against 23% for jobs sized automatically from usage history. Autopilot also cut the number of jobs severely hit by OOMs by a factor of 10. Teams guess high and stay high. Size from `job_memory_warn_mb` logs and per-process RSS, not from the first load test.
Capacity math: Little's law, Erlang B, and the rollout footprint
The Pipecat post derives this method step by step. Here it is applied to a LiveKit fleet, with one LiveKit-specific twist.
Worked example (assumptions): a support line peaks at 540 calls per hour, with a 5-minute average handle time.
- Little's law (Little, 1961): L = λW = 9 calls/min × 5 min = 45 concurrent calls on average in the peak hour (45 erlangs).
- Erlang B gives the chance a caller arrives when every slot is busy:
| Fleet slots | Probability a caller finds no free agent |
|---|---|
| 50 | 5.4% |
| 55 | 2.0% |
| 60 | 0.54% |
| 66 | 0.10% |
| 70 | 0.013% |
To keep blocking under 0.1%, you need 66 slots. At `MAX_JOBS=12`, that's 6 pods (72 slots) as the peak-hour floor.
Here's the twist. When every agent server reports `WS_FULL`, LiveKit has no one to dispatch to. The SIP caller is already in a room, and nothing answers. LiveKit's docs don't say how long the server keeps retrying dispatch in that state, so measure what a caller hears at saturation during your load test. Then decide whether a "please hold" fallback belongs in your SIP flow.
Rollout footprint. During a rolling update, a terminating pod no longer counts toward the Deployment's replicas. The rollout can finish in a few minutes while old pods keep serving calls for up to `drain_timeout`. For that window, the cluster holds roughly twice the agent footprint: the new pods at full size plus the draining old ones. If your node pool can't hold both, new pods sit in Pending, and with `maxUnavailable: 0` the rollout stalls. Budget node headroom for 2× at peak, or release outside the peak.
Draining calls on deploy: grace period, drain_timeout and call length
When Kubernetes deletes a pod, it sends SIGTERM to PID 1, waits `terminationGracePeriodSeconds` (default 30, per the pod lifecycle docs), then sends SIGKILL. Here's what the agent server does in that window, from cli.py:
1. The first SIGTERM or SIGINT stops the main loop and calls `server.drain()`. The server reports `WS_FULL`, waits for in-flight accepts to launch, then waits for every running job to end.
2. Job processes ignore SIGTERM and SIGINT themselves (`job_proc_lazy_main.py` sets `SIG_IGN`). Only the parent decides when they stop.
3. If the drain exceeds `drain_timeout`, the server logs "drain timed out, forcing shutdown" and closes the process pool. Remaining calls drop.
4. A second SIGTERM during the drain calls `os._exit(1)`. Every call drops immediately.
5. In `dev` mode, the server skips the drain entirely. LiveKit's load-testing guide warns that dev mode "doesn't handle SIGTERM signals correctly." Always run `start` in containers.
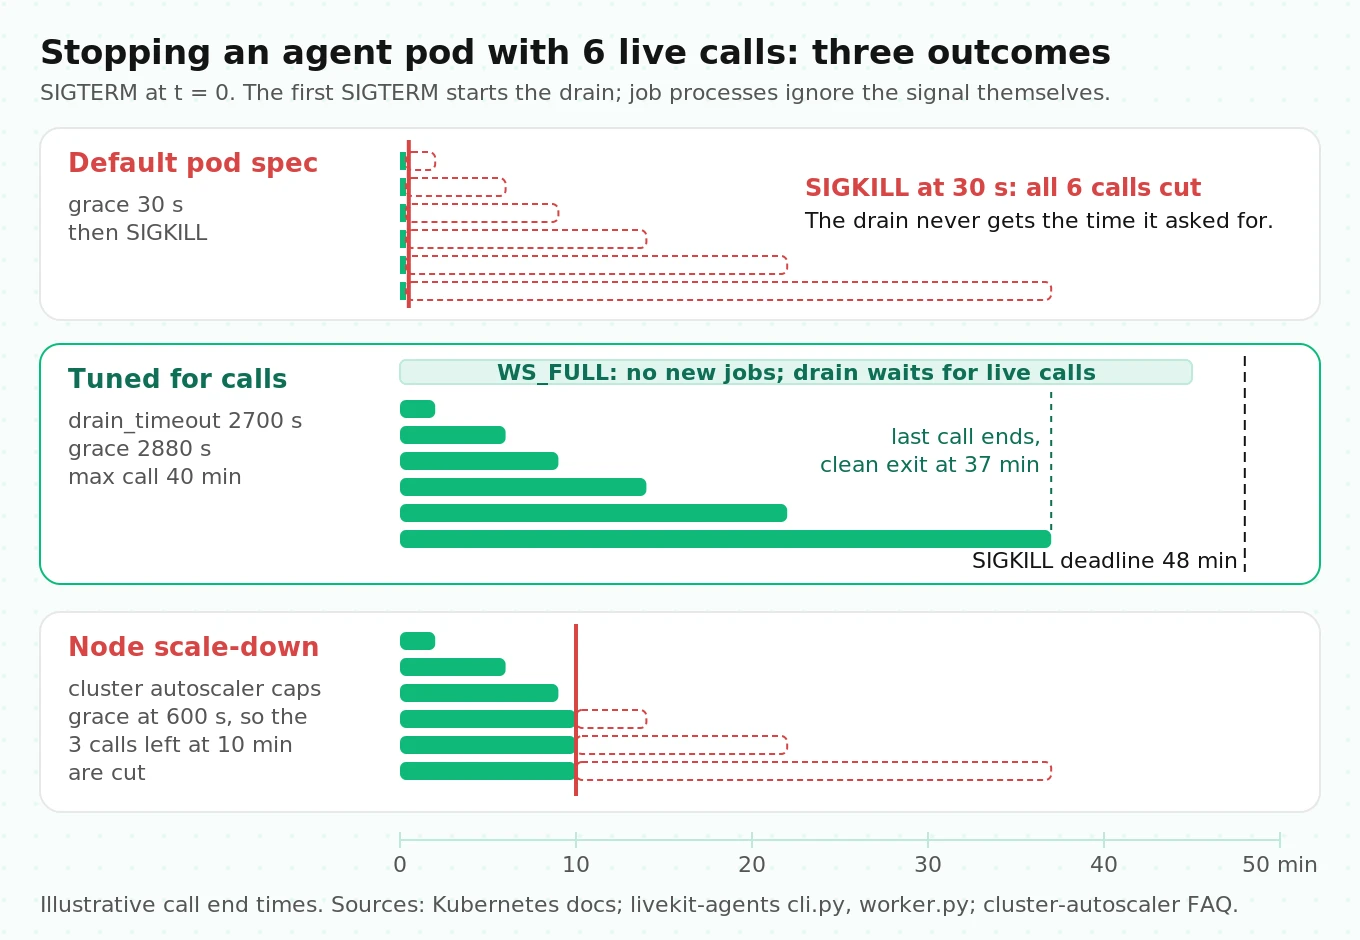
So the rule is: `terminationGracePeriodSeconds` > `drain_timeout` + about 2 minutes. The extra time covers job shutdown. The source allows 15 seconds for the entrypoint to exit, up to 60 seconds for `AgentSession.aclose()`, and your `on_session_end` callback (default timeout 300 seconds). If your post-call hook uploads recordings or writes CRM notes, count that time too.
Three things silently break this chain:
- Shell-form CMD. `CMD python agent.py start` runs under `/bin/sh -c`, which doesn't forward SIGTERM. The agent never drains, and SIGKILL arrives at the grace deadline. Use exec form. The starter's `CMD ["uv", "run", "src/agent.py", "start"]` is fine, because uv forwards most signals, including SIGTERM, to its child.
- Double signals. Tooling that sends SIGTERM twice (a wrapper script plus the kubelet, or a process manager with its own stop logic) triggers the force-exit path.
- Cluster autoscaler scale-down. The cluster autoscaler FAQ caps pod termination at `--max-graceful-termination-sec`, which defaults to 600 seconds, when it empties a node. A 45-minute grace period on your pod doesn't survive a node scale-down unless you raise that flag or mark busy pods with `cluster-autoscaler.kubernetes.io/safe-to-evict: "false"`.
How long should drain_timeout be? Use residual call time, not call length
LiveKit's guidance says voice apps "might require a 10+ minute grace period." The right number depends on a subtle effect.
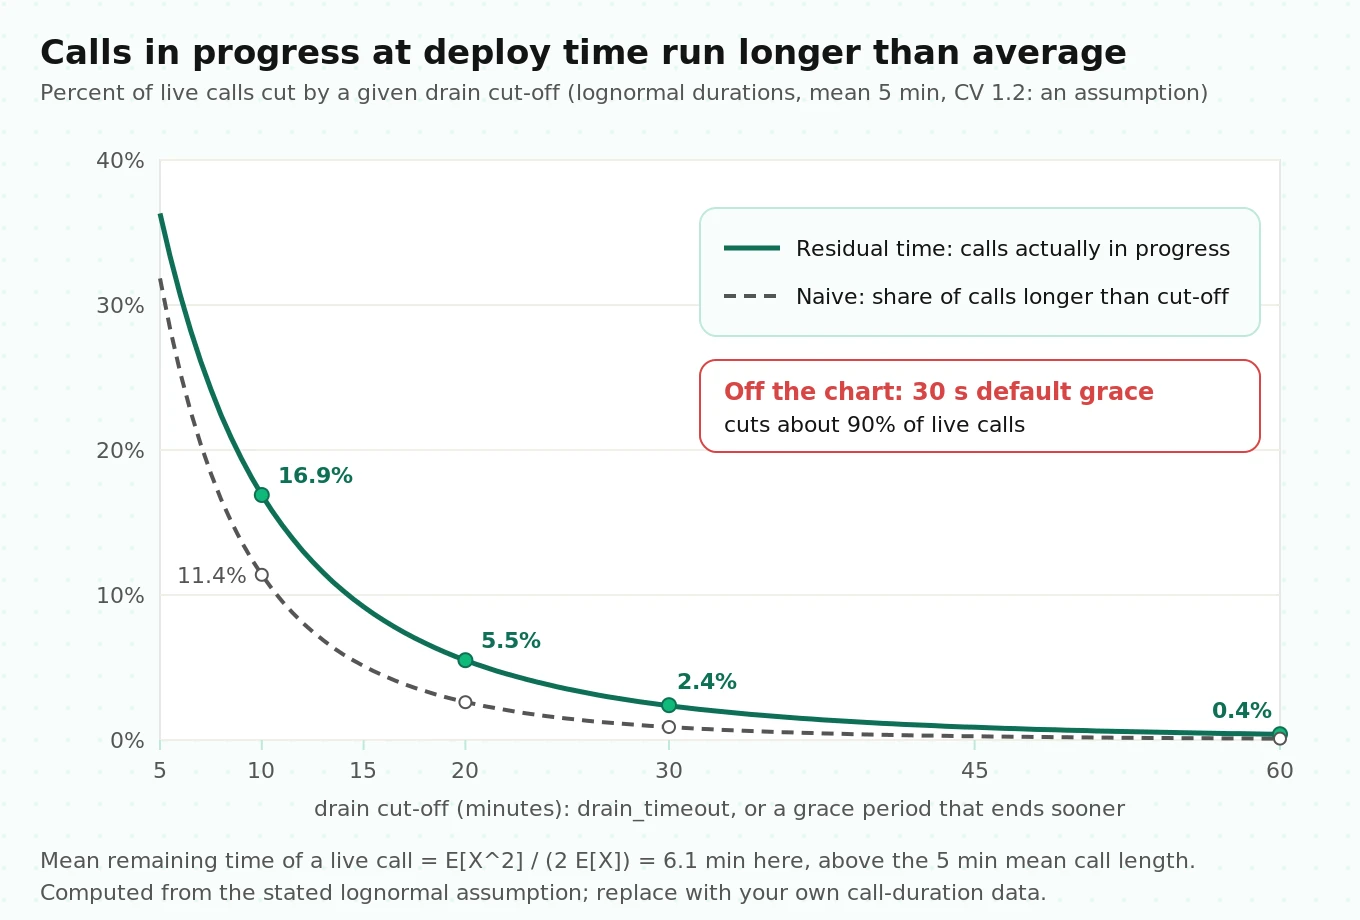
When a deploy starts, the calls in progress are not a random sample of calls. Long calls are more likely to be running at any given moment, so they're over-represented. Queueing theory calls this the inspection paradox. The remaining time of an in-progress call follows the residual time distribution, whose mean is E[X²] / (2·E[X]), not E[X].
Worked example (assumption: lognormal call durations, mean 5 minutes, coefficient of variation 1.2). The mean remaining time of an in-progress call is 5 × (1 + 1.2²) / 2 = 6.1 minutes, longer than the average call. Here's the share of in-progress calls that a given drain cut-off would end early, against the naive answer you'd get from reading the call-length histogram:
| Drain cut-off | Naive: calls longer than cut-off | Correct: in-progress calls with more remaining |
|---|---|---|
| 30 s (Kubernetes default) | 97.5% | 90% |
| 10 min | 11.4% | 16.9% |
| 20 min | 2.6% | 5.5% |
| 30 min | 0.9% | 2.4% |
| 45 min | 0.26% | 0.9% |
| 60 min | 0.10% | 0.4% |
At 45 active calls, a 10-minute drain cuts about 7.6 calls per deploy. A 30-minute drain cuts about 1.1. Ship twice a day at that load and the 10-minute setting cuts roughly 15 live calls a day, each ending mid-sentence. Reading the histogram would tell you 11%, not 17%. Past a few minutes, the naive number understates the damage, by about half at 10 minutes and by more than double at 30.
The cleanest fix is to bound the tail yourself. Enforce a maximum call length in the agent, then set `drain_timeout` just above it. No call can outlive the drain:
# inside entrypoint, after session.start(...) (simplified)
import asyncio

MAX_CALL_S = int(os.environ.get("MAX_CALL_S", "2400"))  # 40 min

async def _cap_call() -> None:
    await asyncio.sleep(MAX_CALL_S)
    await session.say("I need to end this call now. Please call back if you need anything else.")
    ctx.shutdown(reason="max_call_duration")

asyncio.create_task(_cap_call())
With a 40-minute cap, `drain_timeout=2700` (45 minutes) and `terminationGracePeriodSeconds: 2880` give about 3 minutes of shutdown margin. Log the `max_call_duration` reason so you can see how often the cap fires.
Don't let probes kill busy pods
The health endpoint on port 8081 returns 503 when the server can't reach LiveKit or the shared inference process has died. A liveness probe on it looks sensible. But a liveness failure restarts the container, and "if the agent server crashes, all child jobs are terminated," per LiveKit's docs. A LiveKit server upgrade or a Redis failover can briefly fail that check on every pod at once.
The source already handles the terminal case. When the connection task fails for good after `max_retry` attempts (default 16), it raises out of `run()` and the process exits on its own. So skip the liveness probe, or make it very lenient. Use a readiness probe plus `minReadySeconds` to pace rollouts, and set a generous startup window for first boot.
Autoscaling on active jobs instead of CPU
LiveKit's docs tell you to scale on the same signal your `load_fnc` uses, but at a lower threshold. If servers go full at 0.7, scale up at 0.5. They also say to shorten scale-up stabilization and lengthen scale-down stabilization, because "spikes are less spikey" for long-running calls.
With the count-based `load_fnc` above, the scaling signal is active jobs per pod. Set the target at about two-thirds of the cap: 8 of 12. The free third absorbs arrivals while new pods schedule, pull the image, and warm their pool. In the 45-erlang example, that's 45 ÷ 8 ≈ 6 pods at the average. That matches the Erlang B floor, a useful sanity check.
Which metric to scrape
The framework exposes Prometheus metrics on `prometheus_port`: `lk_agents_active_job_count`, `lk_agents_worker_load`, `lk_agents_child_process_count`, and the `lk_agents_proc_initialize_duration_seconds` histogram. Two caveats before you wire an HPA to them:
- `lk_agents_active_job_count` is declared with Prometheus multiprocess mode `livesum`. That aggregates across processes only when `PROMETHEUS_MULTIPROC_DIR` is set.
- If you set `PROMETHEUS_MULTIPROC_DIR`, an open bug (agents#7596, filed October 3, 2026) shows the server deleting its own metric files at startup. `lk_agents_worker_load` and any app gauges created before `run()` then silently vanish from `/metrics`, which still returns 200. The reporter's autoscaler lost its input.
The `voice_agent_active_jobs` gauge in the code above avoids both. It's set from `load_fnc`, which runs in the main server process every 0.5 seconds, so it needs no multiprocess mode. Check that your version's metrics endpoint serves the default registry. If it doesn't, call `prometheus_client.start_http_server()` on a separate port. Whatever you choose, add an alert for "series absent for 5 minutes." A missing scaling metric must page someone, not quietly freeze the HPA.
A KEDA trigger on that gauge looks like this. The full ScaledObject pattern, including warm floors and scale-down behavior, is in the Pipecat post.
triggers:
  - type: prometheus
    metadata:
      serverAddress: http://prometheus.monitoring:9090
      query: sum(voice_agent_active_jobs{agent_name="support-v13"})
      threshold: "8"          # target 8 of MAX_JOBS=12 per pod
The HPA docs set a default scale-down stabilization window of 300 seconds. For calls, use 900 seconds or more. When the HPA does remove a pod, the pod drains, so scale-down is safe but slow. That's the right trade.
Releasing new agent versions: rolling, blue/green, or canary by agent_name
Explicit dispatch is your release lever. A job only reaches servers registered under the `agent_name` named in the dispatch: an API call, a token's `RoomConfiguration.agents`, or a SIP dispatch rule's `room_config.agents`, per the dispatch docs. Changing the name in one place moves all new calls.
| Strategy | How | Mix during release | Rollback | Best for |
|---|---|---|---|---|
| Rolling, same `agent_name` | Update the Deployment image | Old and new versions get jobs round-robin until old pods drain | Another rolling update (minutes, plus drain) | Low-risk code changes |
| Blue/green by `agent_name` | Run `support-blue` and `support-green` Deployments; flip the dispatch rule | None: every new call goes to the new color at once | Flip the rule back; blue pods are still warm | Prompt, model, or tool changes |
| Canary pod, same name | Add 1 canary pod among N | About 1/(N+1) of new jobs, only while it reports available | Delete the pod | Smoke-testing infrastructure changes |
| Canary by name | Your dispatch code sends a percentage to `support-canary` | Exactly the share you choose, per call | Set the share to 0 | Behavior changes you need to measure |
For inbound SIP, a dispatch rule names its agents statically. To split traffic by percentage, either point a separate test number at the canary rule or dispatch from your own code with `create_dispatch`:
# Simplified: choose the agent per call, then dispatch explicitly
import random
from livekit import api

async def dispatch_call(room_name: str, metadata: str) -> None:
    agent = "support-canary" if random.random() < 0.10 else "support-v13"
    async with api.LiveKitAPI() as lkapi:
        await lkapi.agent_dispatch.create_dispatch(
            api.CreateAgentDispatchRequest(agent_name=agent, room=room_name, metadata=metadata)
        )
One source-level gotcha if you gate jobs in a custom `on_request` handler. The docs say a rejected job goes to the next server. But `JobRequest.reject()` defaults to `terminate=True`, and its docstring reads "the job will not be assigned to another worker." Pass `terminate=False` when you mean "not me, try someone else."
How many canary calls do you need? Infrastructure signals (crashes, join latency, dropped jobs) show up in dozens of calls. Behavior changes don't. To detect a task-success drop from 90% to 85% with 80% power at α = 0.05, you need about 686 calls per arm. At a 10% canary share on 600 calls a day, that's 11 days. For a 3-point drop (90% to 87%), it's about 1,774 calls per arm. Canaries catch breakage. They're too slow to catch quality drift on a mid-size line. Score behavior offline before the canary, on a fixed scenario set. Our guides to shipping prompt changes safely and A/B testing voice agents cover that side.
Node pools, cold starts and prewarm
A new agent pod has to get through a chain before it takes its first call: node provisioning (if the cluster scales up), image pull, interpreter start, plugin import, inference process start, warm pool fill, and registration. Each link has its own failure mode.
- Bake models into the image. If the turn detector or VAD weights download at startup, every new pod depends on Hugging Face being fast and not rate-limiting you during the very spike that triggered the scale-up. The starter Dockerfile runs `uv run --module livekit.agents download-files` at build time and sets `HF_HOME` inside the image. (Calling `download-files` through your agent script is deprecated as of 1.5.10.)
- Respect `initialize_process_timeout`. It defaults to 10 seconds. A `prewarm` that loads a big model, or connects to a slow database, fails that deadline on a cold, busy node. Raise it deliberately, and watch `lk_agents_proc_initialize_duration_seconds`.
- Keep a warm floor. Set `minReplicas` to the Erlang floor for your peak hour, not to 1. Node provisioning takes minutes, and LiveKit Cloud's own docs say a free-tier cold start "adds 10 to 20 seconds before the agent joins the room."
- Choose compute-optimized nodes. Taint the agent pool, avoid burstable families, and keep media pods elsewhere.
Observability: the signals that catch fleet problems
LiveKit's observability tooling works for self-hosted agents if you use LiveKit Cloud for transport. If you self-host everything, scrape these yourself. For the per-call fields that sit underneath, see what to log on every voice agent call. For latency debugging, see debugging LiveKit agent latency.
| Signal | Source | Alert when |
|---|---|---|
| Active jobs per pod | `voice_agent_active_jobs` | Fleet average above 80% of cap for 5 min |
| Pods reporting full | Log line "worker is at full capacity, marking as unavailable" | More than half the fleet full |
| Dispatch latency | `job_entrypoint` span events: `job_received`, `job_accepted`, `job_assigned`, `process_assigned`, `entrypoint_started` | p95 received-to-entrypoint above 1 s |
| Assignment timeouts | Log "assignment for job ... timed out" | Any sustained rate |
| Process init time | `lk_agents_proc_initialize_duration_seconds` | p95 above half of `initialize_process_timeout` |
| Job memory | `job_memory_warn_mb` log warnings | Any job over warn in a 1-hour window |
| Drain outcome | Log "drain timed out, forcing shutdown" | Any occurrence |
| Scaling metric present | Prometheus `absent()` | Missing for 5 min |
The dispatch timeline is new and useful. The job's root span records when the availability request arrived, when it was accepted, when LiveKit assigned it, when a process picked it up, and when your entrypoint started. When callers report "dead air at the start," this splits the blame between LiveKit, a starved pod, and slow code in your entrypoint.
Failure modes and how to spot them
| Failure | Mechanism | Symptom | Fix |
|---|---|---|---|
| Calls drop on every deploy | 30 s default grace, shell-form CMD, or `dev` mode | Calls end mid-sentence at release time | Exec-form `start`; grace > `drain_timeout` + 2 min |
| Calls drop on node scale-down | Cluster autoscaler's 600 s termination cap | Drops cluster around off-peak scale-downs | Raise the CA flag or use `safe-to-evict` |
| Fleet never reports full | No CPU limit, so `cpu_count()` is node cores | Latency climbs, zero "full" log lines | `NUM_CPUS` or a count-based `load_fnc` |
| Pod OOMKilled with many calls | Idle pool sized to node cores; no per-job limit | All calls on one pod drop together | Explicit `num_idle_processes`; `job_memory_limit_mb` |
| Slow or failed scale-up | Model download at boot; 10 s init timeout | New pods crash-loop during spikes | Bake models; raise the init timeout |
| HPA frozen | Metric vanished (agents#7596) | Replicas flat while load rises | Main-process gauge; `absent()` alert |
| Turn timeouts under load | `v1-mini` on burstable CPU | Turns commit without a prediction; agent talks over callers | Compute-optimized nodes; count-based cap |
| Provider throttling | STT or TTS concurrency limits | Silence on some calls only above N concurrent | Load-test at peak with real providers; see concurrency failures |
Kubernetes manifests
A simplified Deployment for one agent version. Each version gets its own Deployment and `agent_name`, so blue/green and canaries are a dispatch change, not a cluster change.
# Simplified. One Deployment per agent_name (support-v13, support-canary, ...).
apiVersion: apps/v1
kind: Deployment
metadata:
  name: support-v13
  labels: { app: voice-agent, agent_name: support-v13 }
spec:
  replicas: 6
  minReadySeconds: 30
  strategy:
    rollingUpdate: { maxSurge: "50%", maxUnavailable: 0 }
  selector: { matchLabels: { app: voice-agent, agent_name: support-v13 } }
  template:
    metadata:
      labels: { app: voice-agent, agent_name: support-v13 }
    spec:
      terminationGracePeriodSeconds: 2880     # drain_timeout 2700 + shutdown margin
      nodeSelector: { pool: voice-agents }
      tolerations:
        - { key: voice-agents, operator: Exists, effect: NoSchedule }
      containers:
        - name: agent
          image: registry.example.com/support-agent:1.13.0-a1b2c3d
          args: []                              # image CMD is exec-form "... start"
          env:
            - { name: AGENT_NAME, value: support-v13 }
            - { name: MAX_JOBS, value: "12" }
            - { name: DRAIN_TIMEOUT, value: "2700" }
            - { name: MAX_CALL_S, value: "2400" }
            - name: NUM_CPUS
              valueFrom: { resourceFieldRef: { resource: requests.cpu, divisor: "1" } }
          envFrom:
            - secretRef: { name: livekit-and-provider-keys }
          ports:
            - { name: health, containerPort: 8081 }
            - { name: metrics, containerPort: 9100 }
          resources:
            requests: { cpu: "4", memory: "8Gi" }
            limits:   { memory: "8Gi" }         # no CPU limit; NUM_CPUS fixes the load math
          startupProbe:
            httpGet: { path: /, port: health }
            periodSeconds: 5
            failureThreshold: 60                # up to 5 min for first boot
          readinessProbe:
            httpGet: { path: /, port: health }
            periodSeconds: 10
          # no livenessProbe: a failed connection already exits the process
---
apiVersion: policy/v1
kind: PodDisruptionBudget
metadata: { name: support-v13 }
spec:
  maxUnavailable: 1
  selector: { matchLabels: { app: voice-agent, agent_name: support-v13 } }
No Service object is needed for traffic. Scrape port 9100 with a PodMonitor.
Production readiness checklist
- [ ] Container runs `start`, in exec form, with no shell wrapper
- [ ] `terminationGracePeriodSeconds` exceeds `drain_timeout` by at least 2 minutes
- [ ] Maximum call length enforced in code, and `drain_timeout` set above it
- [ ] `NUM_CPUS` set from the CPU request, or a count-based `load_fnc` in place
- [ ] `num_idle_processes` set explicitly
- [ ] `job_memory_limit_mb` set below the container memory limit, with headroom for the main and inference processes
- [ ] Models baked into the image; first boot works with no outbound internet to model hosts
- [ ] Scaling metric comes from the main process, with an `absent()` alert
- [ ] HPA or KEDA scale-down stabilization of 900 s or more; warm floor at the Erlang peak
- [ ] Cluster autoscaler termination cap reviewed against drain time
- [ ] Separate `agent_name` per release; rollback is a dispatch change you've rehearsed
- [ ] Node pool can hold 2× agent pods during a peak-hour rollout
- [ ] Load and soak test passed at 1.5× expected peak (next section)
For the cross-functional version of this list, covering quality bars beyond infrastructure, see the production readiness bar.
How to load-test and soak LiveKit agents on Kubernetes
This protocol tests the fleet, not just the code. Run it against a staging LiveKit project, per LiveKit's own advice to keep separate instances for staging and production. Use real STT, LLM, and TTS providers, because their concurrency limits are part of what you're testing.
1. Prepare the agent. Make it speak first. LiveKit's `lk perf agent-load-test` echo participant only replays what it hears, so an agent that waits for the caller never starts a conversation. Run in `start` mode with production settings.
2. Ramp, don't burst. Run `lk perf agent-load-test --rooms N --agent-name support-v13 --echo-speech-delay 10s --duration 30m`. The CLI creates rooms one at a time, waiting for each agent to join. To go faster, run it from several cloud VMs with raised file-descriptor limits, as LiveKit's load-testing guide describes. Step up to 1.5× your Erlang peak.
3. Find the real cap. At each step, record active jobs per pod, CPU, RSS per job process, dispatch latency, and turn latency. The cap is the highest job count where p95 turn latency stays within 10% of the single-call baseline and no turn-detector timeouts appear. Set `MAX_JOBS` there.
4. Soak for 2 hours at 80% of cap. Pass if job RSS growth stays under 10% per hour and no job crosses `job_memory_warn_mb`.
5. Deploy under load. Roll out a new image mid-soak. Pass if zero jobs end with a forced-drain log, and dispatch p95 stays under 1 second during the rollout.
6. Kill a node. Drain one agent node with `kubectl drain`. Pass if calls on that node finish and new calls land elsewhere without assignment timeouts.
7. Saturate on purpose. Push past fleet capacity with scale-up disabled. Record exactly what a caller hears when every server reports full. If it's silence, fix the fallback before launch.
8. Repeat after every dependency bump. A `livekit-agents` upgrade can change defaults. Even today, the legacy `WorkerOptions` class caps default idle processes at 4 while `AgentServer` doesn't, so set every value you depend on explicitly.
The load test proves the fleet holds. It doesn't prove the agent still books the right appointment at call 600. For that, score full conversations on a fixed scenario set at each load step. Our LiveKit testing guide covers the in-framework side. This is also where an independent evaluator earns its place. Evalgent runs the same scenario suite against your staging fleet at peak load and during a live rollout, then scores task success, latency, and dropped turns for each release. You get a before-and-after you didn't write yourself.
Frequently asked questions
How do I deploy a LiveKit agent to Kubernetes?
Build an image that runs your agent with the `start` command in exec form. Deploy it as a Deployment with no Service, set `LIVEKIT_URL`, API key, and secret from a Secret, and raise `terminationGracePeriodSeconds` above `drain_timeout`. The pods connect out to LiveKit and receive jobs. LiveKit's starter repo includes a working Dockerfile.
How many concurrent calls can one LiveKit agent server handle?
LiveKit suggests 4 cores and 8 GB per agent server for 10 to 25 concurrent jobs, depending on components. Their published test hit 30 jobs with only Silero VAD and no STT, LLM, or TTS clients. Measure your own pipeline with real providers and the turn detector, then cap jobs with a count-based `load_fnc`.
Why does my LiveKit agent server never report full on Kubernetes?
On cgroup v2 with no CPU limit, the default load function divides pod CPU usage by the node's total cores. A 4-core pod on a 32-core node reads 12.5% load at full usage, so it keeps accepting calls. Set `NUM_CPUS` to the pod's CPU request, or use a job-count `load_fnc`.
Why do LiveKit agent calls drop when I deploy?
Usually the Kubernetes grace period is the default 30 seconds, while the agent server wants to drain for up to `drain_timeout`. Other causes are a shell-form CMD that swallows SIGTERM, running `dev` mode, a second SIGTERM that forces exit, or the cluster autoscaler's 600-second termination cap.
Should I autoscale LiveKit agents on CPU?
No. Scale on active jobs per pod, with a target around two-thirds of your per-pod cap. CPU swings with how much callers talk, not how full a pod is. LiveKit's guidance is to scale earlier than your load threshold and to lengthen scale-down stabilization because pods take time to drain.
Is the LiveKit drain_timeout default 30 minutes or 1 hour?
The current `livekit-agents` source sets `DRAIN_TIMEOUT = 3600`, which is one hour, and LiveKit's server options docs agree. Some older material says 1800 seconds. Set it explicitly from your own call-length data, with a maximum call length enforced in code so no call can outlive it.
How do I canary a new LiveKit agent version?
Run the new version under its own `agent_name`, then route a share of calls to it with explicit dispatch, using `create_dispatch` from your backend or a separate SIP dispatch rule. Rollback is a dispatch change. Expect hundreds of calls per arm to detect a 5-point quality drop.
Do I need the LiveKit Helm chart to run agents?
No. The `livekit/livekit-server` Helm chart deploys the LiveKit media server, which needs host networking, Redis, and one pod per node. Agent servers are ordinary Deployments you define yourself. You only need the chart if you self-host the server instead of using LiveKit Cloud.
The bottom line
LiveKit agents run well on Kubernetes once you replace four defaults: the CPU denominator, the idle pool size, the 30-second grace period, and CPU-based autoscaling. Then rehearse deploys under load, because a dropped call during a release looks like success on every infrastructure dashboard.
Related Articles
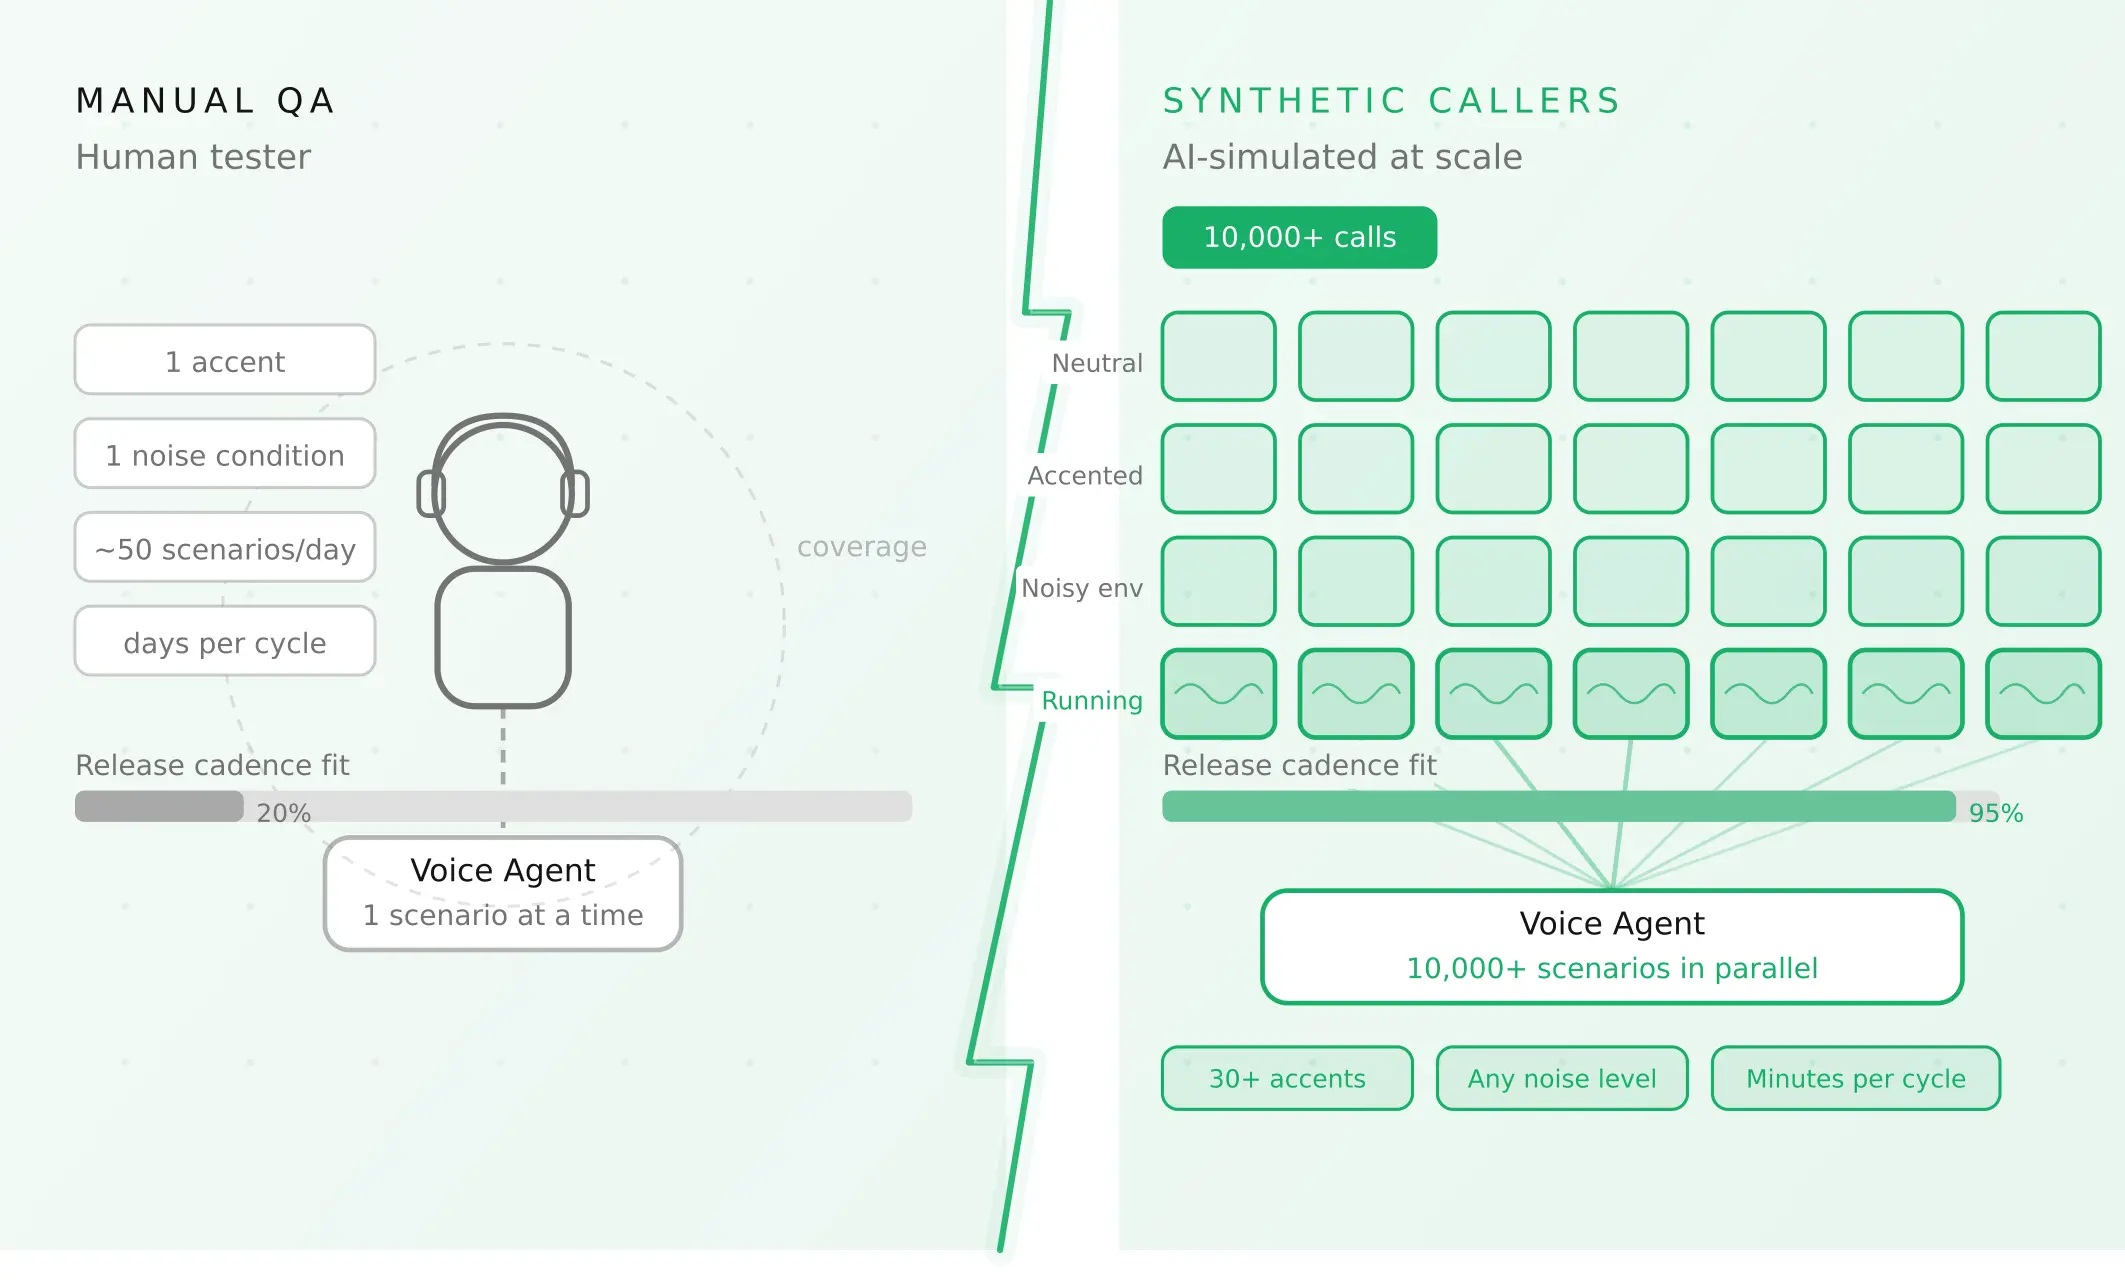
How to automate voice agent testing: synthetic callers vs manual QA
Learn how ai test automation replaces manual QA for voice agents. Compare synthetic callers vs human testers, with a 5-step framework to scale without hiring.
Read more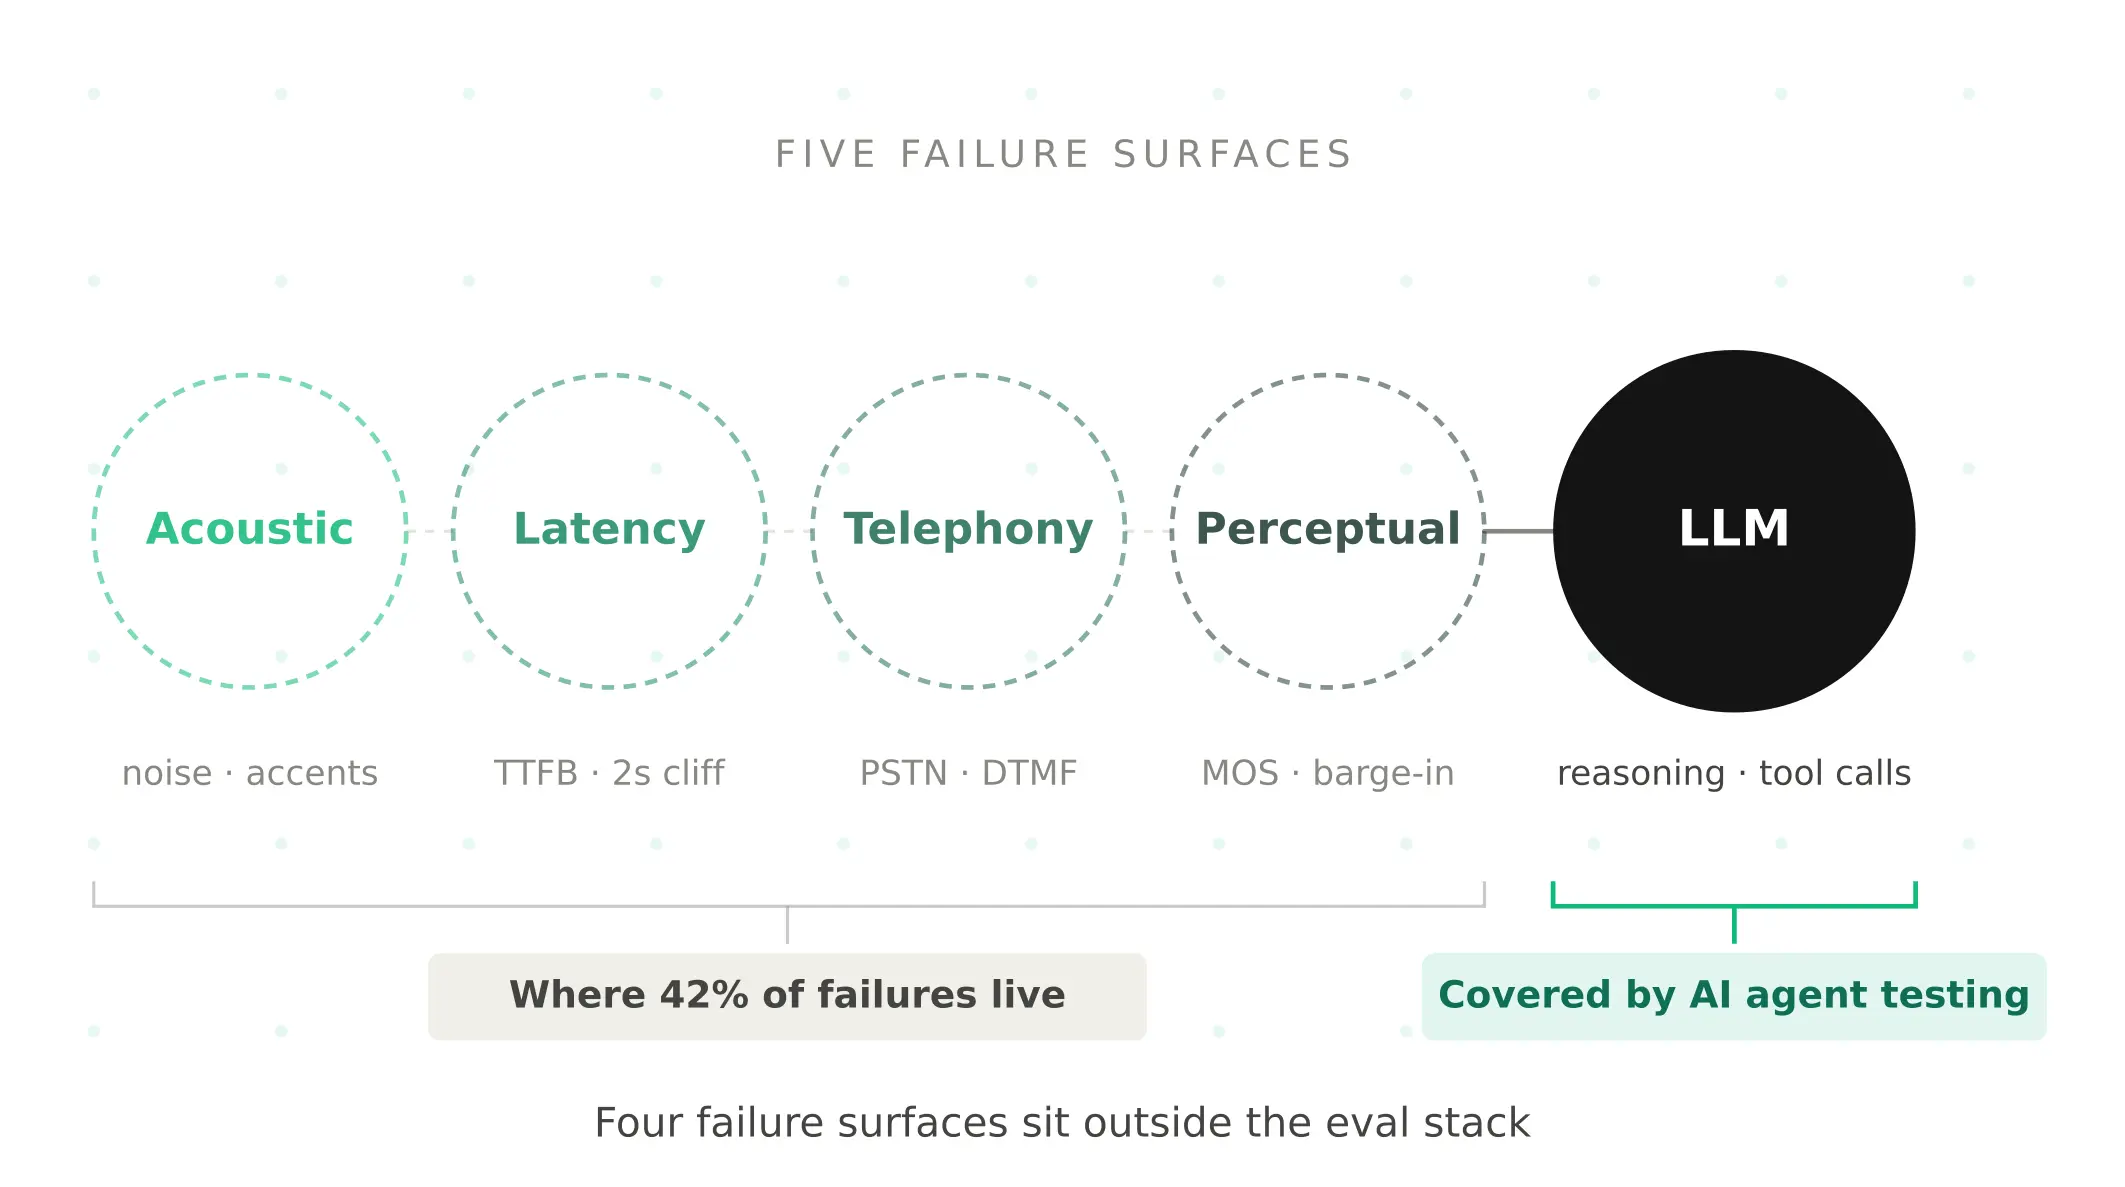
AI Agent Testing vs Voice Agent Testing: What General Tools Miss for Voice
AI agent testing measures text outputs. Voice agent testing measures behaviour through an acoustic pipeline. Five failure categories general tools miss.
Read more