How Many Test Calls Does a Voice Agent Need Before Launch? The Statistics, With Worked Examples
On this page
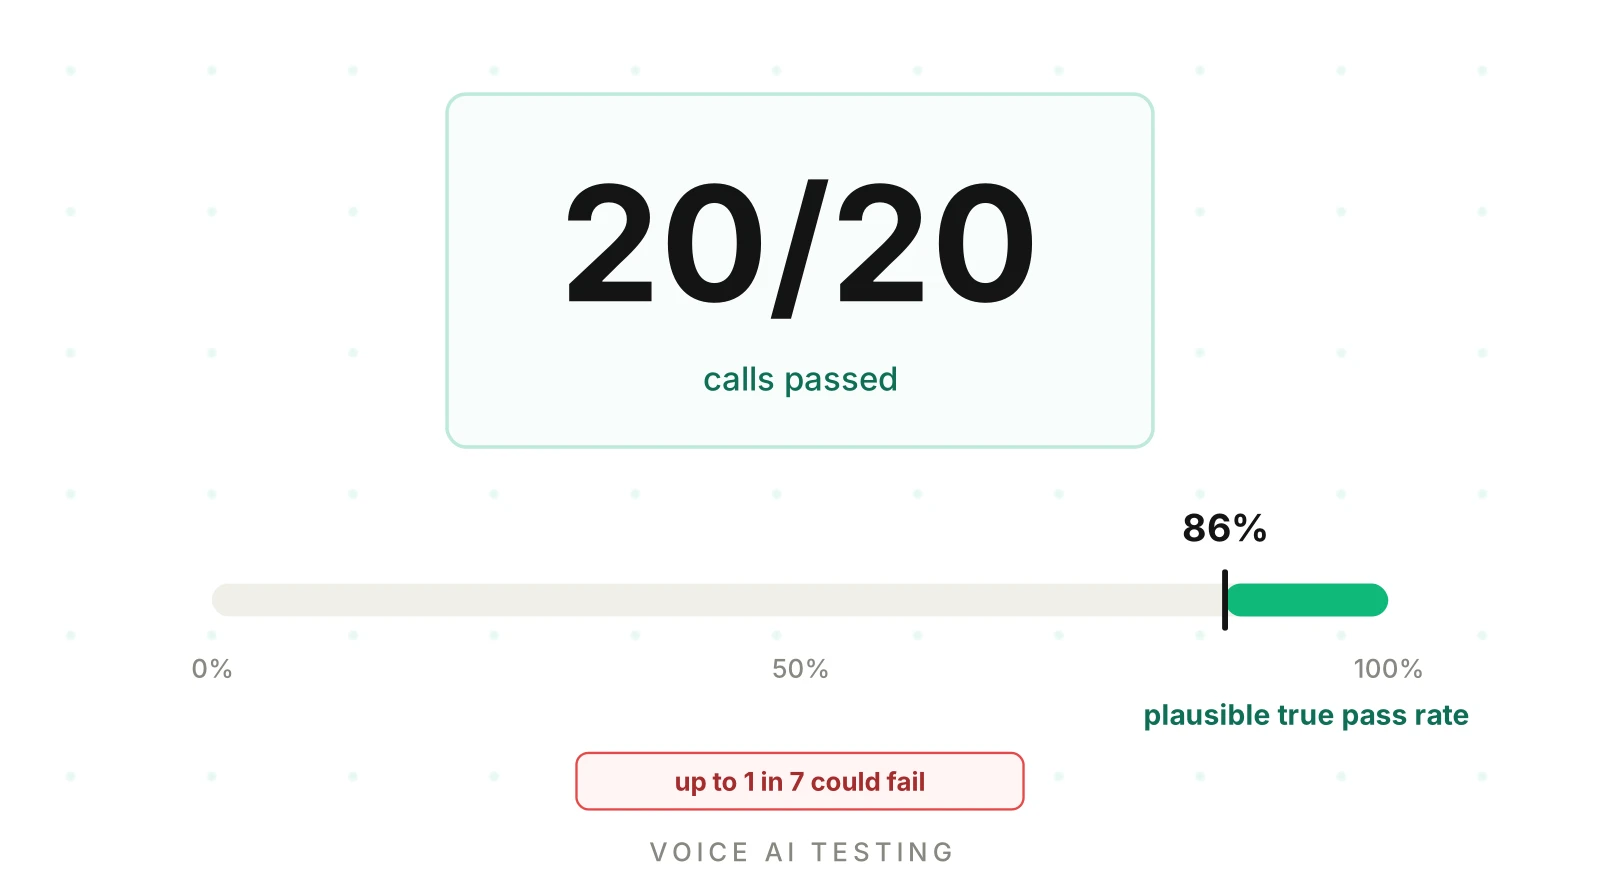
A team runs 20 test calls before launch. All 20 pass. The dashboard shows 100%. Someone asks if that is enough.
It is enough for one claim: the agent is not broken everywhere. It is not enough for the claim people usually mean, which is that it will behave on live callers. This post gives the arithmetic behind that gap. Every number below was computed, and the formulas are shown so you can rerun them.
If you want the wider launch gate, read the production-readiness bar and the 8-gate pre-deployment checklist. This post covers voice agent test sample size: how many calls to test a voice agent before launch, and what each count can prove.
What "how many test calls" really asks
The question hides three separate questions. Each has a different answer.
- Detection. If a failure exists, how likely is a test to show it?
- Estimation. How far could the true pass rate sit from the measured one?
- Assurance. After zero failures, how high could the true failure rate still be?
Sample size follows the claim. A smoke test makes a weak claim. A launch gate for payments makes a strong one. Strong claims cost more calls.
Two terms recur below.
Pass rate: the share of test calls where the agent met every success condition for that scenario.
Scenario: one defined caller goal with a caller profile and pass/fail conditions, for example "caller reschedules, speaks fast, interrupts twice."
The statistics assume each run is an independent draw. Test calls are not perfectly independent. Runs of the same scenario share a prompt, a caller script and a profile. We return to this below.
Why 20 happy-path calls prove little
Take the 20/20 result. Two things go wrong when you read it as "100%."
The first problem is coverage. Twenty cooperative calls on the main flow only test the main flow. They say nothing about interruptions, bad audio, corrections, refusals or tool errors. No statistic can fix a sample drawn from the wrong population.
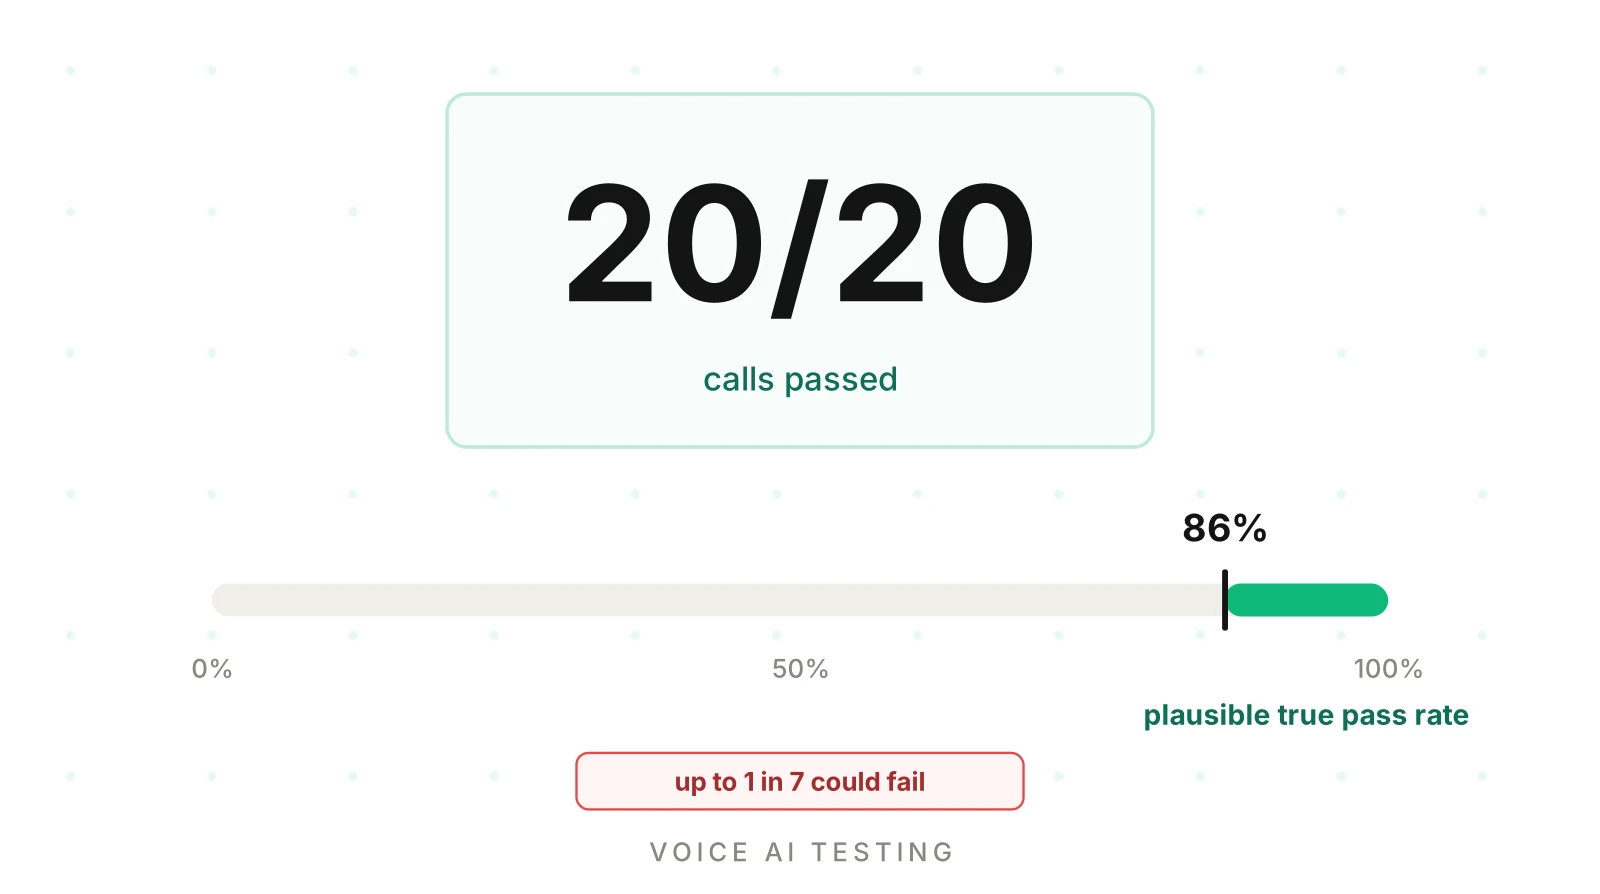
The second problem is precision. Even for the main flow, 20 calls leave wide room. Zero failures in 20 trials is compatible with a true failure rate of about 14%.
The standard shortcut is the rule of three. With zero events in n independent trials, the 95% upper confidence bound on the event rate is about 3/n. A 1995 JAMA letter by Newman states it: the upper limit is approximately 3/N. The letter credits the rule of thumb to Hanley and Lippman-Hand and their earlier article "If Nothing Goes Wrong, Is Everything All Right?", which we did not open.
For 20 calls, the rule gives 3/20 = 15%. The exact limit is a little lower.
The exact one-sided 95% limit with zero failures solves (1 - p)^n = 0.05. So p = 1 - 0.05^(1/n), which is 13.9% for n = 20.
Here is the zero-failure bound for common run counts. All values were computed in Python with the exact formula, then compared with 3/n.
| Clean runs (n) | Exact 95% upper bound on failure rate | Rule of three (3/n) |
|---|---|---|
| 10 | 25.9% | 30.0% |
| 20 | 13.9% | 15.0% |
| 30 | 9.5% | 10.0% |
| 60 | 4.9% | 5.0% |
| 100 | 3.0% | 3.0% |
| 300 | 1.0% | 1.0% |
| 1,000 | 0.3% | 0.3% |
Read it backwards to get the runs you need. For a failure bound of 10%, run 29 clean calls. For 5%, run 59. For 1%, run 299. For 0.1%, run 2,995.
The bound only holds for the scenario you ran. Sixty clean runs of "book an appointment" say nothing about "cancel an appointment."
Detecting rare failures: 1 - (1 - p)^n
Now flip the question. Suppose a failure really occurs on a share p of calls. How likely is a test of n calls to hit it at least once?
The chance a single call is clean is 1 - p. The chance all n calls are clean is (1 - p)^n. So the chance of at least one failure is:
P(detect) = 1 - (1 - p)^n
This detection probability assumes each call fails independently with the same probability p.
| Failure rate p | n = 10 | n = 20 | n = 50 | n = 100 | n = 300 | n = 500 |
|---|---|---|---|---|---|---|
| 5% | 40.1% | 64.2% | 92.3% | 99.4% | 100.0% | 100.0% |
| 2% | 18.3% | 33.2% | 63.6% | 86.7% | 99.8% | 100.0% |
| 1% | 9.6% | 18.2% | 39.5% | 63.4% | 95.1% | 99.3% |
| 0.5% | 4.9% | 9.5% | 22.2% | 39.4% | 77.8% | 91.8% |
| 0.1% | 1.0% | 2.0% | 4.9% | 9.5% | 25.9% | 39.4% |
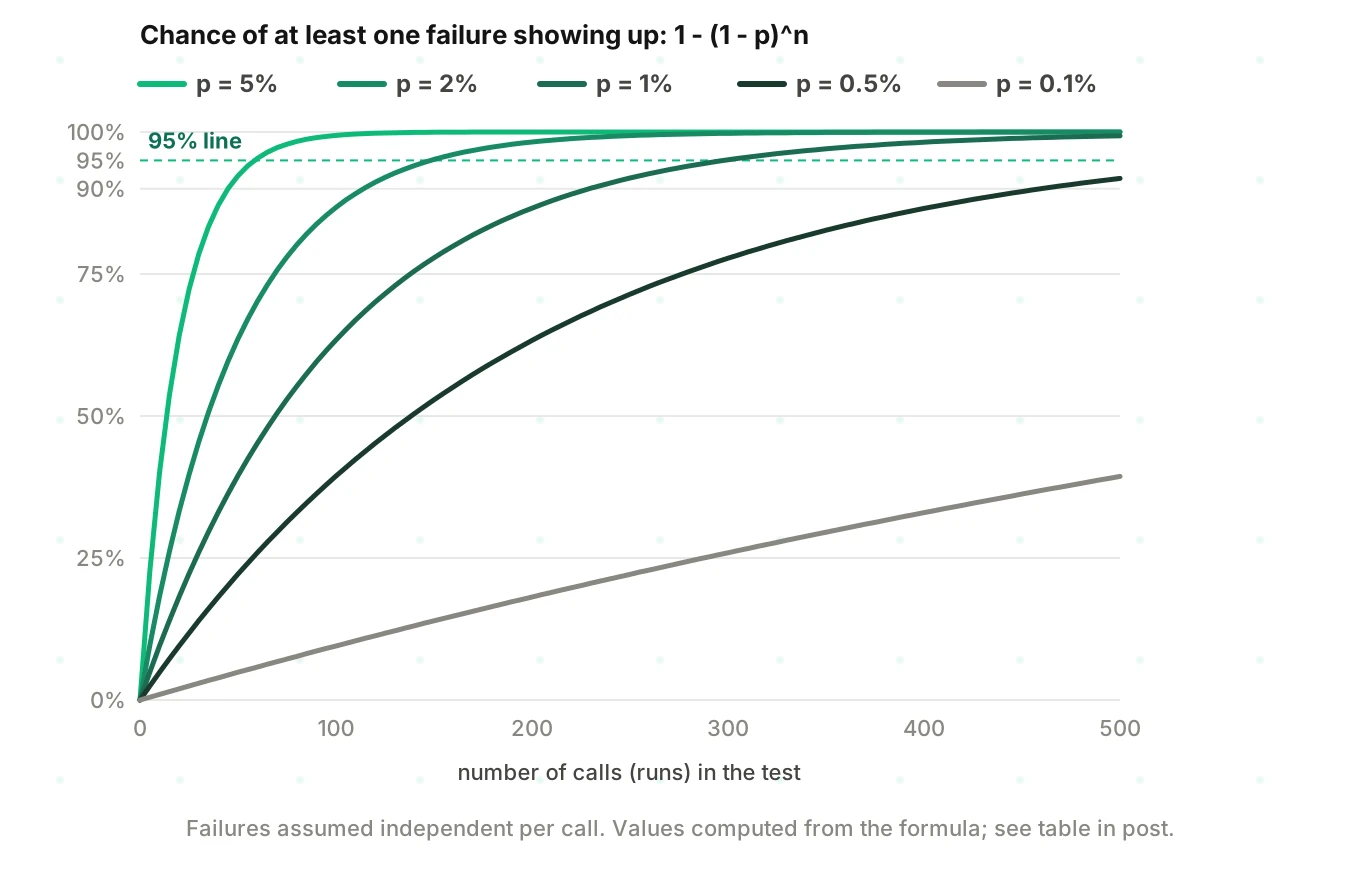
A 1% failure hides from 20 calls about 82% of the time. It still hides from 100 calls about 37% of the time. A 0.1% failure is nearly invisible below a few hundred calls.
To reach a target detection chance c, solve for n:
n = ln(1 - c) / ln(1 - p)
| Failure rate p | n for 50% | n for 90% | n for 95% | n for 99% |
|---|---|---|---|---|
| 10% | 7 | 22 | 29 | 44 |
| 5% | 14 | 45 | 59 | 90 |
| 2% | 35 | 114 | 149 | 228 |
| 1% | 69 | 230 | 299 | 459 |
| 0.5% | 139 | 460 | 598 | 919 |
| 0.1% | 693 | 2,302 | 2,995 | 4,603 |
The 95% column matches the rule of three. That is not a coincidence. To be 95% sure of seeing a failure of rate p, you need about 3/p calls. To be 95% sure of excluding rate p after zero failures, you also need about 3/p calls. It is the same arithmetic read two ways.
A practical consequence follows. A random draw is a weak way to find a rare failure. If you can name the condition, build a scenario for it instead. A failure that only appears for fast speakers on a noisy line should be its own scenario, tested on purpose. Use random volume for the failures you cannot name in advance.
Confidence for a measured pass rate
Often you do see some failures. Then you want an interval around the observed pass rate.
Avoid the textbook formula p̂ ± 1.96 × sqrt(p̂(1 - p̂)/n) for small runs. NIST's Engineering Statistics Handbook calls it an inferior approach, because its limits can fall outside 0 to 1. It also fails at 20/20, where it reports zero width. NIST presents the Wilson interval instead, which it attributes to Wilson (1927).
The Wilson 95% interval for x passes in n calls, with p̂ = x/n and z = 1.96, is:
(p̂ + z²/2n ± z × sqrt(p̂(1 - p̂)/n + z²/4n²)) / (1 + z²/n)
For very small samples or few failures, NIST also gives an exact binomial interval. It notes the exact interval is not symmetric about the observed rate. The exact form is often called Clopper-Pearson, and it is conservative.
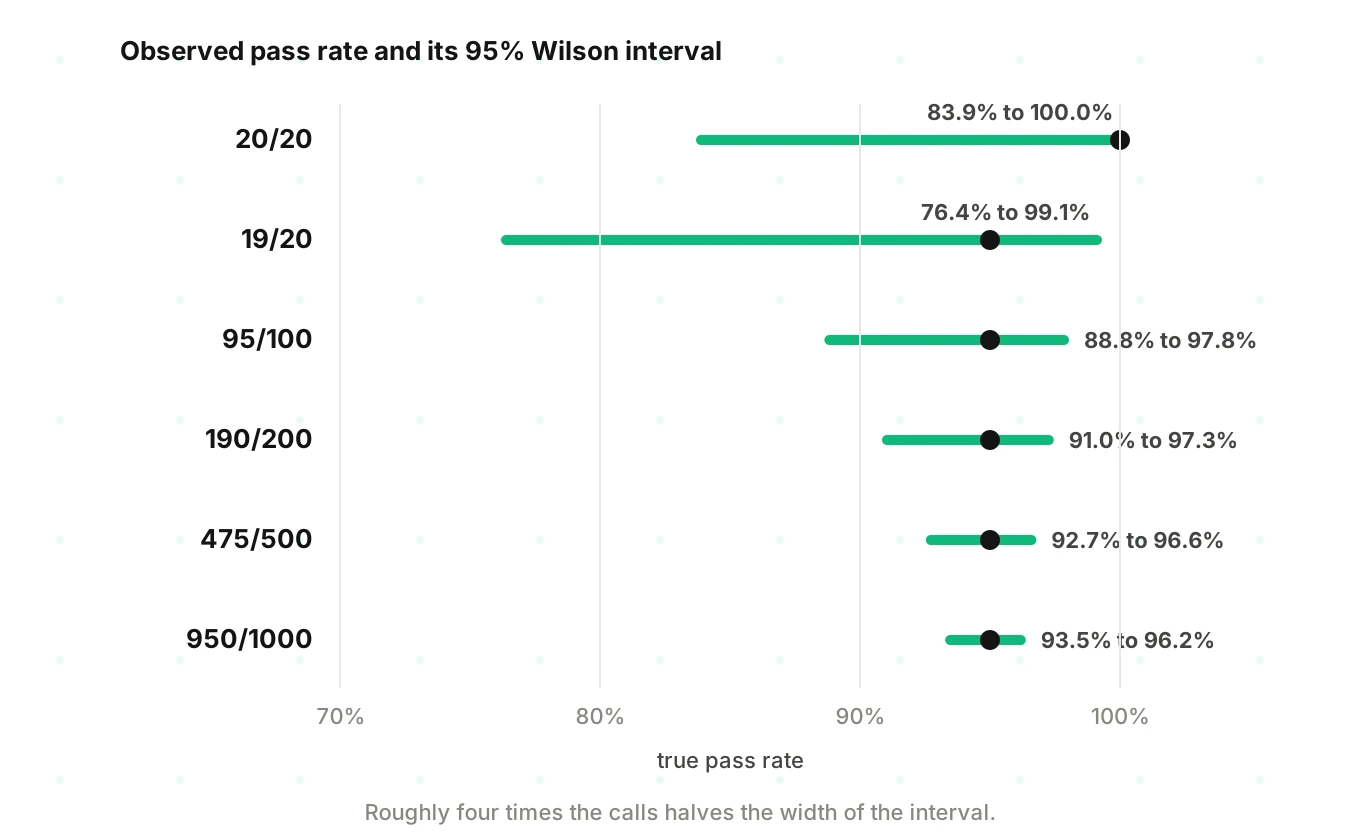
Here are Wilson 95% intervals computed for an observed pass rate near 95%.
| Result | Pass rate | Wilson 95% interval |
|---|---|---|
| 20/20 | 100% | 83.9% to 100% |
| 19/20 | 95% | 76.4% to 99.1% |
| 95/100 | 95% | 88.8% to 97.8% |
| 190/200 | 95% | 91.0% to 97.3% |
| 475/500 | 95% | 92.7% to 96.6% |
| 950/1,000 | 95% | 93.5% to 96.2% |
Twenty calls can tell a broken scenario from a working one. They cannot tell a 95% scenario from a 99% scenario. The intervals overlap almost completely.
Width shrinks with the square root of n. Four times the calls roughly halves the interval.
To size for a margin of error m at 95% confidence, use n = z² × p(1 - p) / m². At p = 0.5 and m = 5 points, that is 385 calls. At p = 0.95 and m = 3 points, it is 203.
NIST's companion page says the normal approximation needs N × p₀ and N × (1 - p₀) both at least 5. For a 1% rate that means 500 calls. Small voice test sets need Wilson or the exact form.
Per scenario versus overall
This is where most voice test plans go wrong. The overall pass rate pools many scenarios. The pooled number can look fine while one scenario is broken.
Here is an illustrative suite. It is made up to show the mechanics, not measured on any real agent. Ten scenarios, 20 runs each, 200 calls in total.
| Scenario | Passes of 20 | Wilson 95% interval |
|---|---|---|
| 1, 2, 4, 6, 8, 10 | 20 each | 83.9% to 100% |
| 3, 7 | 19 each | 76.4% to 99.1% |
| 5 | 18 | 69.9% to 97.2% |
| 9 | 12 | 38.7% to 78.1% |
| Overall | 188 of 200 (94%) | 89.8% to 96.5% |
The overall interval looks tight and healthy. Scenario 9 passes 60% of its runs and sits at the bottom of the table. If you report only the pooled number, you ship scenario 9.
So report two things. Report a pass rate and interval for each scenario, and report the pooled number only as a summary. A golden set works the same way: size it by the smallest slice you want to report on.
There is a second trap. The pooled rate reflects your scenario mix, not your traffic mix. Suppose three flows carry 70%, 20% and 10% of live calls, with illustrative pass rates of 98%, 90% and 60%. The unweighted average of the three is 82.7%. The traffic-weighted rate is 0.7 × 98 + 0.2 × 90 + 0.1 × 60 = 92.6%. Same agent, two different headlines. Say which one you mean.
A third trap is independence. Twenty runs of one scenario are not twenty independent draws of "caller behavior." They share a script. A clean 20/20 supports "this scenario passes under this script." It does not support "all callers like this pass." Vary caller profiles inside a scenario family to widen the claim.
How many scenarios does a voice agent need? Count what the agent can do, not a round number. List each intent, each policy and hard constraint, each tool call, and each failure path. Add profile variants for the risky ones. An illustrative count: 12 intents, 6 hard constraints, 8 failure paths and 4 audio-stress variants make 30 scenarios. Your own list sets the real total. The testing checklist and the stress-testing guide help you fill it.
Repeated runs: the nondeterminism problem
Voice agents are not deterministic. The same scenario can pass on run one and fail on run two. The LLM, the speech recognizer and the simulated caller all vary. Even with a fixed seed, OpenAI's documentation says determinism is not guaranteed and outputs are "mostly" identical. The APIs are non-deterministic by default.
A flaky scenario is one with a per-run failure probability q between 0 and 1. A single run shows you a coin flip. The same detection formula applies, with k runs in place of n.
| Per-run failure q | 1 run | 3 runs | 5 runs | 10 runs | 20 runs |
|---|---|---|---|---|---|
| 50% | 50.0% | 87.5% | 96.9% | 99.9% | 100.0% |
| 20% | 20.0% | 48.8% | 67.2% | 89.3% | 98.8% |
| 10% | 10.0% | 27.1% | 41.0% | 65.1% | 87.8% |
The table shows the chance that k runs include at least one failure. A scenario that fails 20% of the time passes a single run 80% of the time. It passes five straight runs 32.8% of the time, and ten straight runs 10.7% of the time.
So "it passed" is weak evidence for one run. Run each important scenario several times per build. Track the per-scenario pass rate across runs. Treat a scenario that flips between pass and fail as a finding, not noise. A flaky pass often hides a prompt gap that only some phrasings trigger. For the model-update angle, see regression testing when a vendor changes a model.
Repeated runs also stop one lucky call from clearing a gate. They do not fix a scenario that was never written. Repetition buys precision on known scenarios. Coverage needs more scenarios.
How many failures can a gate allow?
Real gates rarely demand zero failures forever. A strict gate would reject any build with a single flaky call. The honest alternative is to say how many failures you tolerate and size the run accordingly.
Using the exact one-sided 95% upper bound, here is the number of runs needed to claim a failure rate below a target, given f observed failures.
| Failures seen (f) | Runs for bound under 10% | Runs for bound under 5% | Runs for bound under 1% |
|---|---|---|---|
| 0 | 29 | 59 | 299 |
| 1 | 46 | 93 | 473 |
| 2 | 61 | 124 | 628 |
One failure costs about 34 extra runs at the 5% target. One failure costs about 174 extra runs at the 1% target. Tolerating failures is possible, and it gets expensive for tight targets.
Here is the code, using the documented scipy.stats.beta.ppf. It is simplified.
import math
from scipy.stats import beta

Z = 1.959963984540054  # two-sided 95%

def wilson(x, n, z=Z):
    p = x / n
    d = 1 + z * z / n
    c = (p + z * z / (2 * n)) / d
    h = z * math.sqrt(p * (1 - p) / n + z * z / (4 * n * n)) / d
    return c - h, c + h

def fail_upper_bound(f, n, conf=0.95):
    # exact one-sided upper limit on failure rate with f failures in n runs
    return 1.0 if f >= n else beta.ppf(conf, f + 1, n - f)

def p_detect(p, n):
    return 1 - (1 - p) ** n

def runs_needed(f, bound, conf=0.95):
    n = f + 1
    while fail_upper_bound(f, n, conf) > bound:
        n += 1
    return n

print(wilson(19, 20))                # about (0.764, 0.991)
print(fail_upper_bound(0, 20))       # about 0.139
print(p_detect(0.01, 100))           # about 0.634
print(runs_needed(0, 0.05))          # 59
A plan by risk tier
So how many test calls does a voice agent need? Not 300 per scenario. Spend calls where a failure is costly. Sort scenarios into three tiers.
Tier 1: money, compliance and irreversible write-back. Payment capture, consent, identity checks, disclosures, cancellations and record updates that a human will not review. The cost of a miss is high. Run each scenario about 60 times and require zero failures, which supports a failure bound near 5% per scenario. See AI disclosure rules for voice agents for one compliance example, and note this is not legal advice.
Tier 2: core revenue and resolution flows. The booking, the status lookup, the order. Run each about 20 times. Zero failures supports a bound near 14%. That is a screening result. Treat two or more failures in 20 as a red flag.
Tier 3: low-risk and rare variants. Cosmetic wording, small talk, uncommon but harmless branches. Five runs each. With zero failures, the bound is still 45%. Use these as smoke tests only, and never as evidence of reliability.
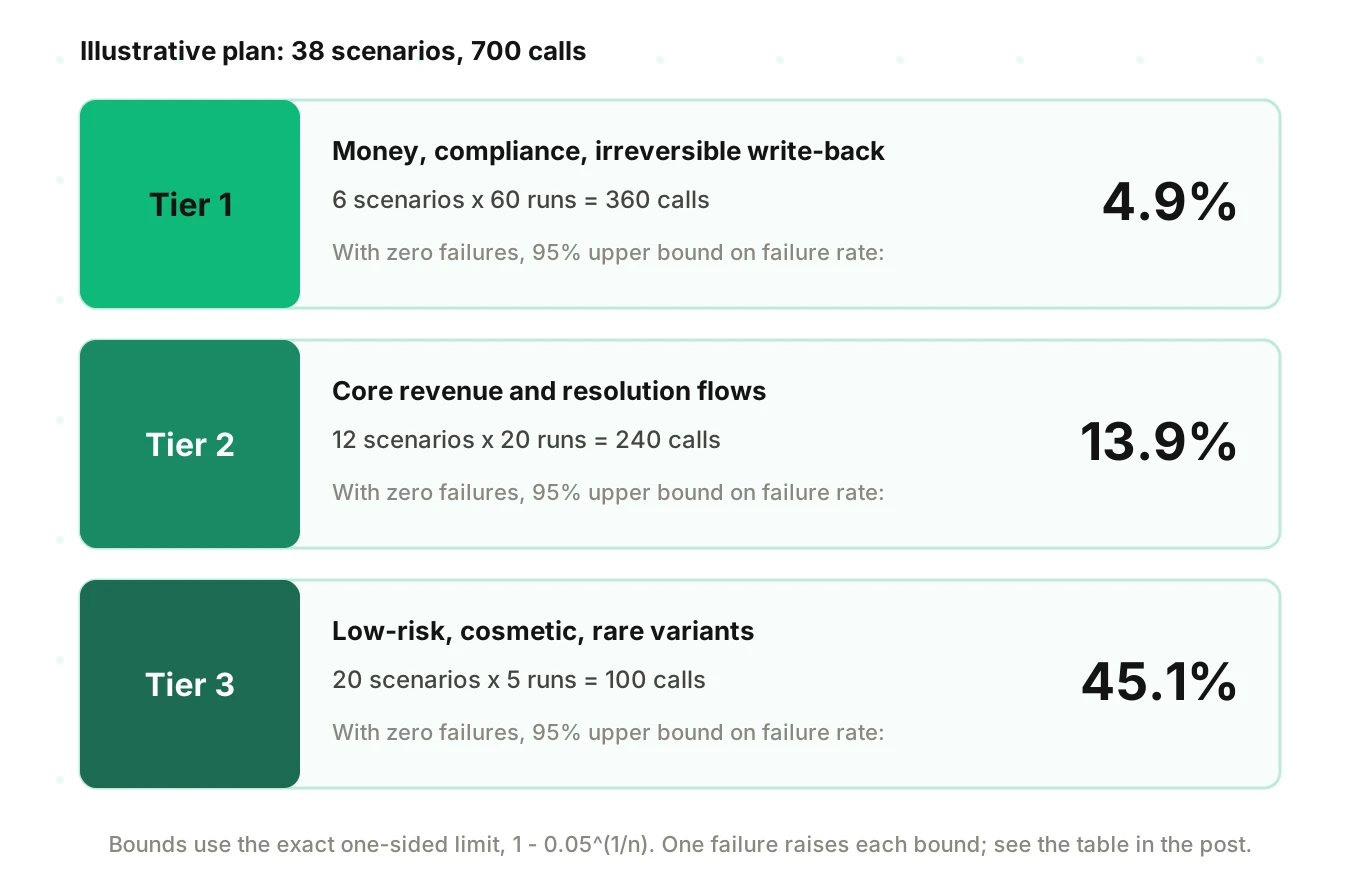
For the illustrative suite in the diagram, 6 Tier 1 scenarios times 60 runs, 12 Tier 2 scenarios times 20 runs, and 20 Tier 3 scenarios times 5 runs total 700 calls. The mix is an example, not a recommendation for your agent. If a Tier 1 scenario shows one failure in 60 runs, the exact 95% upper bound is 7.7%. With two failures it is 10.1%. Fix the cause, then rerun on the new build.
Rerun after every prompt, model or tool change. For thresholds on the rates themselves, see how to set production thresholds. To size a proof of concept the same way, see designing a voice agent POC.
What a pre-launch sample cannot catch
Run the production math. Say the agent takes 1,000 calls a day and a bug affects 1% of them. That is about 10 failing calls a day. A team that reviews 50 random calls a day will see at least one of those about 40% of the time (exact hypergeometric chance with 10 bad calls in 1,000 is 40.3%). The other 60% of days the review finds nothing. The numbers are illustrative.
Pre-launch testing makes claims about scenarios you wrote. Live traffic tests everything else. Sampling live calls is a valid method when scoring everything is too costly. Scoring every call removes the detection problem, because the sample is the whole population.
Where Evalgent fits
Evalgent is a testing, evaluation and monitoring platform for voice agents. It helps with the parts of this plan that are hard to do by hand.
- Scenario sets. It generates test scenarios from the agent's prompt and flows, covering states, branches, policies and hard constraints, so coverage starts from the agent rather than from memory.
- Caller profiles and repeated runs. Scenarios run against profiles that vary accent, speech pace, interruption level, response delay, background noise and language. You can repeat runs and read a pass rate per scenario, which is the number the tier plan needs.
- Audio-based evaluation. Verdicts come with evidence and human review, so a disputed result can be checked against the call.
- Production monitoring. Customers push call recordings. Calls are transcribed, mapped to scenarios and judged, which covers the rare failures a pre-launch sample misses.
Evalgent works with teams to set up evals for their first agent. It does not remove the arithmetic above. It supplies the runs and per-scenario counts to apply it to.
How to size your test calls before launch
1. List the scenarios — write one per intent, policy, hard constraint, tool call and failure path. Add audio-stress and caller-profile variants for risky flows.
2. Assign each scenario a risk tier — Tier 1 for money, compliance and irreversible actions. Tier 2 for core flows. Tier 3 for everything else.
3. State the claim per tier — decide the failure rate you must rule out, such as under 5% for Tier 1. Pick the confidence level, usually 95%.
4. Compute runs from the claim — use n = ln(0.05) / ln(1 - bound) for zero failures. Add runs if you will tolerate failures.
5. Run each scenario repeatedly — vary caller profile and noise inside the scenario. Use several runs per build to expose flaky behavior.
6. Report per scenario first — give pass rate, count and a Wilson interval for each scenario. Show the pooled rate last, weighted by live traffic.
7. Treat any Tier 1 failure as a stop — find the cause, fix it and rerun the full run count on the new build.
8. Keep measuring after launch — score live calls and feed new failures back into the scenario set.
Frequently asked questions
How many test calls does a voice agent need before launch?
There is no single number. Size runs by the claim and the risk. Zero failures in 20 calls only bounds the failure rate near 14%. About 60 clean runs support a 5% bound, and about 300 support 1%. Apply those counts per critical scenario, and use fewer runs for low-risk ones.
Are 20 test calls enough for a voice agent?
Twenty calls can show that a scenario is broken. They cannot show it is reliable. With zero failures, the true failure rate could still be about 14% at 95% confidence. They also usually cover only the happy path, so unusual callers and failure paths stay untested.
What is the rule of three for voice agent testing?
The rule of three says that after n clean runs with zero failures, the 95% upper bound on the failure rate is about 3/n. Sixty clean runs bound it near 5%. Three hundred bound it near 1%. It applies only to the scenario you actually ran.
How do I calculate the chance a test finds a rare failure?
Use 1 - (1 - p)^n, where p is the failure rate per call and n is the number of calls. For a 1% failure, 100 calls detect it 63.4% of the time. To reach 95% detection you need about 3/p calls, which is 299 for a 1% failure.
How do I calculate a voice agent pass rate confidence interval?
Use the Wilson score interval, which NIST documents, rather than the plain normal formula. For 19 passes in 20 calls the 95% interval is 76.4% to 99.1%. For 190 in 200 it is 91.0% to 97.3%. For tiny samples with few failures, an exact binomial interval is also valid.
Should I set sample size per scenario or overall?
Set it per scenario, then summarize overall. A pooled pass rate can hide one broken scenario, as when 188 of 200 calls pass but one scenario passes only 12 of 20. Report each scenario's rate with an interval. Weight the overall rate by live traffic, not by your test mix.
How many scenarios does a voice agent need?
Count what the agent can do. List every intent, policy, hard constraint, tool call and failure path, then add profile and audio-stress variants for risky flows. The total comes from your agent, not a round number. Tools can generate scenarios from the prompt to help you find gaps.
Why run the same voice agent test scenario multiple times?
Voice agents are nondeterministic, so a single pass is a coin flip. A scenario that fails 20% of runs passes one run 80% of the time. Five runs catch that failure 67.2% of the time and ten runs catch it 89.3%. Repeated runs also expose flaky scenarios.
The bottom line
A clean result from 20 test calls rules out little, and the count you need depends on the failure rate you must exclude and the risk of the scenario. Size runs per scenario by tier, repeat them to handle nondeterminism, and use live-call scoring to catch the failures that no pre-launch sample can reach.
Related Articles

How to automate voice agent testing: synthetic callers vs manual QA
Learn how ai test automation replaces manual QA for voice agents. Compare synthetic callers vs human testers, with a 5-step framework to scale without hiring.
Read more
AI Agent Testing vs Voice Agent Testing: What General Tools Miss for Voice
AI agent testing measures text outputs. Voice agent testing measures behaviour through an acoustic pipeline. Five failure categories general tools miss.
Read more