ElevenLabs Agents Monitoring and Observability: What the Platform Shows and What's Missing
On this page
A caller says the agent "kept asking the same thing" and hung up. You open ElevenLabs. There is a transcript, a success verdict and some latency. The question is how much of that survives outside the dashboard. ElevenLabs agents observability also needs your own additions to answer "why did it fail" across hundreds of calls.
This post covers what the ElevenLabs docs describe as of November 19, 2026, each page opened that day. It maps the surfaces, then separates what the platform view does not show by itself. It ends with a 5-step export into a store you own. It does not repeat our testing guide for ElevenLabs agents, which covers pre-launch checks.
What ElevenLabs Agents shows per its docs
The docs group these under an Operate section with a Monitor list in the sidebar. Some pages appear under both agents-platform and eleven-agents paths. Treat everything below as a dated snapshot.
| Surface | What it gives you | Where it lives |
|---|---|---|
| Conversation history | Per-conversation record, keyword and semantic search | ElevenLabs dashboard and API |
| Conversation analysis | Success evaluation and data collection results | Dashboard, webhook, API |
| Analytics | Counts, duration, cost, latency, errors, grouped by filters | Dashboard |
| Spotlight | Real-time insights, sentiment, discovered topics | Dashboard |
| Alerts | Error-rate and score monitors with Slack, PagerDuty, webhook | Dashboard and notifiers |
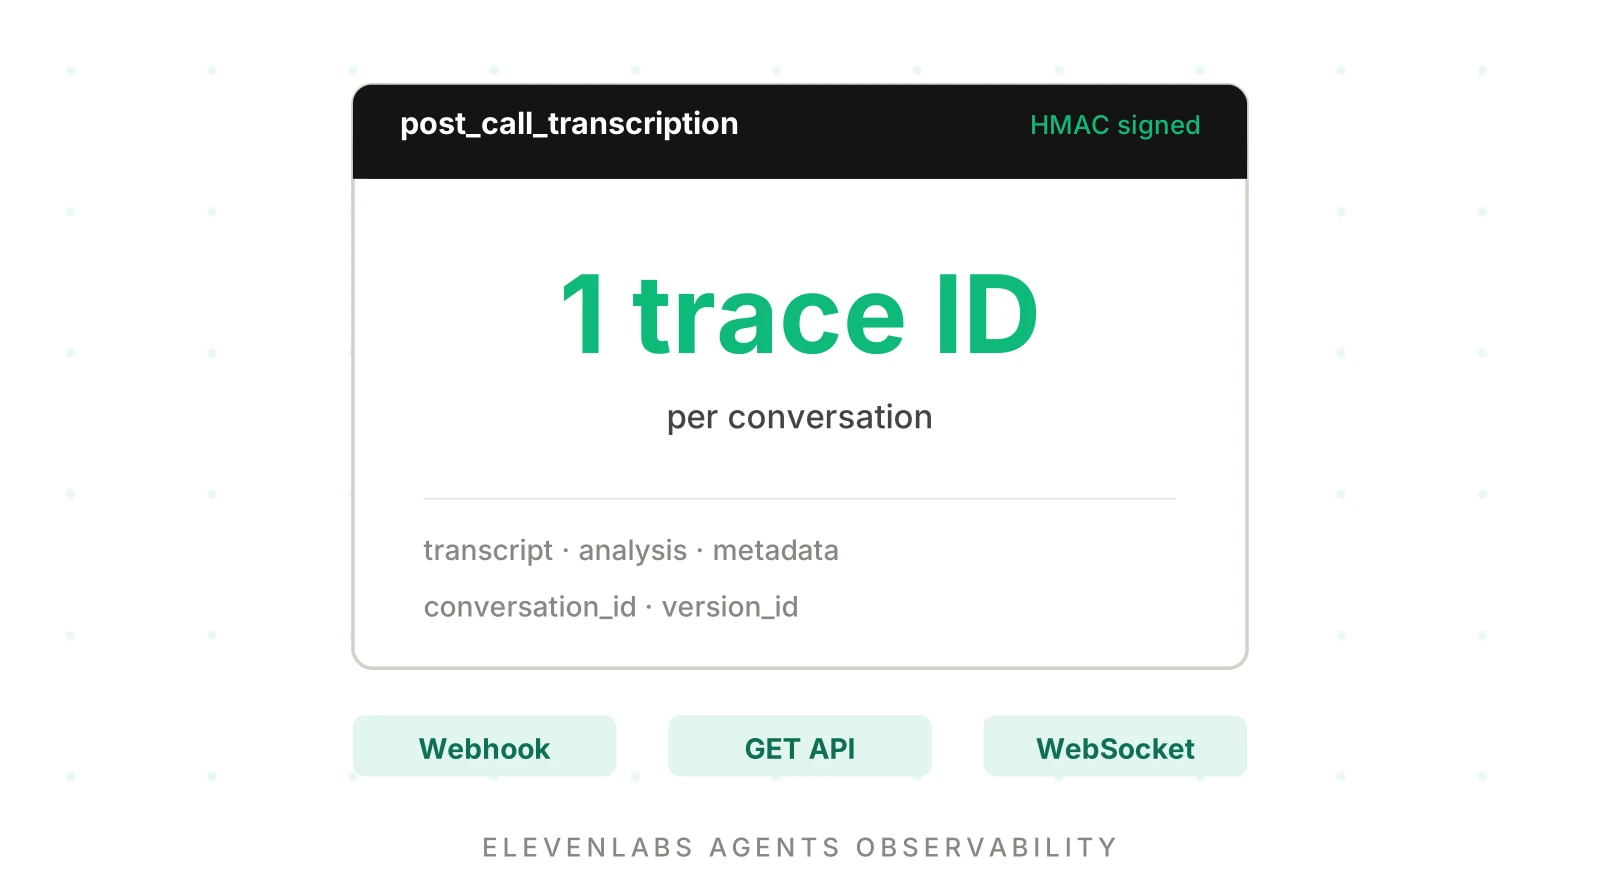
| Post-call webhooks | Transcript, audio and call-failure events | Your HTTPS endpoint |
| Conversation API | List and fetch conversations, fetch audio | Your code |
| OpenTelemetry traces | OTLP-shaped JSON per conversation | Webhook, API, WebSocket |
| Testing and experiments | Automated tests, A/B branches on live traffic | Dashboard and API |
Conversation history and the conversation API for ElevenLabs agents observability
ElevenLabs conversation history is reachable by API as well as in the dashboard. The list conversations endpoint is GET https://api.elevenlabs.io/v1/convai/conversations. It pages with page_size (1 to 100, default 30) and a cursor taken from next_cursor. Filters include agent_id, branch_id, version_id, call_start_after_unix, call_successful, termination_reasons, tool_names_errored and user_id.
Each row carries fields such as conversation_id, call_duration_secs, status, call_successful, cost, termination_reason, transcript_summary, tool_names, data_collection_results and tag_ids. The page says each object has 27 properties but its example shows 26. Read the live response, not the example.
The get conversation endpoint returns one conversation. Its response includes status, metadata, transcript, analysis, visited_agents, conversation_initiation_client_data, environment and three audio flags: has_audio, has_user_audio and has_response_audio. Transcript turns include fields such as role, message, tool_calls, tool_results and interrupted. Audio is a separate endpoint, GET /v1/convai/conversations/:conversation_id/audio. That page gives no schema, content type or availability timing.
Search has two modes per the search docs. Keyword search is full-text with fuzzy matching. Smart search uses embeddings to match transcript chunks by meaning, and most filters are off while a query is active.
Analysis: success evaluation and data collection
The success evaluation page describes custom criteria checked against each transcript. A criterion has a name and a description prompt. The limit is 30 per agent. Each returns success, failure or unknown, with a rationale. unknown appears when the transcript cannot settle the question.
The data collection page extracts fields from the transcript. Types are string, boolean, integer and number. Limits are 25 items per agent, or 50 on trial and Enterprise plans. Missing data returns null or empty values.
Both are LLM judgments of the transcript. That is useful, and it is also the boundary. A criterion can only see what the transcript shows.
Dashboard analytics, Spotlight and alerts
ElevenLabs agents monitoring splits into three layers: analytics for trends, Spotlight for topics, alerts for error rates. For ElevenLabs conversational AI analytics, the dashboard page lists call count, total and average duration, cost, agent response latency (median and percentiles), error rate and error breakdown by type, success rates per criterion, language breakdown and active calls. You can filter by agent, branch, call type, language, LLM, TTS and ASR model, tool type, error type and evaluation criteria. Any filter can group the metrics.
Spotlight shows sentiment and "recurring topics discovered from conversation transcripts", with the conversations behind each topic. Its real-time insights view adds volume, success rate, usage trends and suggested actions.
Alerts run by default. The monitored conditions are conversation failure, tool failure per tool, webhook error, guardrail trigger, call initiation error and an evaluation success score. Channels are the dashboard (90 days of history), webhooks, Slack and PagerDuty. For what to page on in general, see voice agent alerting.
Post-call webhooks
The post-call webhook page documents three event types.
| Event type | Contents |
|---|---|
post_call_transcription | Transcript, analysis, metadata |
post_call_audio | conversation_id plus base64 MP3 in full_audio |
call_initiation_failure | failure_reason (busy, no-answer, unknown) and telephony metadata |
The envelope is type, data and event_timestamp. For transcription events, data includes agent_id, conversation_id, status, user_id, branch_id, version_id, environment, transcript, metadata, analysis, conversation_initiation_client_data and the three has_*audio flags. Inside analysis the page names call_successful, transcript_summary, evaluation_criteria_results and data_collection_results.
For failed outbound calls, the metadata.type is sip or twilio. SIP bodies include sip_status_code and error_reason. Twilio bodies are the Twilio StatusCallback payload. Calls that reach voicemail count as started and send no failure event.
Authentication is HMAC. You verify the signature header with the SDK, using constructEvent in JavaScript or construct_event in Python. The page spells the header ElevenLabs-Signature in prose and elevenlabs-signature in code. Header names are case-insensitive, so either works.
OpenTelemetry traces
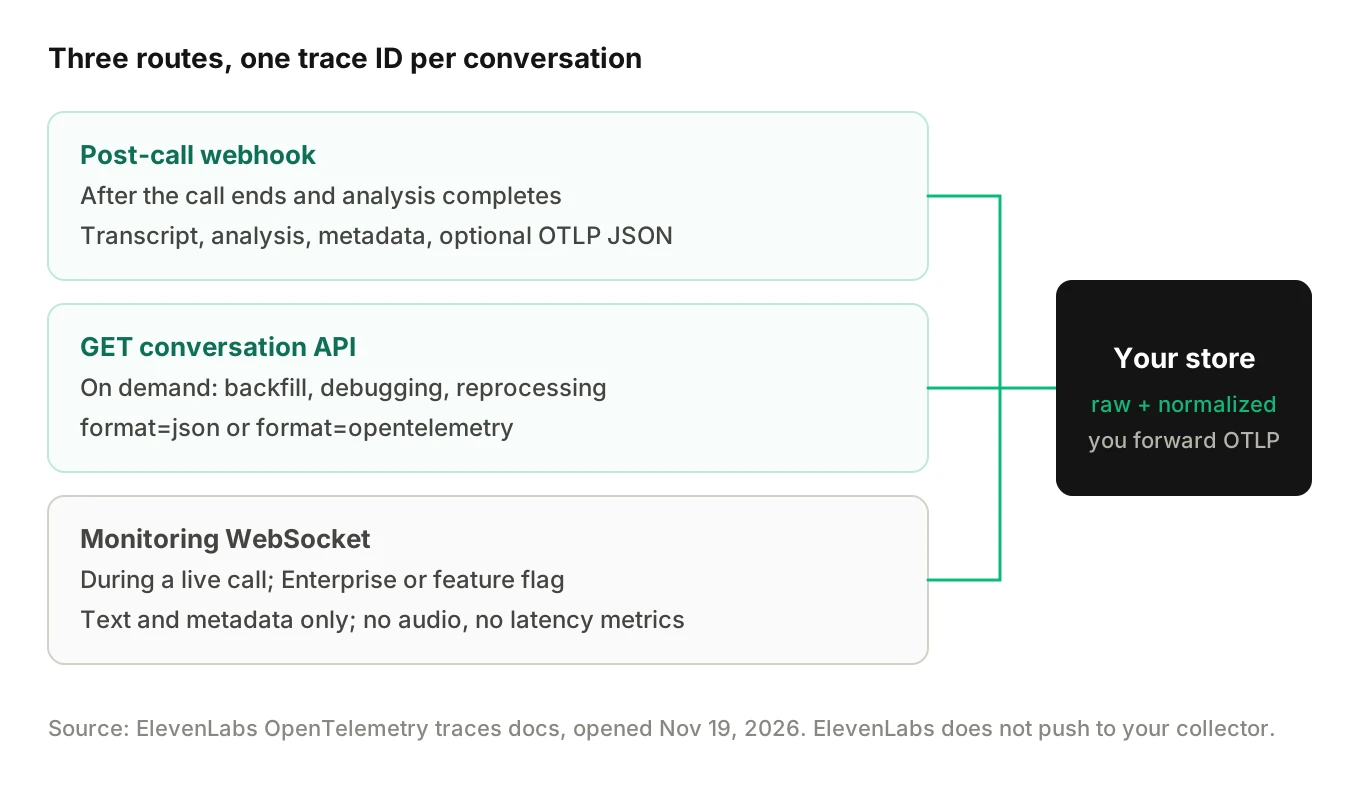
This is the surface most readers miss. The OpenTelemetry traces page says ElevenLabs Agents can export a conversation as OTLP JSON (resourceSpans). Three routes share one trace ID per conversation and elevenlabs.* attribute names:
- Post-call webhook. Type
post_call_transcription_otel, withconversation_id,agent_idandotlp_traces. You settranscript_formattoopentelemetry. - GET conversation. Add
?format=opentelemetry. The defaultjsonformat omitsotlp_traces. - Monitoring WebSocket.
wss://api.elevenlabs.io/v1/convai/conversations/{conversation_id}/monitor?events_format=opentelemetry.
The page is explicit that ElevenLabs does not send data to your collector. You receive the JSON and forward it yourself. It is OTLP-shaped JSON, not a push to a gRPC endpoint.
The root span is elevenlabs.conversation. Attributes named on the page include elevenlabs.agent_id, elevenlabs.status, elevenlabs.session.duration_ms and elevenlabs.cost. Transcript spans are elevenlabs.recv.user_transcript and elevenlabs.recv.agent_response, with elevenlabs.interrupted and elevenlabs.turn.index. Tool spans are elevenlabs.tool.{name}, with params, result and elevenlabs.tool.latency_ms. Latency is elevenlabs.metric.{name}_ms. Other groups are elevenlabs.analysis.*, elevenlabs.telephony.*, elevenlabs.llm_usage.* and elevenlabs.rag.*. For how these compare with a voice-specific model, see the OpenTelemetry span model for voice agents and voice agent span attributes.
The page documents no beta label for the post-call and GET routes. The live WebSocket needs an Enterprise workspace or a feature flag, per that page and the real-time monitoring page.
Testing and experiments
Testing has three types: simulation, next-reply and tool-call. You can create a test from a real conversation and run it by dashboard, CLI or API. Experiments split live traffic across versioned branches. The page lists CSAT, containment rate, conversion, handling time, median agent response latency and cost per agent resolution as comparison metrics. So release comparison is documented, at branch level.
What the platform view does not show by itself
None of these are defects. They are the edges of a platform view, and every ElevenLabs agents observability setup meets them. Each one is where your own store earns its place.
| Question | ElevenLabs surface | What the docs I read do not describe |
|---|---|---|
| Which step caused this failure? | Transcript, tool spans, error breakdown | A grouping of failures by the step or handoff that caused them |
| Which causes repeat across calls? | Topic discovery, Issues queue, multi-run test failure buckets | Automatic root-cause clustering across live calls |
| Did this release cause the drop? | Branch and version filters, experiments | Comparison against your own prompt, tool or provider changes outside branches |
| What happened on the phone leg? | elevenlabs.telephony.*, SIP and Twilio failure metadata | Carrier-side detail beyond the fields above |
| Did the downstream write succeed? | Tool call result as the agent saw it | Your CRM or booking record state |
| Is this call like last month's? | 90-day alert history, retention you set | Long-term history you do not configure |
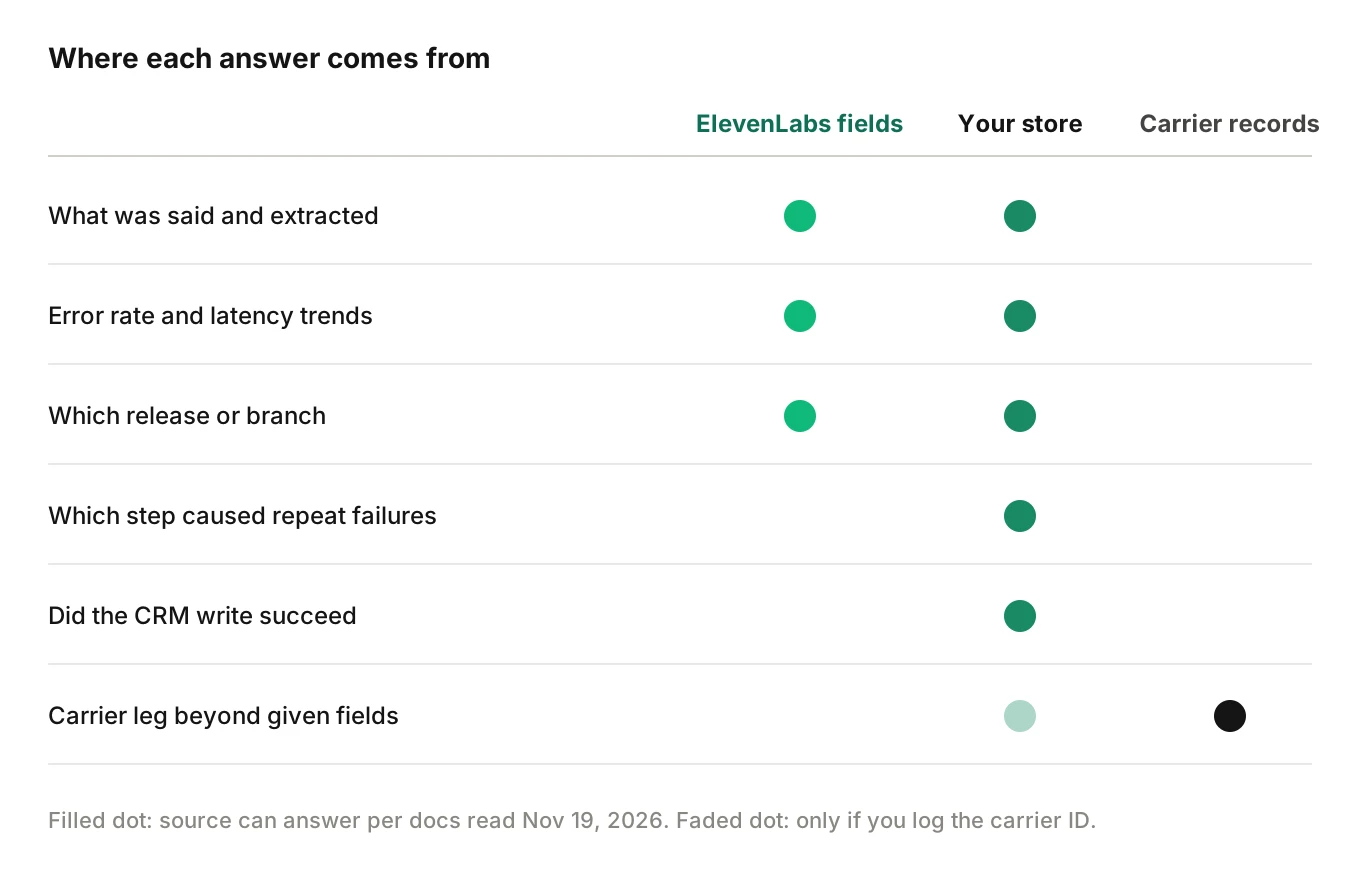
Three of these deserve a closer look.
Clustering by cause. Spotlight groups by what callers talk about. That tells you the topic of a failing call. It is a different question from which pipeline step broke. The Issues page says there is no documented automatic clustering. It describes a merged status, and an Architect review marked "coming soon". Grouping by cause is a job for data you own. See how to cluster voice agent failures and voice agent root cause analysis.
Evaluation sees transcripts. Success criteria run on the transcript. A tool that returned success but wrote the wrong record reads as success in the transcript. Your own join to the system of record is what catches it.
Telephony beyond the fields. You get call initiation failures with SIP codes and Twilio status. Mid-call quality, carrier routing and post-dial delay are not in the pages I read. Your carrier records are the source. For correlating them, read voice agent call ID correlation and tracing a voice call end to end.
How to export ElevenLabs conversations into your own observability store in 5 steps
The endpoints and event names below were checked against the docs on November 19, 2026. The payload is illustrative.
1. Create the webhook and pick events — In workspace settings, create a webhook with HMAC auth and your HTTPS URL. Assign it as the post-call webhook and enable the transcript event. Turn on audio only if you need it. Turn on retries, because the webhook docs say they are off by default.
2. Verify, acknowledge, enqueue — Verify the signature on the raw body with the SDK. Return HTTP 200 promptly and do the work later. The docs ask for an idempotent handler, since a retry looks identical to the first delivery.
3. Store the raw payload first — Write the body unchanged, keyed by conversation_id. Add a received-at time. Keep audio in object storage under the same key. Do not drop unknown fields. The docs warn that dynamic_variables can gain keys and value types.
4. Backfill and reconcile with the API — Webhooks can fail, and the docs auto-disable a webhook after 10 or more consecutive failures when its last success was over 7 days ago or it never succeeded. Run a scheduled job that lists conversations since your last checkpoint and fetches any you are missing.
5. Normalize and join — Map fields into your call table. Add version_id, branch_id and environment as release tags. Attach your carrier call ID, CRM record and tool outcomes. If you enabled OpenTelemetry payloads, forward otlp_traces to your trace backend.
An illustrative transcription event, using documented field names and invented values:
{
  "type": "post_call_transcription",
  "event_timestamp": 1795100000,
  "data": {
    "agent_id": "agent_example",
    "conversation_id": "conv_example",
    "status": "done",
    "branch_id": "branch_example",
    "version_id": "version_example",
    "environment": "production",
    "transcript": [{"role": "user", "message": "..."}],
    "metadata": {},
    "analysis": {
      "call_successful": "success",
      "transcript_summary": "...",
      "evaluation_criteria_results": {},
      "data_collection_results": {}
    },
    "has_audio": true
  }
}
A simplified backfill for step 4 uses only documented parameters:
import os, requests

BASE = "https://api.elevenlabs.io/v1/convai"
HEADERS = {"xi-api-key": os.environ["ELEVENLABS_API_KEY"]}

def list_since(agent_id, start_unix):
    cursor = None
    while True:
        params = {"agent_id": agent_id,
                  "call_start_after_unix": start_unix,
                  "page_size": 100}
        if cursor:
            params["cursor"] = cursor
        r = requests.get(f"{BASE}/conversations", headers=HEADERS,
                         params=params, timeout=30)
        r.raise_for_status()
        body = r.json()
        yield from body["conversations"]
        if not body.get("has_more"):
            break
        cursor = body["next_cursor"]

def fetch(conversation_id, otel=False):
    params = {"format": "opentelemetry"} if otel else {}
    r = requests.get(f"{BASE}/conversations/{conversation_id}",
                     headers=HEADERS, params=params, timeout=30)
    r.raise_for_status()
    return r.json()
Skip rows whose status is not done, and fetch them again later. For the fields worth keeping in your own store, see what to log on every voice agent call.
Gotchas to plan for
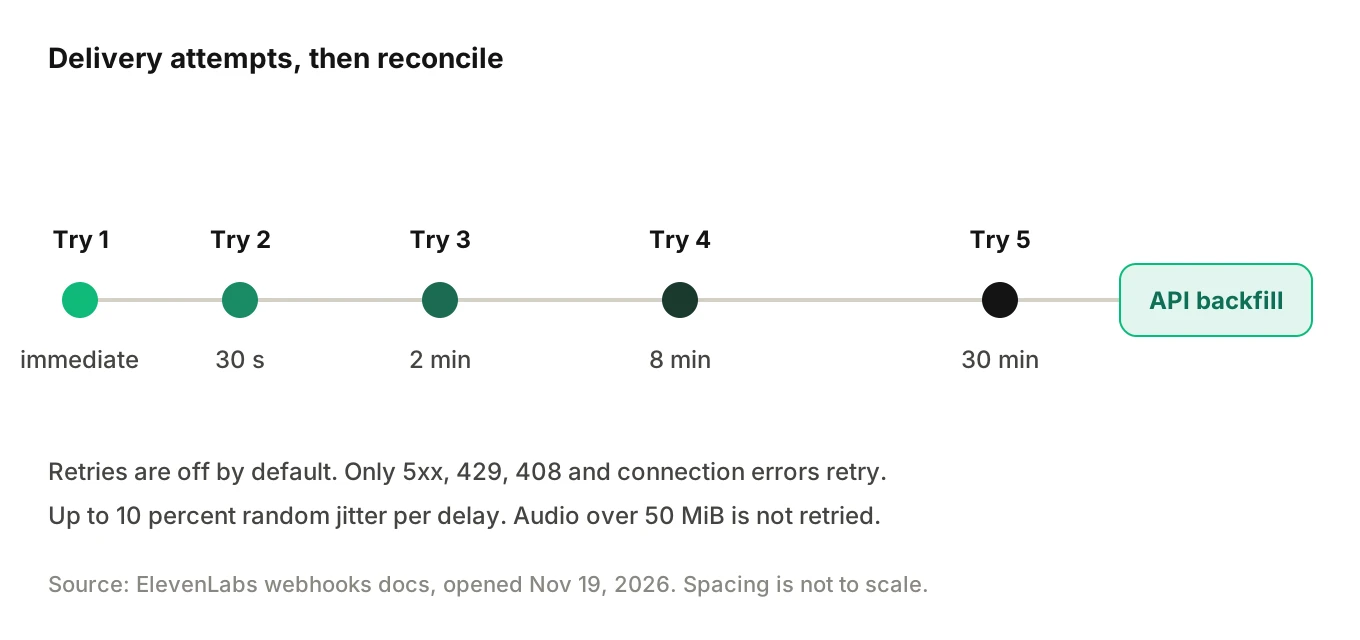
- Retries are bounded. The schedule is immediate, 30 seconds, 2 minutes, 8 minutes and 30 minutes, plus up to 10 percent jitter. Only 5xx, 429, 408 and connection errors retry. Other 4xx responses do not. Each webhook holds at most 100 pending retry jobs.
- Audio has size rules. An audio payload over 50 MiB is delivered once and not retried. Audio arrives as a chunked HTTP body with a 5-minute request timeout.
- Trace attributes are truncated. Post-call and GET spans cut long tool params and results at 4 KB per attribute. Signed file URLs in attributes expire after about 15 minutes. Copy files you need.
- The monitoring stream is thinner. It carries text and metadata only, omits latency metrics, and event order may not match speaking order. On reconnect it replays history with new span IDs, so deduplicate by content.
- Retention shapes your history. Your ElevenLabs agent logs, meaning stored conversation records, last 2 years by default. You can set days,
-1for unlimited, or0, with separate settings for transcripts and audio. Shortening it for existing data may delete data at once. See the retention page. - Check what you export. Transcripts and
dynamic_variablescan hold personal data. Mask on arrival in your store. See PII redaction in logs and traces. This is not legal advice. - Docs disagree slightly. The OpenTelemetry page says return 2xx. The webhook page says HTTP 200. Return 200.
Where Evalgent fits
Evalgent Observe, which is launching, traces each failed call to the step or handoff that caused it and clusters failures into root causes. It is stack-agnostic and ingests data in OpenTelemetry format. It never sits in the media path, so nothing touches live audio. Where the supplied data cannot settle a cause, it says "undetermined" and shows the coverage gap.
For ElevenLabs agents observability, this works today through OpenTelemetry and the upload path; native connectors are planned. The OTLP JSON from step 5 is the shape to work from. Field mapping is worth agreeing with the team before you rely on it.
Evalgent also tests agents before launch from scenario sets and caller profiles. That pairs with the platform's own tests. See voice agent testing vs monitoring vs observability for how the three differ, and what is voice agent observability for the basics.
Frequently asked questions
Does ElevenLabs have observability built in?
Yes, in part. The docs describe conversation history, analytics, Spotlight, alerts, post-call webhooks, a conversation API and OpenTelemetry-shaped trace export. They do not describe a grouping of failures by root cause. For that you export the data and analyse it in a store you own.
What is the ElevenLabs post-call webhook?
It is an HTTPS call ElevenLabs sends after a conversation ends. The page documents post_call_transcription, post_call_audio and call_initiation_failure events. Delivery is HMAC-signed. Retries exist but are off by default, so enable them and reconcile through the API.
Can ElevenLabs export OpenTelemetry traces?
It exports OTLP-shaped JSON, not a direct push to your collector. You get it from a post-call webhook, the GET conversation API with format=opentelemetry, or a monitoring WebSocket. You then forward it to your backend yourself.
How do I list ElevenLabs conversations through the API?
Call GET /v1/convai/conversations with your xi-api-key. Use page_size up to 100 and the cursor from next_cursor. Filters include agent_id, call_start_after_unix, call_successful and version_id. Fetch each conversation by ID for the transcript and analysis.
Does ElevenLabs store call audio, and for how long?
The API exposes audio flags and an audio endpoint. Retention defaults to 2 years for conversation data, with separate settings for transcripts and audio. You can set days, -1 or 0. Check the audio retention page for audio-specific rules before depending on it.
What do success evaluation and data collection do?
Success evaluation runs your criteria on each transcript and returns success, failure or unknown with a rationale. Data collection extracts typed fields from the transcript. Both appear in the dashboard and in the post-call webhook. Both read the transcript, so they cannot see downstream system state.
Can I compare agent versions in ElevenLabs?
Yes, within its model. Branches carry a version_id, the dashboard filters and groups by branch, and experiments split live traffic and compare metrics. Changes outside those branches, such as a provider or backend change, need your own release tags.
What does the ElevenLabs platform view not show?
Per the pages I read, it does not describe grouping failures by the step that caused them, carrier-side detail beyond the documented telephony fields, or the state of your downstream records. It also keeps history only as long as your retention setting allows. A store you own covers these.
The bottom line
ElevenLabs Agents gives you a capable first layer of history, analysis, alerts and OpenTelemetry-shaped export, and the docs say how to pull it out. What it does not describe is cross-call root-cause grouping and the joins to your carrier and system-of-record data, so make ElevenLabs agents observability your own by exporting every conversation into a store you control.
Related Articles

How to automate voice agent testing: synthetic callers vs manual QA
Learn how ai test automation replaces manual QA for voice agents. Compare synthetic callers vs human testers, with a 5-step framework to scale without hiring.
Read more
AI Agent Testing vs Voice Agent Testing: What General Tools Miss for Voice
AI agent testing measures text outputs. Voice agent testing measures behaviour through an acoustic pipeline. Five failure categories general tools miss.
Read more