Trace Sampling for Voice Agents: Why You Can't Sample Away Failures
On this page
A web request lasts milliseconds. A phone call lasts minutes. That gap changes how you should sample traces.
Most sampling advice assumes short requests. You flip a coin when the request arrives. For a voice agent, that coin is flipped before anything has gone wrong, so the failure you most want to study may be the one you threw away.
This post is about voice agent trace sampling in the telemetry pipeline. It is not about which calls a human or a model should review. That is a different job, covered in how to sample live calls for evaluation and in score every call, not a sample. Here the question is narrower and earlier: which traces do you store at all?
Sources were read on November 21, 2026. Every worked-example number is illustrative.
Why a call is a long-lived trace
OpenTelemetry defines a trace as a set of spans linked by parent IDs. The root span is the one with no parent, and it marks the start and end of the whole operation.
For a voice agent, that root span is the call. Every turn, speech-to-text step, model call, tool call and speech-synthesis step hangs under it. Our posts on tracing a voice call end to end and on the OpenTelemetry approach for voice agents show the shape. For speech-to-speech stacks, see tracing realtime voice agents. The trace stays open for the whole call.
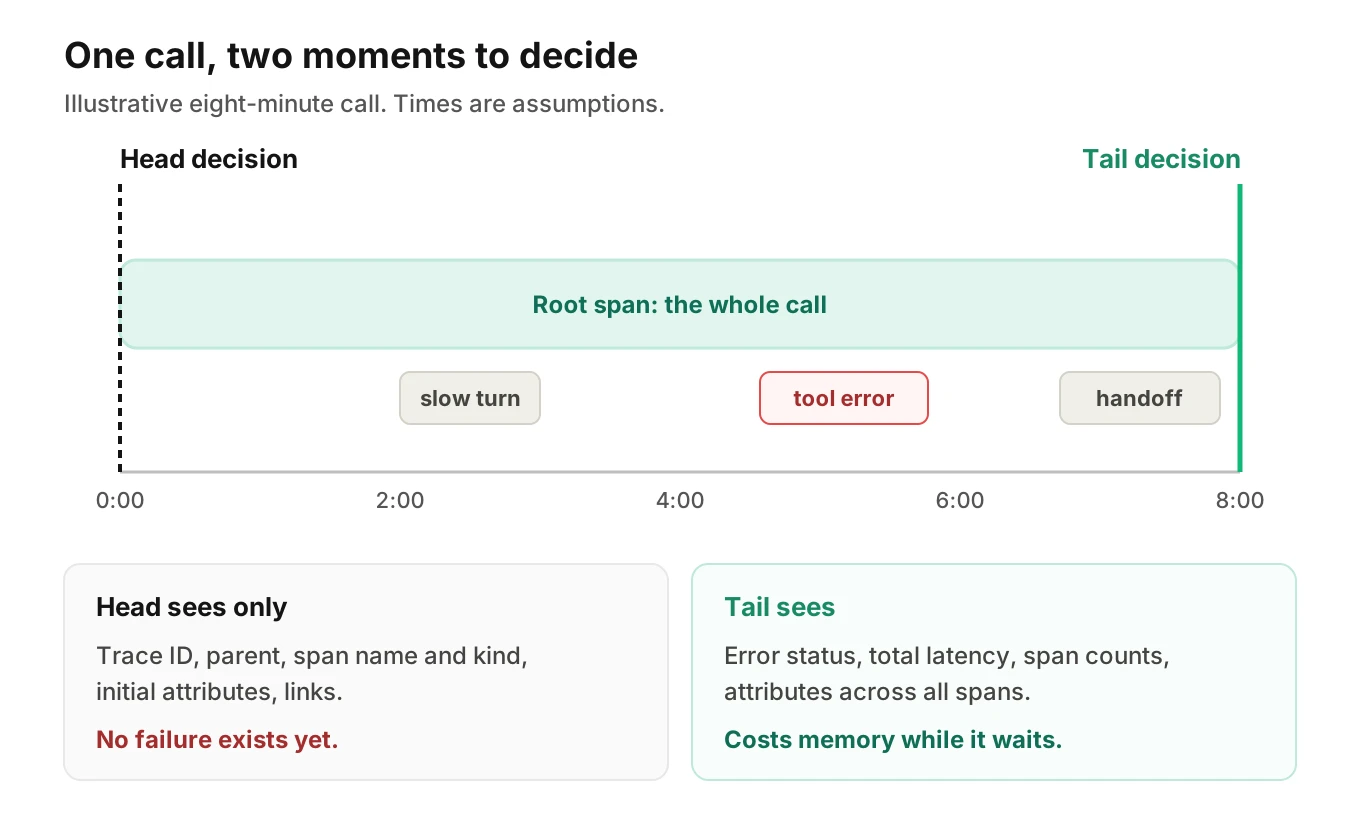
That has one consequence for sampling. The outcome of a call is unknown until the end. A tool may time out in minute five. The caller may ask for a person in minute six. A transfer may drop in minute seven. At second zero, a call that will fail and a call that will succeed look the same.
So there are two honest options. Decide at the start with chance and a few attributes, or wait and decide on the whole trace. Those are head-based and tail-based sampling.
Head-based vs tail-based sampling
Head sampling vs tail sampling is the central choice. The OpenTelemetry sampling concepts page gives the definitions. Head sampling makes the decision "as early as possible." Tail sampling decides "by considering all or most of the spans within the trace."
The same page states the limit of the head approach. With head sampling alone you cannot ensure that all traces with an error in them are kept, because the decision cannot use data from the entire trace.
It also names what tail sampling voice agents rely on. It can always keep traces that contain an error. It can keep traces based on overall latency. It also lists the price. Tail sampling can be difficult to implement. The components must be stateful and store a large amount of data. And tail samplers often end up as vendor-specific technology today.
| Question | Head-based sampling | Tail-based sampling |
|---|---|---|
| When is the decision made? | At the start, as early as possible | After most or all spans are seen |
| What can it use? | Trace ID, parent, name and initial attributes | Errors, total latency, span counts, attributes |
| Can it guarantee error traces are kept? | No | Yes, if the policy says so |
| Does it hold data while waiting? | No | Yes, spans sit in memory |
| Main cost | Lost rare failures | Memory, compute and operations |
Neither is wrong. Head sampling is cheap and fits failures common enough for chance to catch. For rare, costly failures on long calls, it is the wrong tool on its own.
Google's Dapper treated sampling as a core design choice. The Dapper paper cites the use of sampling as one of the choices behind its low overhead. Sampling is old and sound. The question is only where to place the decision.
What the SDK samplers can and cannot see
The OpenTelemetry SDK specification describes where head decisions happen. When the SDK creates a span, it asks the sampler first. The sampler receives the parent context, the trace ID, the span name, the span kind, the initial attributes and any links.
Notice what is missing. There is no outcome, no total duration and no later error. A head sampler can use only what exists at span creation. For a call, that might be the agent name, the tenant or the inbound line, if you set them as initial attributes. It cannot use "this call failed."
As of November 21, 2026, the spec page is marked Stable, except where otherwise specified. Three built-in samplers matter here.
- TraceIdRatioBased: keeps a fixed fraction of traces, decided by a deterministic hash of the trace ID. The same trace ID gets the same answer in any process.
- ParentBased: a wrapper that follows the parent's decision. If the call's root span is sampled, the child spans are too.
- AlwaysOn and AlwaysOff: keep everything or nothing.
The spec says TraceIdRatioBased ignores the parent's sampled flag. To respect it, use it as the root delegate of ParentBased. That is how a call stays whole: one decision at the root, followed by every span below it.
One status note. The spec marks TraceIdRatioBased as Stable but deprecated in favor of a composable ProbabilitySampler, which is marked Development. It says SDKs will not change the original sampler until at least January 1, 2027. Recheck it before you build.
The math: why random voice agent trace sampling loses rare failures
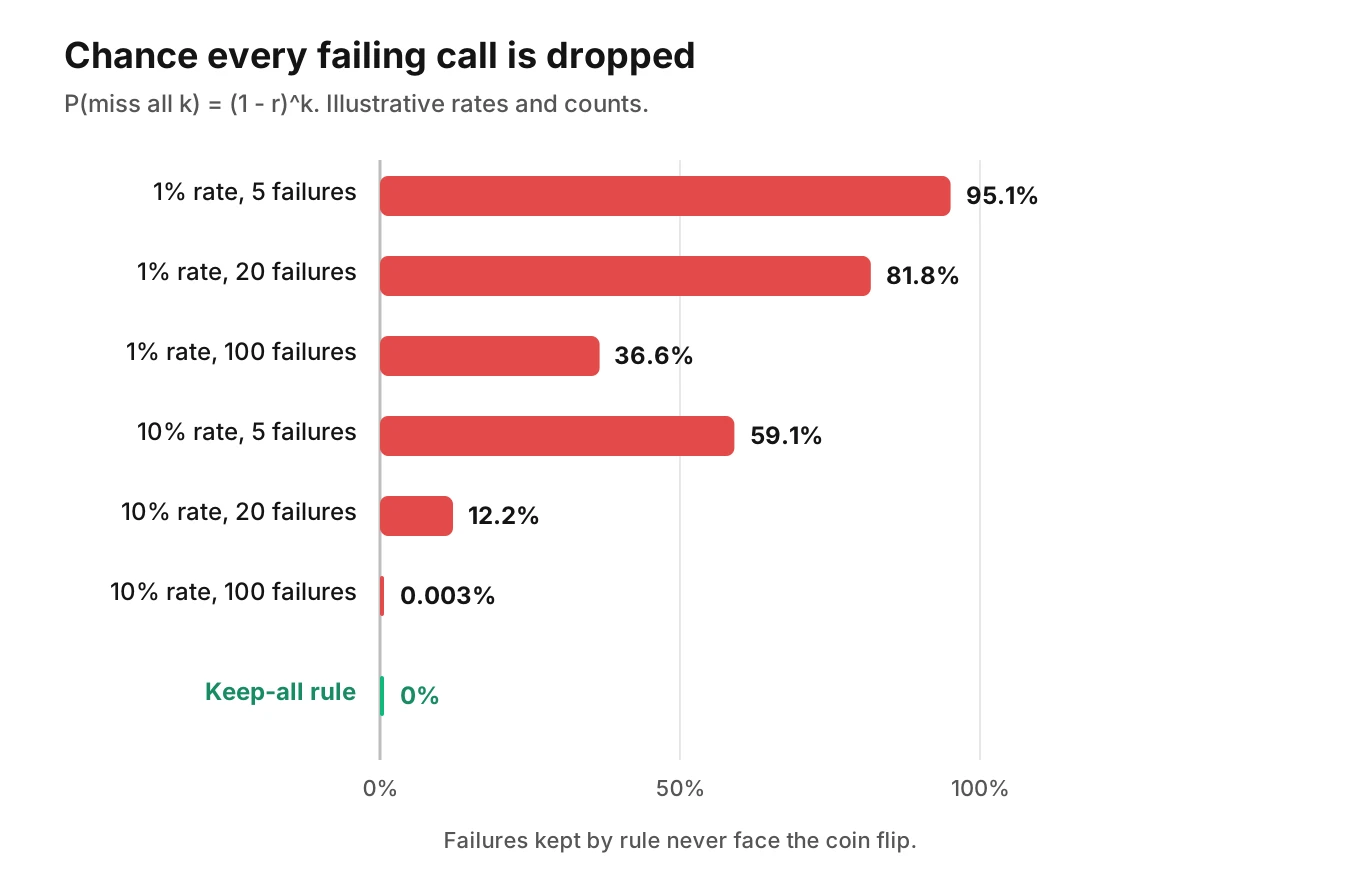
Random sampling, also called probabilistic sampling, keeps each trace with probability r. A failure mode that hits k calls is missed entirely when every one of those k traces is dropped. If each drop is independent, the chance is:
P(miss all k) = (1 - r)^k
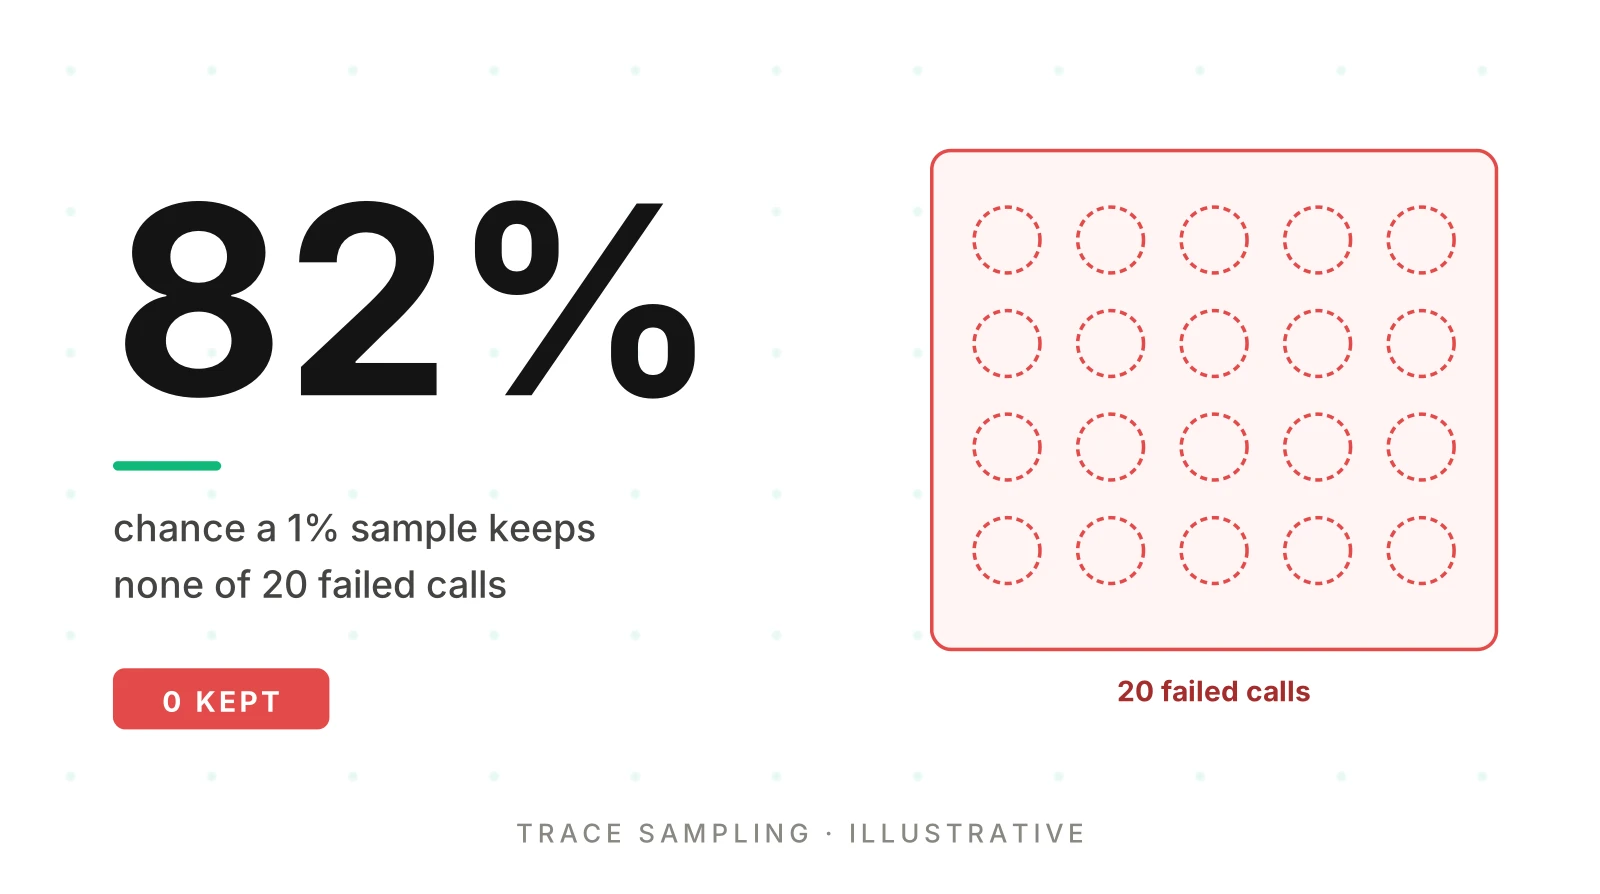
Worked example (illustrative). Assume 10,000 calls a day and a failure mode that hits 0.2% of calls. That is 20 failing calls a day. Sample 1% at random.
- Expected failing traces kept: 20 x 0.01 = 0.2 a day.
- Chance of keeping none of them: 0.99^20 = 0.818, or about 82%.
- Chance of keeping at least one: 18%.
So on most days you would not see this failure at all. Even a lucky day gives one trace. One trace cannot tell you whether the cause is a prompt, a tool or a carrier.
More rows from the same formula:
| Sample rate | Failing calls (k) | Chance all are dropped |
|---|---|---|
| 1% | 5 | 95.1% |
| 1% | 20 | 81.8% |
| 1% | 100 | 36.6% |
| 10% | 5 | 59.1% |
| 10% | 20 | 12.2% |
| 10% | 100 | 0.003% |
Flip the formula to ask what you need. To have a 95% chance of keeping at least one of k failures, you need (1 - r)^k at or below 0.05. At 1%, that takes about 298 failing calls. At 10%, about 29. A rare failure never reaches those counts before it has already hurt callers.
One kept failure is also not enough to fix it. You need enough traces to see a pattern. Clustering failures into root causes needs the failing calls to exist in your store. A sampler that deletes 99% of them leaves nothing to cluster.
What to keep in full
The fix for voice agent trace sampling is not a higher random rate. It is a sampling policy that never sends failures to the coin. Keep 100% of traces that match a failure signal. Sample only the traces that do not.
Four signals earn a keep-all rule.
Errors. Keep every trace that has a span with error status. The OpenTelemetry trace docs describe three statuses: Unset, Error and Ok. Unset is the default and means the operation completed without an error.
That default is a trap. A tool call can return an empty result with no error. A model can answer fluently and wrong. Every span may read Unset while the caller got nothing useful. If you want those traces kept, you must record the failure as an attribute or status yourself. The post on silent tool failures covers the pattern.
Long latency. Keep traces where total time or a turn gap crosses a limit you set. The tail sampling processor has a latency policy with a threshold in milliseconds. Per-turn gaps live inside the call, so the whole-call figure alone can hide a long silence. Record the gap as an attribute, as described in voice agent span attributes.
Handoffs and transfers. Keep every trace with a transfer, an agent swap or a request for a person. Handoffs are where context gets lost and calls get dropped. Handoff tracing explains how to keep that as one trace. Flag it with an attribute, then match on the attribute.
Rare or new things. Keep traces from a new release for a short window, and from low-volume tenants or languages. A 1% rate on a small tenant may keep nothing for days.
The tail sampling processor README lists many policy types. They include status_code, latency, probabilistic, span_count, and attribute policies for string, numeric and boolean values. A trace is kept when its decision flow ends in a sample decision.
Here is a simplified shape. It is a sketch, not a tuned config. The numbers are placeholders.
processors:
  tail_sampling:
    decision_wait: 10m
    num_traces: 50000
    sampled_cache_size: 100000
    policies:
      - name: keep-errors
        type: status_code
        status_code: {status_codes: [ERROR]}
      - name: keep-slow-calls
        type: latency
        latency: {threshold_ms: 5000}
      - name: sample-healthy
        type: probabilistic
        probabilistic: {sampling_percentage: 5}
A handoff rule would be one more policy of an attribute type, matching the flag you set. Check the README for that policy's exact fields on your Collector version.
Waiting for the end of the call
Tail sampling needs the whole trace, or most of it. For a phone call, that means waiting.
This OpenTelemetry tail sampling setup runs in the Collector. The tail sampling processor README lists its stability as beta for traces, as of November 21, 2026. Three of its settings shape a voice deployment.
- decision_wait: the default is 30 seconds. The README calls it the "time before timer handling for a trace." It does not say whether the clock starts at the first span, so read the source for your version.
- num_traces: the default is 50,000. This is the number of traces kept in memory. When a new trace arrives and the buffer is full, the oldest trace is removed. The README warns this can cause a trace to be dropped before it is sampled.
- sampled_cache_size and non_sampled_cache_size: both default to 0, which turns the cache off.
A 30-second default is built for short requests. A six-minute call does not fit inside it. If the processor decides while the call is still going, it judges a partial trace. The late error in minute five is not in the data it saw.
You have two ways to handle that. You can raise the wait above your longest normal call. Or you can close the root span at call end and decide at that moment.
Worked example (illustrative). Memory scales with arrival rate times hold time, which is Little's law: L = lambda x W.
- Peak of 2,000 calls an hour is 0.56 calls per second.
- A call lasts 360 seconds. Add a 30-second margin. Hold time W is 390 seconds.
- Traces in the buffer: 0.56 x 390 = about 217.
At that load, 50,000 is plenty. But the buffer holds spans, and a long call has many. Scale the same math. At about 128 new calls per second, the buffer holds 50,000 traces and starts evicting the oldest. Size from your own span counts, not from trace counts.
Two more gotchas come from the README.
Late spans. A span is late if it arrives after its trace's decision. Post-call work such as a summary, a write-back or a webhook often arrives this way. With no decision cache, the late spans are buffered and a new decision is made. A kept trace can then lose its tail, or a dropped trace can be revived in pieces. A sampled-trace cache keeps the "keep" decision for later spans.
One collector per trace. The README states that all spans for a given trace must reach the same Collector instance. It recommends two layers: one with the load balancing exporter and one with the tail sampling processor. If spans for one call land on different instances, each instance decides on a fragment.
Keep metrics unsampled
Sampling traces is safe only if the numbers you watch do not come from the sampled traces.
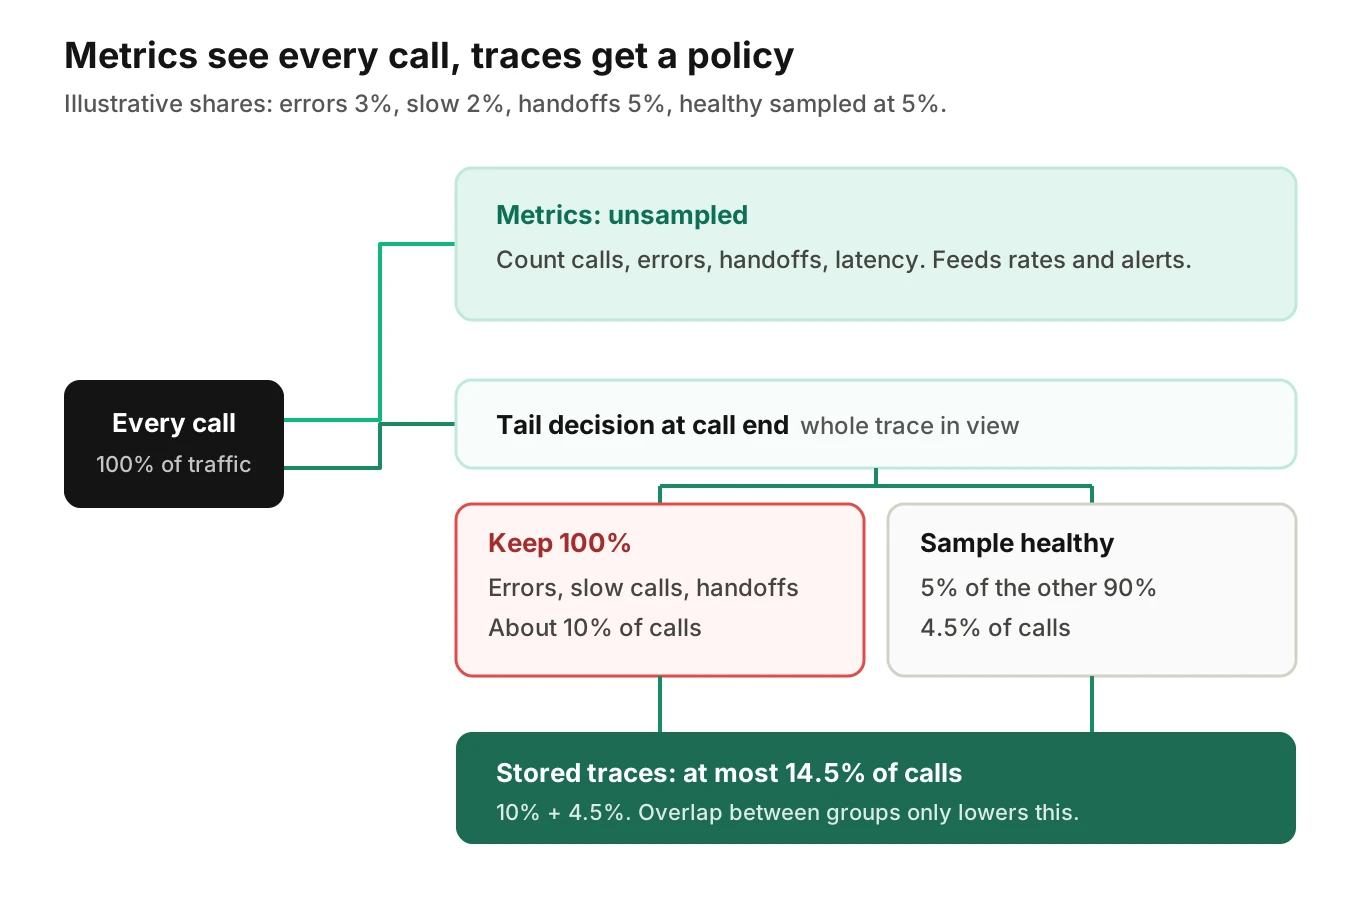
OpenTelemetry defines a metric as "a measurement of a service captured at runtime." Count calls, errors, handoffs and latency buckets as the calls happen, before any sampler runs. A counter costs almost nothing per call. A full trace costs a lot.
Here is why it matters. Worked example (illustrative). Assume 3% of calls fail. Keep all failures and 5% of healthy calls. For every 100 calls, you store 3 failing traces and 0.05 x 97 = 4.85 healthy ones. Failures are 3 of 7.85 stored traces, or 38%. Anyone who computes an error rate from the store reads 38% when the true rate is 3%.
Weights can fix the ratio if you record them: each healthy trace stands for 20 calls at 5%. Simpler still, keep unsampled counters and treat traces as evidence, not a count.
Unsampled metrics also feed alerting. Anomaly detection for voice agent metrics assumes a complete series. A sampled one gives it biased input.
The cost trade-off
The OpenTelemetry sampling page says sampling is one of the most effective ways to reduce the cost of observability without losing visibility. It also lists the compute cost of effective sampling as a cost to weigh. Tail sampling spends some of the savings on its own memory and processing.
Worked example (illustrative). Assume errors are 3% of calls, slow calls 2% and handoffs 5%. Assume the groups do not overlap, which overstates the share. Keep all of them, plus 5% of the rest.
- Keep-all share: 3% + 2% + 5% = 10%.
- Healthy share sampled: 90% x 5% = 4.5%.
- Stored: 10% + 4.5% = 14.5% of traces, at most.
That is a cut of roughly 85% in stored trace volume, so voice agent trace sampling pays for itself fast. It keeps every trace you would open during an incident. Real rates will differ. The shape is the point: cost follows your failure rate, not your call volume.
Two limits apply.
- A bad day costs more. An outage raises the error rate, so storage spikes when you need the data most. Add a rate limit on the keep-all path as a safety valve, and watch what it drops.
Sample after you mask, too. Sampling does not remove personal data from the traces you keep. See where to mask in logs and traces.
Where Evalgent fits
Evalgent Observe, which is launching, works from the OpenTelemetry data you send. It traces each failure to the step or handoff that caused it and groups failures into root causes. It never sits in the media path.
Sampling decides what data exists to analyze. If you drop a failing call before it is sent, no tool can explain it later. Where the data is blind, Observe says "undetermined" and shows the coverage gap. Your sampling rules stay in your own pipeline.
Evalgent Monitor is live. It works on production calls and flags tool-call failures, latency spikes, PII leakage and policy failures with fix recommendations. Evalgent works with teams to set up evals and monitoring for their first agent. It is not self-serve. If you want to talk through your own traffic, you can book a short call.
How to set up voice agent trace sampling in 7 steps
1. Measure your calls - Record call length, spans per call and the rates of errors, slow calls and handoffs from your own data. Every later number depends on them.
2. Count metrics first - Emit call, error, handoff and latency metrics from every call before any sampler runs. Never derive rates from kept traces.
3. Make failures visible on spans - Set an explicit error status or attribute for silent failures, long gaps and handoffs. A policy can only match what you recorded.
4. Use one decision per call - Use ParentBased with a ratio root in the SDK so a call keeps all its spans or none.
5. Choose where the real decision lives - Keep SDK head sampling loose, and run tail sampling in a Collector tier that sees whole calls. Route all spans for one call to one instance.
6. Write keep-all rules, then sample the rest - Keep errors, slow calls and handoffs at 100%. Sample healthy calls at a rate your budget allows.
7. Set the wait and the cache - Set the wait above your longest normal call, and enable a decision cache for late spans. Then run a test failure and confirm its trace survives.
For step 7, force a tool timeout late in a long test call and check that the stored trace is complete. Repeat after every Collector upgrade.
Frequently asked questions
What is head-based sampling?
Head-based sampling decides whether to keep a trace as early as possible, when its first span is created. It can use the trace ID, the parent and the initial attributes. It cannot use later errors or total duration, so it cannot guarantee that failing traces are kept.
What is tail-based sampling?
Tail-based sampling decides after most or all spans of a trace have arrived. It can keep every trace with an error or a long total time. The cost is state. The sampler must hold spans in memory until it decides, which takes memory, compute and careful routing.
Why does random sampling miss failures?
Random sampling treats every trace alike, so a rare failure faces the same odds as a healthy call. The chance of missing all k failures at rate r is (1 - r)^k. Illustratively, at 1% with 20 failures, that is about 82%.
Can I sample voice agent traces without losing errors?
Yes, with tail sampling. Keep 100% of traces with errors, long latency or handoffs, and sample only the healthy rest. Record silent failures as explicit attributes, because the default span status is Unset. A policy cannot match a failure you never marked.
How long should tail sampling wait for a call?
Longer than your longest normal call plus a margin. The Collector processor's default wait is 30 seconds, built for short requests. Pick the value from your own call-length data, and note that a longer wait holds more traces in memory.
Should metrics be sampled?
No. Count calls, errors, handoffs and latency on every call before sampling. Rates computed from kept traces are skewed, because you keep failures at 100% and healthy calls at a fraction. Metrics are cheap, and they drive alerting.
Does trace sampling reduce observability cost?
Yes. OpenTelemetry's sampling page calls it one of the most effective ways to cut cost. Illustratively, keeping all failures plus 5% of healthy traces stores at most 14.5% of traces. Tail sampling adds its own memory and compute cost.
Is the tail sampling processor stable?
As of November 21, 2026, its README lists traces as beta. The probabilistic sampler processor lists traces as beta and logs as alpha. Beta means behavior and settings can still change, so pin your Collector version and test upgrades with a known failing call.
The bottom line
A call is one long trace, so the decision to keep it belongs at the end of the call, where errors, slow turns and handoffs are visible. Keep every failure, sample the healthy calls, and count metrics before any sampler runs.
Related Articles

How to automate voice agent testing: synthetic callers vs manual QA
Learn how ai test automation replaces manual QA for voice agents. Compare synthetic callers vs human testers, with a 5-step framework to scale without hiring.
Read more
AI Agent Testing vs Voice Agent Testing: What General Tools Miss for Voice
AI agent testing measures text outputs. Voice agent testing measures behaviour through an acoustic pipeline. Five failure categories general tools miss.
Read more